
While researching for ETF Day, I found a number of interesting themes that you should be aware of. Rotation is beginning to shift. Maybe it is for a few days, but I don't think so.
Bonds made an appearance in most of my scans, short-term bonds and municipal bonds. I believe interest rates are actually going to rise a bit more so I opted not to include them.
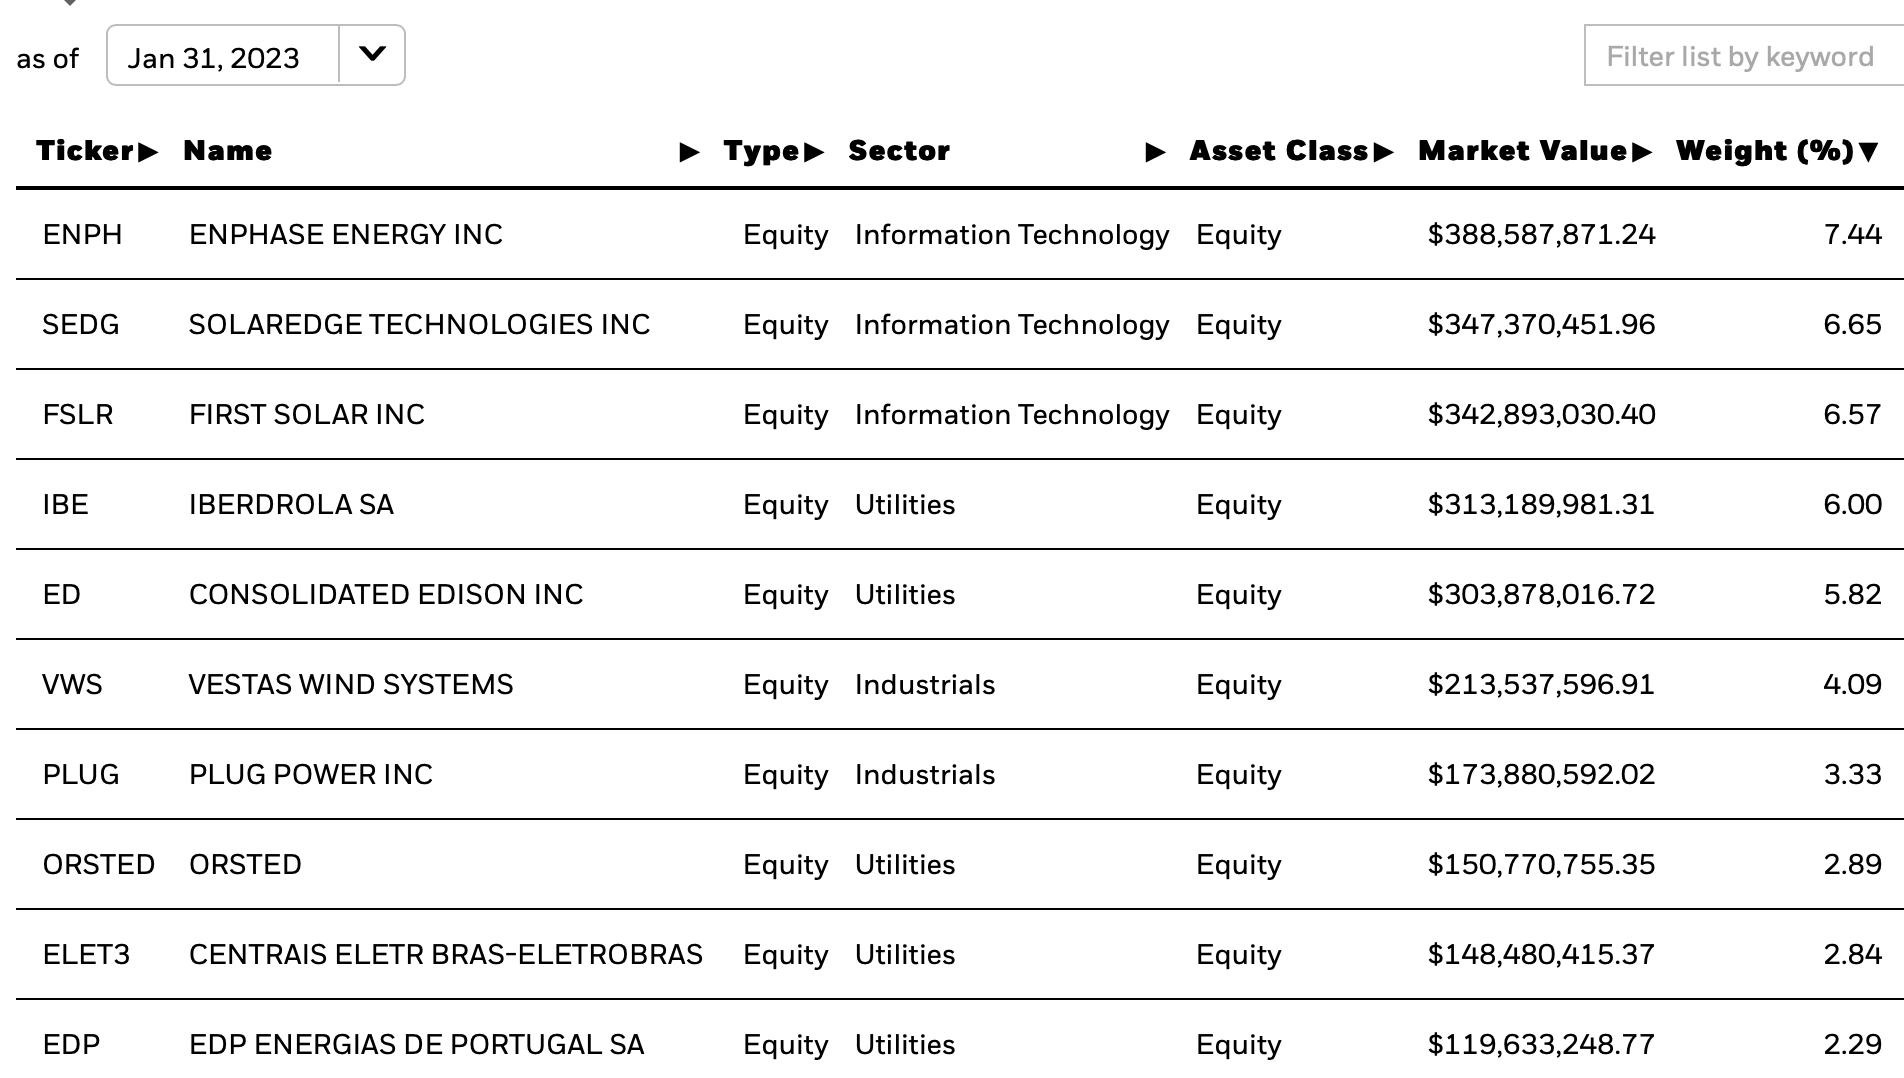
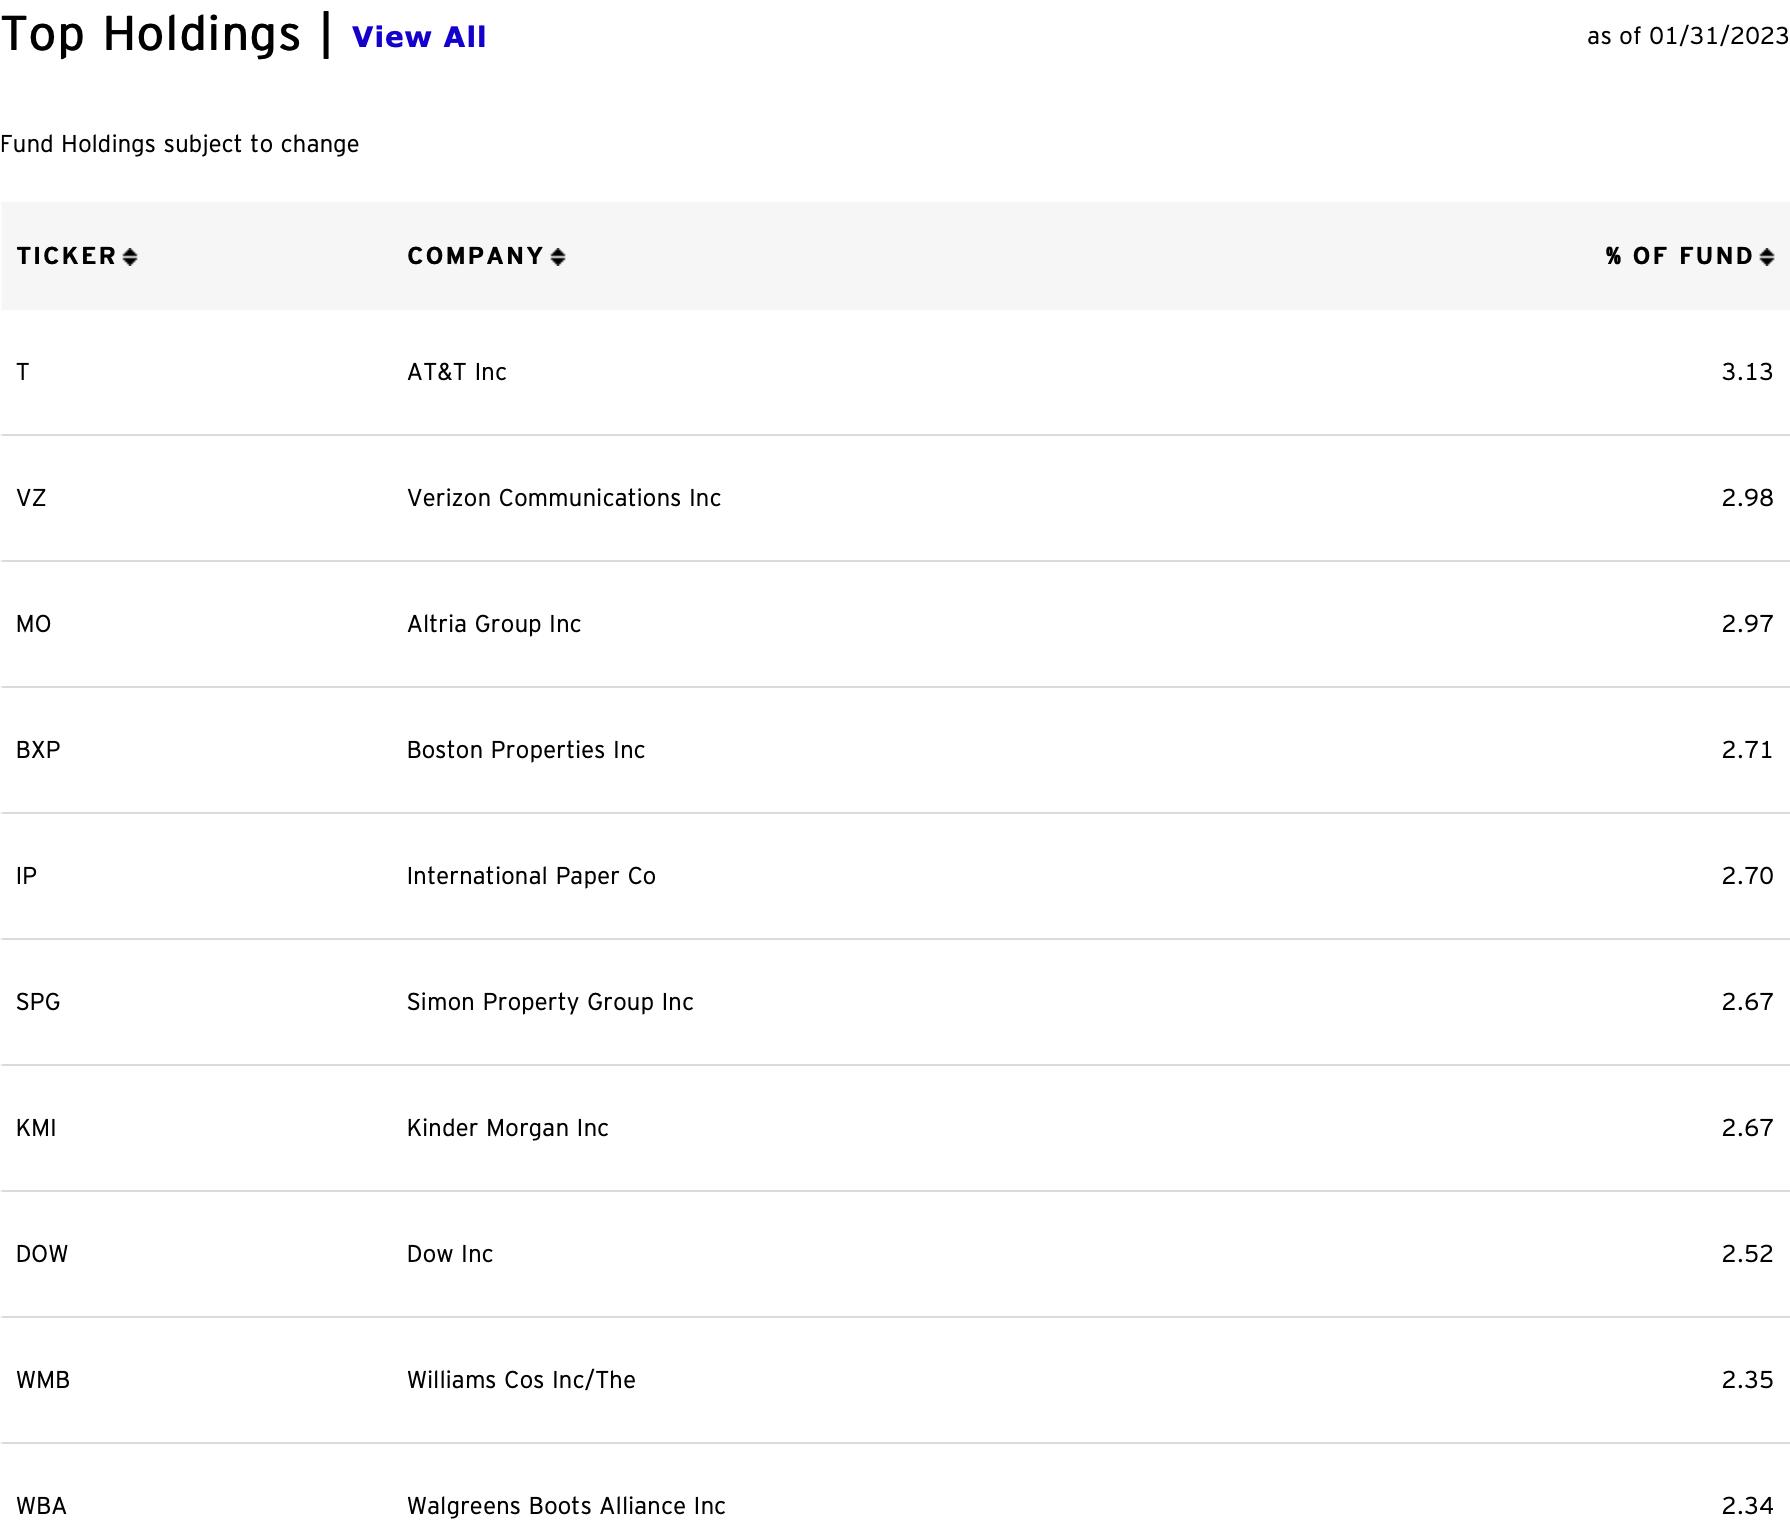
Growth ETFs were mostly absent from my scan results. The emphasis was on Consumer Staples and High Dividend ETFs. Renewable Energy (TAN) is showing renewed momentum, but I opted to go with what I would call a 'sister' of the Clean Energy ETF (QCLN) that I presented last month. It is the Global Clean Energy ETF (ICLN). I liked the top holdings of this one as it takes advantage of solar stocks along with other clean energy alternatives.
Finally, we've been waiting too long for Crude Oil to reverse. It is showing weakness and consequently, I went with an inverse of the Oil & Gas Industry. I think the inverse Energy ETF (ERY) is worth a look right now as well.
Tommorow is mailbag and reader request day so send in your questions and symbols soon so I'll have time to review and possibly include them in the blog.
Good Luck & Good Trading,
Erin
Today's "Diamonds in the Rough": DUG, ICLN and SPHD.
Runner-ups: CGDV, FALN, FSTA, IEUR, SCO and TAN.

RECORDING LINK (1/27/2023):
Topic: DecisionPoint Diamond Mine (1/27/2023) LIVE Trading Room
Passcode: January#27
REGISTRATION for 2/3/2023:
When: Feb 3, 2023 09:00 AM Pacific Time (US and Canada)
Topic: DecisionPoint Diamond Mine (2/3/2023) LIVE Trading Room
Register in advance for this webinar HERE
After registering, you will receive a confirmation email containing information about joining the webinar.

Here is the last recording (1/30):
Welcome to DecisionPoint Diamonds, wherein I highlight ten "Diamonds in the Rough" per week. These are selected from the results of my DecisionPoint Scans which search for stocks that could benefit from the trend and condition of the market. Remember, these are not recommendations to buy or sell, but are the most interesting of the stocks that surfaced in my scans. My objective is to save you the work of the initial, tedious culling process, but you need to apply your own analysis to see if these stocks pique your interest as well. There are no guaranteed winners here!
"Predefined Scans Triggered" are taken from StockCharts.com using the "Symbol Summary" option instead of a "SharpChart" on the workbench.
Stop levels are all rounded down.
ProShares UltraShort Oil & Gas (DUG)
EARNINGS: N/A
DUG provides -2x exposure to a market-cap-weighted index of large US oil and gas companies. Click HERE for more information.
Predefined Scans Triggered: Elder Bar Turned Green and Bullish MACD Crossovers.
DUG is down -0.92% in after hours trading. The US Oil Fund (USO) chart has been deteriorating so it isn't surprising to see this inverse ETF getting bullish. The RSI has just inched into positive territory above net neutral (50). We have a bullish double-bottom forming. The PMO is about to trigger a crossover BUY signal. Volume is coming in based on the OBV. Stochastics are rising and just hit positive territory. Relative strength isn't great, but it isn't bad right now. The stop is set below those two little lows in mid-January at 7.3% around $11.13.
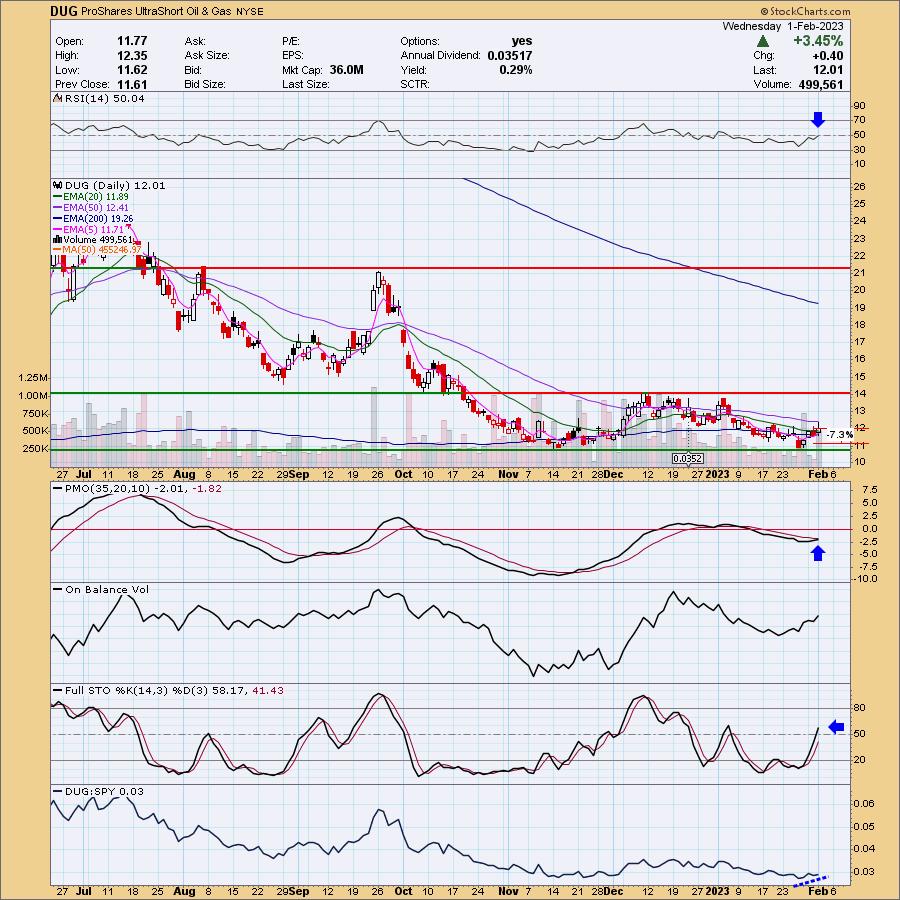
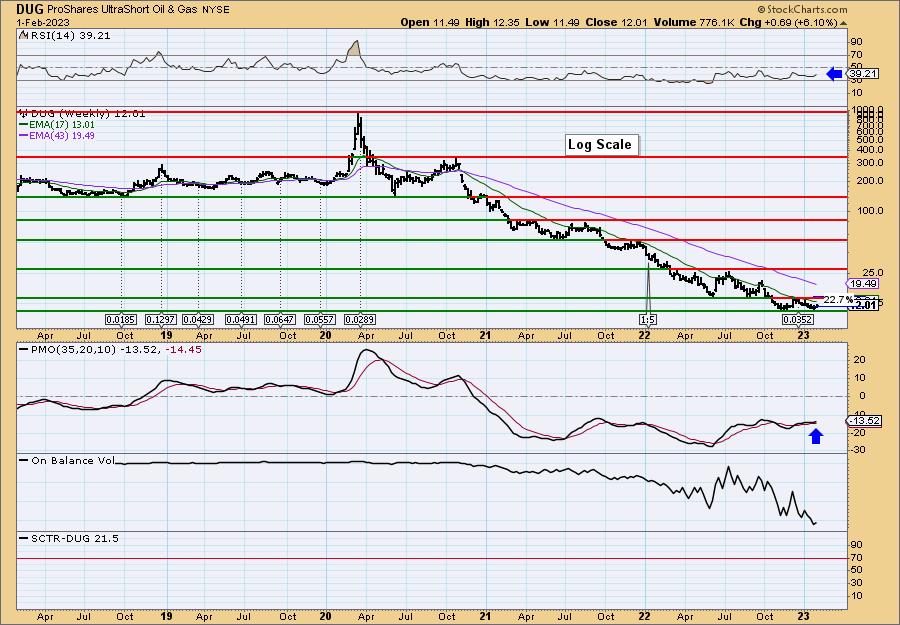
The double-bottom is also visible on the weekly chart. The weekly RSI is negative, but the weekly PMO is beginning to accelerate on a crossover BUY signal. Upside potential if it reaches the confirmation line of the double-bottom pattern, is over 22%.
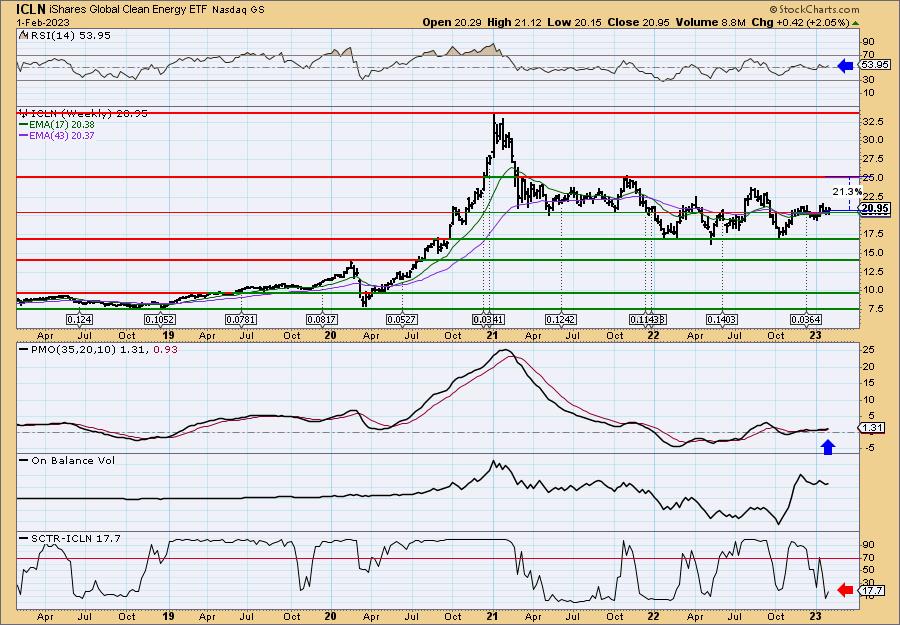
iShares Global Clean Energy ETF (ICLN)
EARNINGS: N/A
ICLN tracks a tiered index of global companies involved in clean energy businesses. Click HERE for more information.
Predefined Scans Triggered: Improving Chaikin Money Flow and Parabolic SAR Buy Signals.
ICLN is up +0.53% in after hours trading. Price bounced off support at key moving averages and late November/early December lows. This is a cup and handle looking pattern that would imply price will break above the rim of the cup. The handle also is a confirmed bullish falling wedge. The RSI is positive and rising. The PMO is in the process of generating a crossover BUY signal. Stochastics look a bit suspect as they are in a declining trend, but they did turn up. Relative strength is just now starting to improve. The OBV holds a mild positive divergence with price lows. The stop can be set tightly if you wish around 4.7% or $19.96.
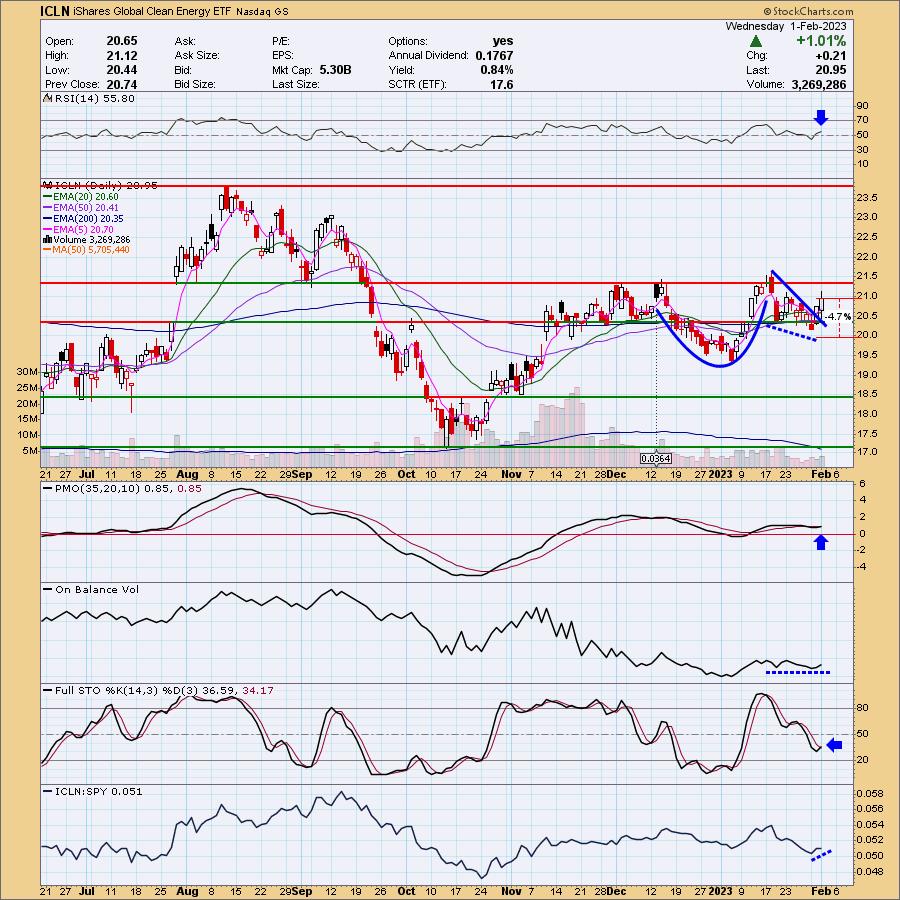
Price has basically been traveling within a large trading range. It is in the middle of the range so it is vulnerable to some serious downside if it decides to fall to the next support level. However, indicators suggest we don't have to worry too much. The weekly RSI is positive and not overbought. The weekly PMO is rising gently on a crossover BUY signal. The SCTR is in the basement which I don't like, but given the configuration of the weekly PMO and weekly RSI, I'm okay with it.
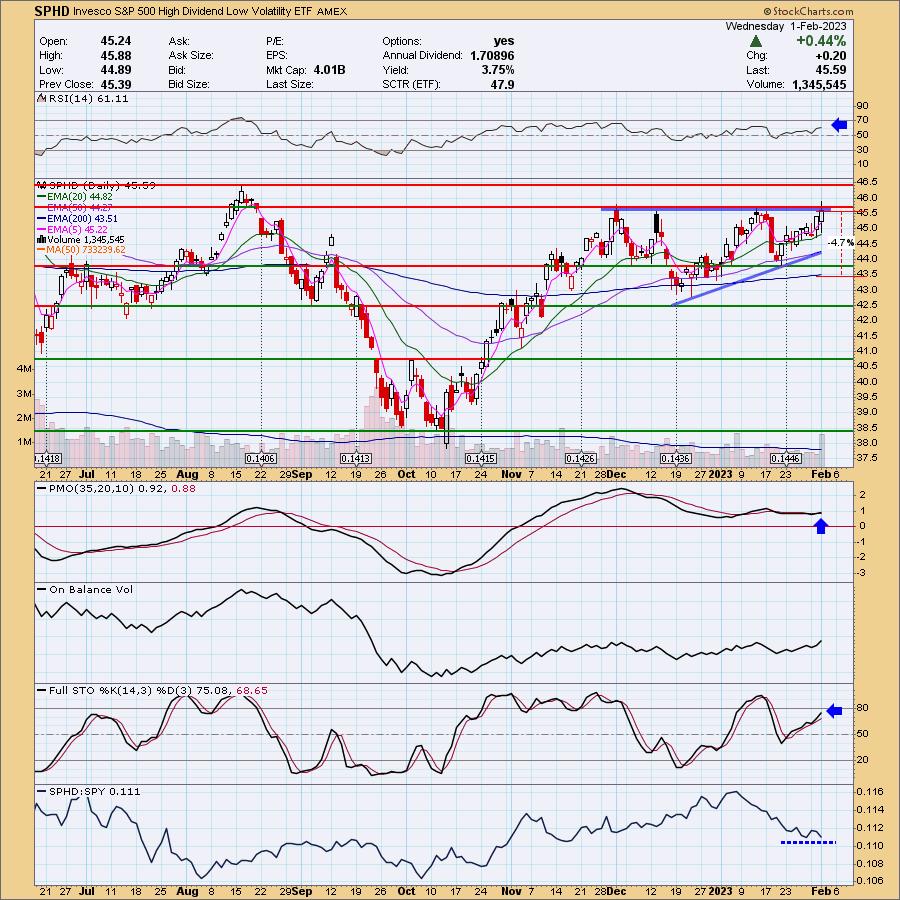
Invesco S&P 500 High Dividend Low Volatility ETF (SPHD)
EARNINGS: N/A
SPHD tracks a dividend-yield-weighted index comprising the least volatile, highest dividend-yielding S&P 500 stocks. Click HERE for more information.
Predefined Scans Triggered: New CCI Buy Signals and P&F Low Pole.
SPHD is up +0.90% in after hours trading. Price is about to breakout of a bullish ascending triangle. The RSI is positive and the PMO is rising on a buy signal. The margin between the PMO and its signal line is razor thin so a big down day could sabotage SPHD. Stochastics look healthy. Relative strength is okay, but I would like to see the relative strength line to turn up. The stop can be set thinly below the 200-day EMA at 4.7% or $43.44.
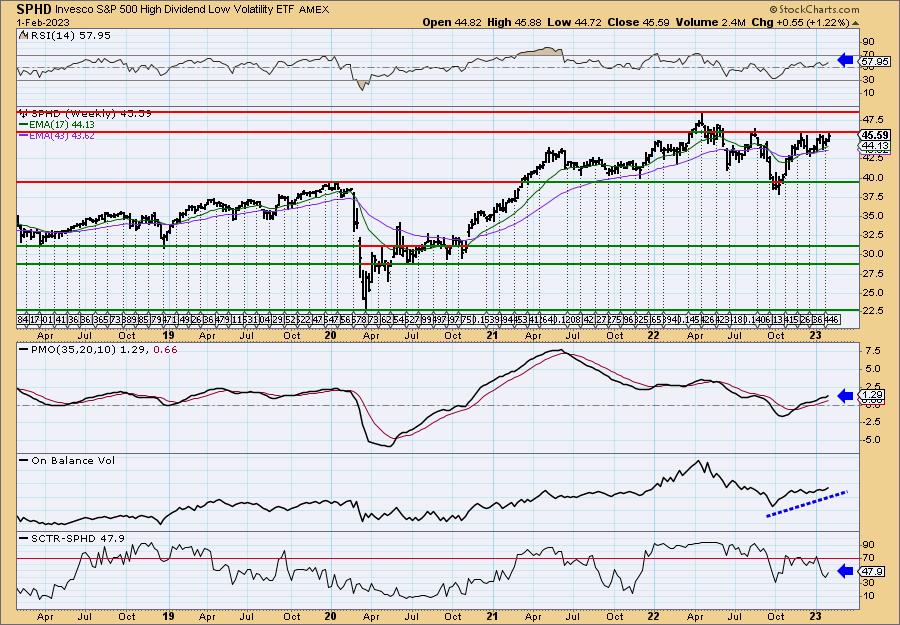
Price is bumping up against resistance and resistance so far is winning. It has formed a reverse head and shoulders which would be confirmed with a breakout. The weekly RSI is positive and the weekly PMO is accelerating higher. The OBV is showing accumulation. It is near all-time highs, so consider an upside target of about 15% near $52.43.
Don't forget, on Thursdays I look at reader-requested symbols, click HERE to send me an email. I read every email I receive and try to answer them all!
Current Market Outlook:
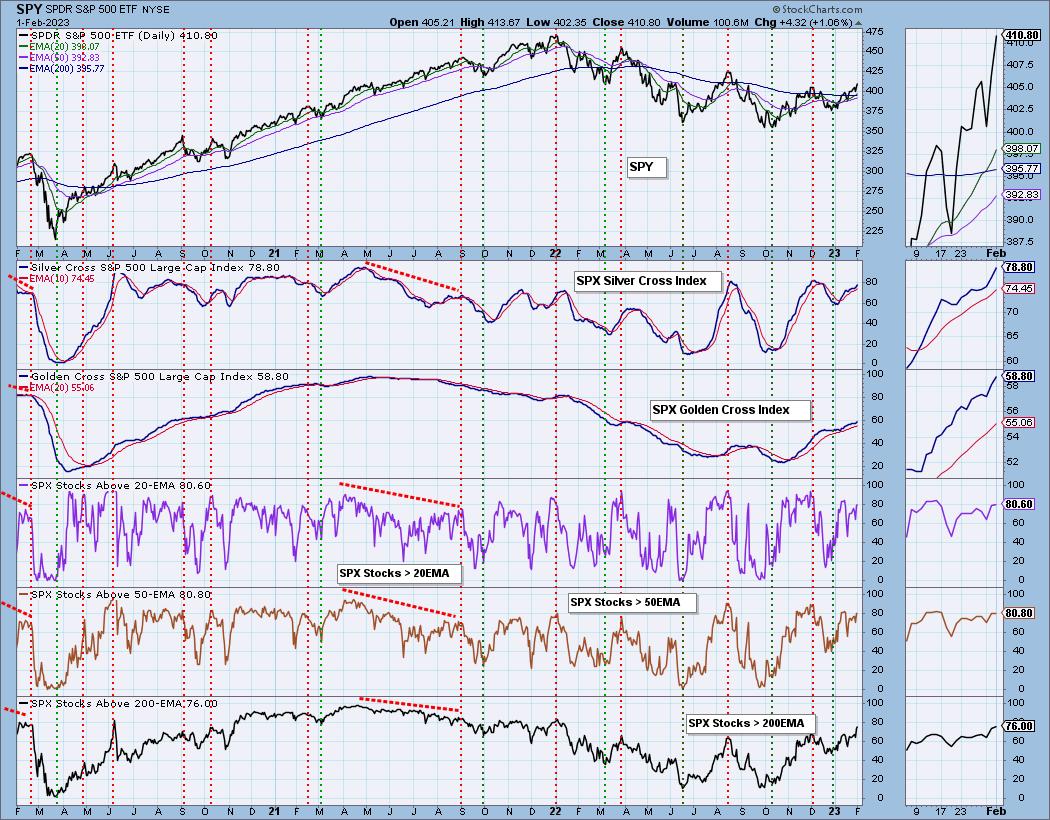
Market Environment: It is important to consider the odds for success by assessing the market tides. The following chart uses different methodologies for objectively showing the depth and trend of participation for intermediate- and long-term time frames.
- The Silver Cross Index (SCI) shows the percentage of SPX stocks on IT Trend Model BUY signals (20-EMA > 50-EMA)
- The Golden Cross Index (GCI) shows the percentage of SPX stocks on LT Trend Model BUY signals (50-EMA > 200-EMA)
Don't forget that as a "Diamonds" member, you have access to our GCI/SCI curated ChartList on DecisionPoint.com. You'll find it under "Members Only" links on the left side on the Blogs and Links Page.
Here is the current chart:
Full Disclosure: I am 18% exposed.
I'm required to disclose if I currently own a stock I mention and/or may buy/short it within the next 72 hours.
"Technical Analysis is a windsock, not a crystal ball." - Carl Swenlin
(c) Copyright 2023 DecisionPoint.com
Watch the latest episode of DecisionPoint Trading Room with Carl & Erin Swenlin on Mondays 7:00p EST or on the DecisionPoint playlist on the StockCharts TV YouTube channel here!
NOTE: The stocks reported herein are from mechanical trading model scans that are based upon moving average relationships, momentum and volume. DecisionPoint analysis is then applied to get five selections from the scans. The selections given should prompt readers to do a chart review using their own analysis process. This letter is not a call for a specific action to buy, sell or short any of the stocks provided. There are NO sure things or guaranteed returns on the daily selection of "Diamonds in the Rough."
Regarding BUY/SELL Signals: The signal status reported herein is based upon mechanical trading model signals and crossovers. They define the implied bias of the price index/stock based upon moving average relationships and momentum, but they do not necessarily call for a specific action. They are information flags that should prompt chart review. Further, they do not call for continuous buying or selling during the life of the signal. For example, a BUY signal will probably (but not necessarily) return the best results if action is taken soon after the signal is generated. Additional opportunities for buying may be found as price zigzags higher, but the trader must look for optimum entry points. Conversely, exit points to preserve gains (or minimize losses) may be evident before the model mechanically closes the signal.
Helpful DecisionPoint Links:
DecisionPoint Shared ChartList and DecisionPoint Chart Gallery
Price Momentum Oscillator (PMO)
Swenlin Trading Oscillators (STO-B and STO-V)
For more links, go to DecisionPoint.com