
Reader requests arrived from all walks of the market. I selected one stock from each of the following sectors: Financials, Industrials, Energy and Healthcare. If you would like your symbol looked at, send me an email to support@decisionpoint.com and it might get selected! If not, I'll try to cover it in the Diamond Mine trading room on Fridays.
Speaking of the trading room, be sure and sign up using the link below the Diamonds logo. You'll also find the recording to last week's Diamond Mine trading room in the same place. Hope to see you there!
Good Luck & Good Trading,
Erin
Today's "Diamonds in the Rough": BCTX, LTHM, MPC and PLMR.
Other requests: APTV, CAL, SIX, ATEC, GNRC, NRGU, ZEUS, MRNA, SBUX and PPC.

RECORDING LINK (2/10/2023):
Topic: DecisionPoint Diamond Mine (2/10/2023) LIVE Trading Room
Passcode: Feb@10th
REGISTRATION for 2/17/2023:
When: Feb 17, 2023 09:00 AM Pacific Time (US and Canada)
Topic: DecisionPoint Diamond Mine 2/17/2023 LIVE Trading Room
Register in advance for this webinar HERE
After registering, you will receive a confirmation email containing information about joining the webinar.

Here is the last recording (2/6):
Welcome to DecisionPoint Diamonds, wherein I highlight ten "Diamonds in the Rough" per week. These are selected from the results of my DecisionPoint Scans which search for stocks that could benefit from the trend and condition of the market. Remember, these are not recommendations to buy or sell, but are the most interesting of the stocks that surfaced in my scans. My objective is to save you the work of the initial, tedious culling process, but you need to apply your own analysis to see if these stocks pique your interest as well. There are no guaranteed winners here!
"Predefined Scans Triggered" are taken from StockCharts.com using the "Symbol Summary" option instead of a "SharpChart" on the workbench.
Stop levels are all rounded down.
BriaCell Therapeutics Corp. (BCTX)
EARNINGS: Not Listed.
BriaCell Therapeutics Corp. is an immuno-oncology biotechnology company, which engages in the development of immunotherapies for treatment of cancer. Its technologies include Bria-IMT and Bria-OTS. The company was founded by Charles L. Wiseman and Isaac B. Maresky on July 26, 2006 and is headquartered in West Vancouver, Canada.
Predefined Scans Triggered: None.
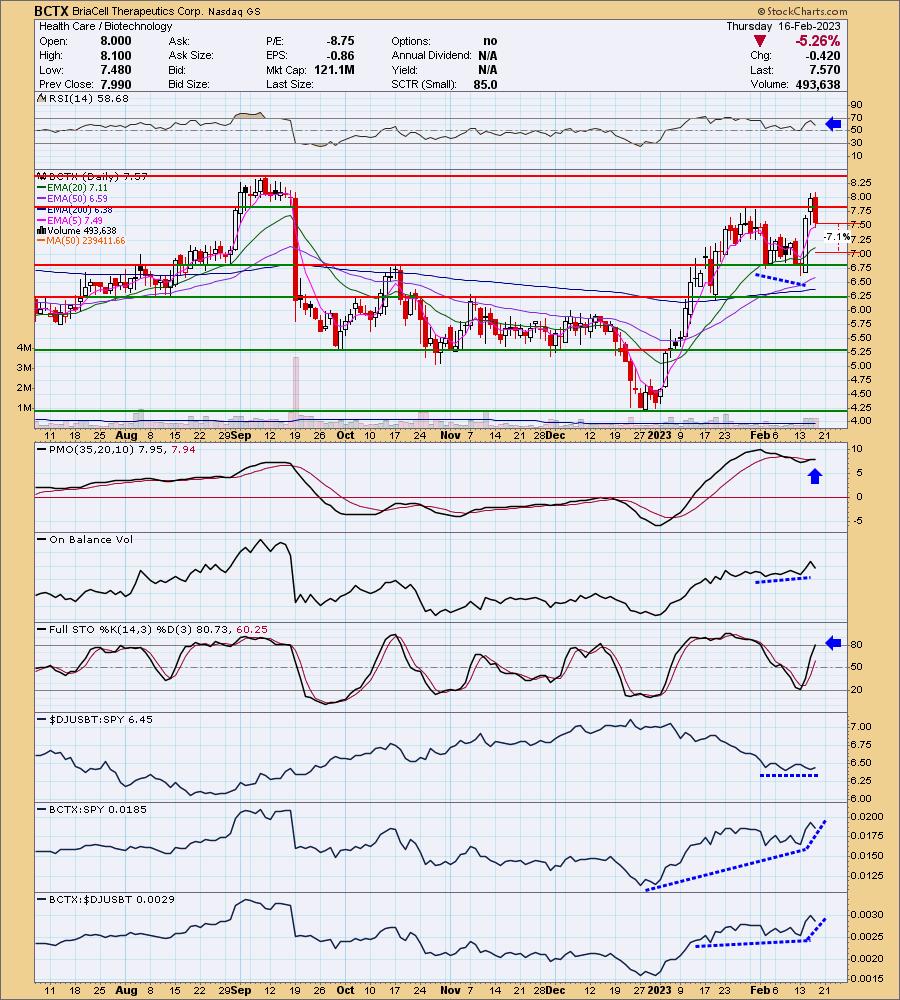
BCTX is down -0.13% in after hours trading. Today we saw a pullback after a breakout. I would've preferred it had stayed above prior resistance. It is now ready to bounce off the 5-day EMA. The RSI is positive even after today's big decline. The PMO is on a brand new crossover BUY signal. I note a positive OBV divergence going into this rally and Stochastics have just popped above 80. The Biotech group is performing mostly in line with the market. BCTX is outperforming both. The stop is set around 7.1% or $7.03.
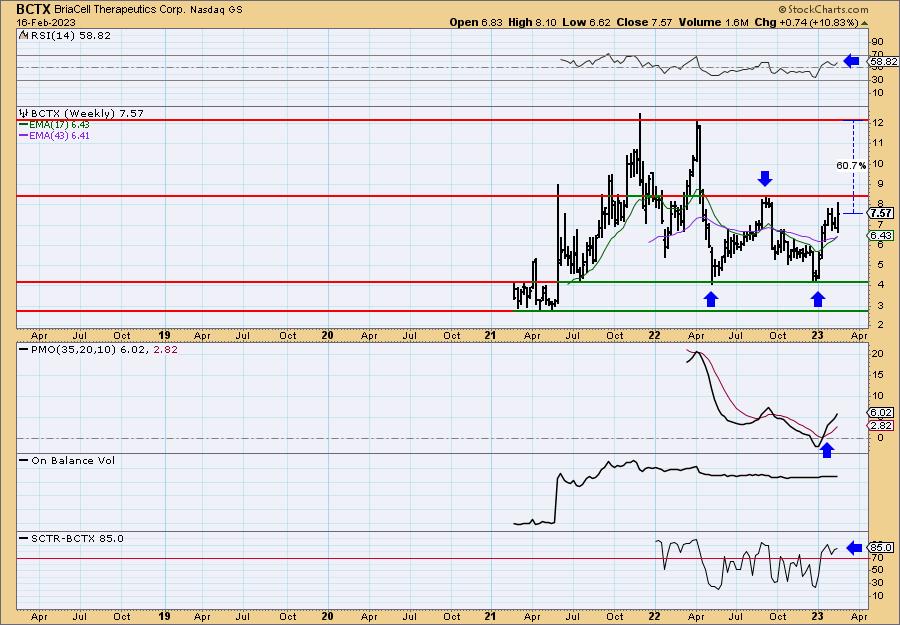
I really like the large bullish double-bottom on the weekly chart. If price gets above the confirmation line drawn across the middle of the 'W', the minimum upside target would bring price to all-time highs. The weekly RSI is positive and the weekly PMO is on a crossover BUY signal, rising strongly. The SCTR is well within the "hot zone" above 70. We call it the "hot zone" because it implies that the stock/ETF is in the top 30% of its "universe" (large-, mid-, small-caps and ETFs) as far as trend and condition, particularly in the intermediate and long terms. Upside potential is over 60%.
Livent Corp. (LTHM)
EARNINGS: 05/02/2023 (AMC)
Livent Corp. engages in the production of performance lithium compounds. Its products include battery-grade lithium hydroxide, butyllithium, and purity lithium metal which are used in various performance applications. It operates through the following geographical segments: North America, Europe, Middle East, and Africa, Latin America, and Asia Pacific. The company was founded in 1942 and is headquartered in Philadelphia, PA.
Predefined Scans Triggered: Hollow Red Candles, P&F Low Pole and Entered Ichimoku Cloud.
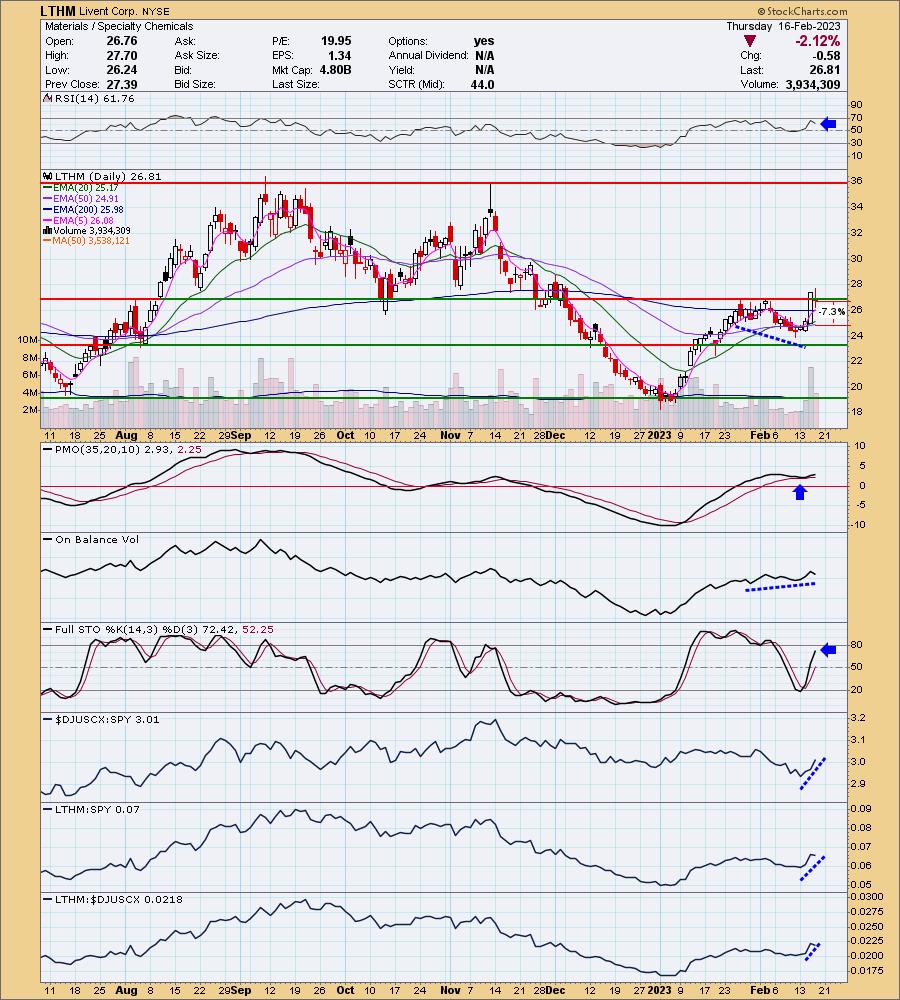
LTHM is down -0.04% in after hours trading. The RSI is positive and not overbought. The PMO bottomed on a whipsaw BUY signal and is rising and not overbought. We have a cup with handle pattern that executed with yesterday's breakout. Today price pulled back toward the breakout point somewhat harmlessly. While it closed below resistance, it formed a bullish hollow red candlestick. There is a positive OBV divergence going into this rally and Stochastics are rising strongly. Relative strength is improving for the group and LTHM in the very short term. The stop is set below the 20/50-day EMAs around 7.3% or $24.85.
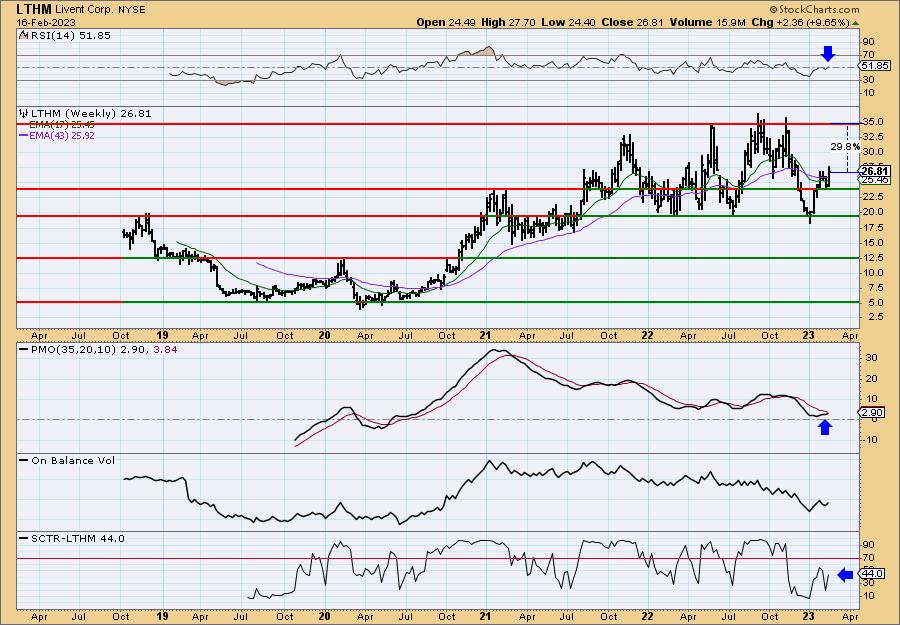
The weekly chart is firming up nicely. The weekly RSI just hit positive territory and the weekly PMO is about to trigger a crossover BUY signal. The SCTR is not in the "hot zone", but it has reversed and is headed up. Upside potential is almost 30%.
Marathon Petroleum Corp. (MPC)
EARNINGS: 05/02/2023 (BMO)
Marathon Petroleum Corp. is an independent company, which engages in the refining, marketing, and transportation of petroleum products in the United States. It operates through the following segments: Refining and Marketing, and Midstream. The Refining and Marketing segment refines crude oil and other feedstocks at its refineries in the Gulf Coast and Midwest regions of the United States, purchases ethanol and refined products for resale and distributes refined products through various means, including barges, terminals, and trucks that the company owns or operates. The Midstream segment transports, stores, distributes and markets crude oil and refined products principally for the Refining and Marketing segment via refining logistics assets, pipelines, terminals, towboats, and barges. It also gathers, processes, and transports natural gas, and gathers, transports, fractionates, stores, and markets NGLs. The company was founded in 1887 and is headquartered in Findlay, OH.
Predefined Scans Triggered: P&F Low Pole.
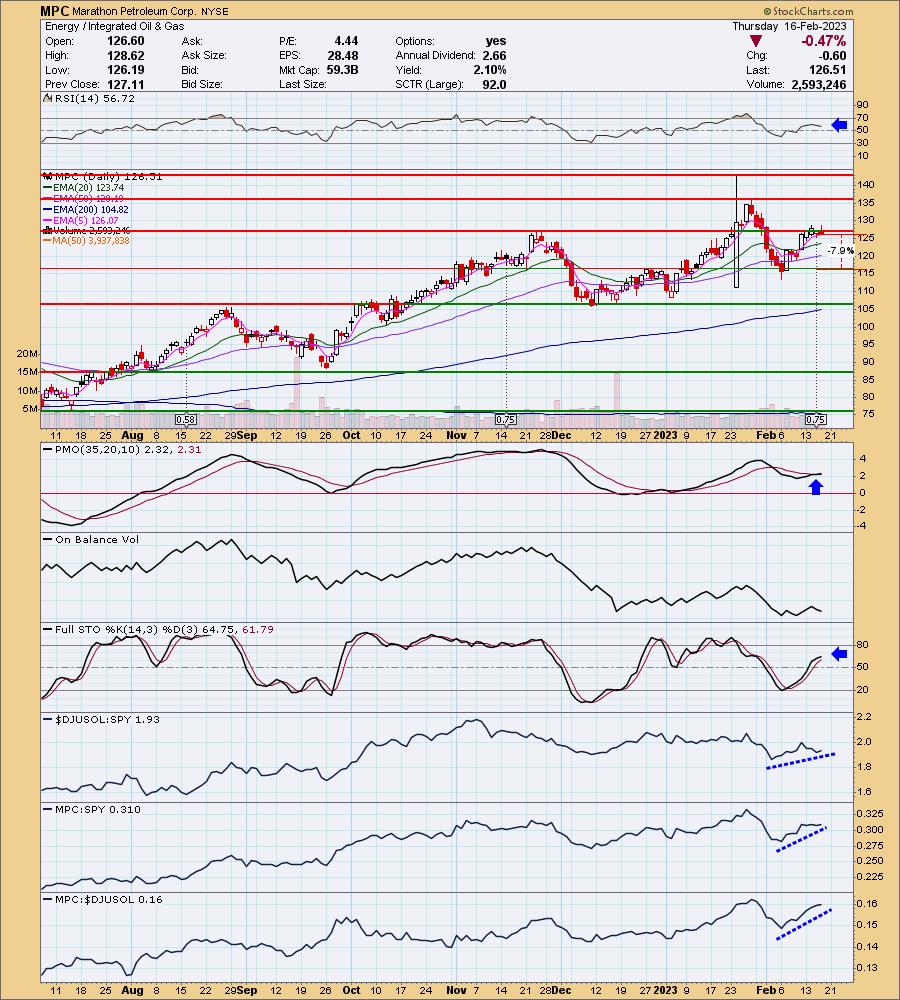
MPC is down -0.13% in after hours trading. Price broke out two days ago, but has since dropped just below prior resistance. The indicators tell me that a breakout is imminent. The PMO just triggered a crossover BUY signal and the RSI is firmly positive. Stochastics are positive and rising toward 80. Relative strength in the very short term has been negative for the group, but overall it is still outperforming. MPC is a strong performer against its industry group, so if the group turns it around, this one will benefit more so than others within the group. The stop is set at around 7.9% around $116.51 near support at the February low.
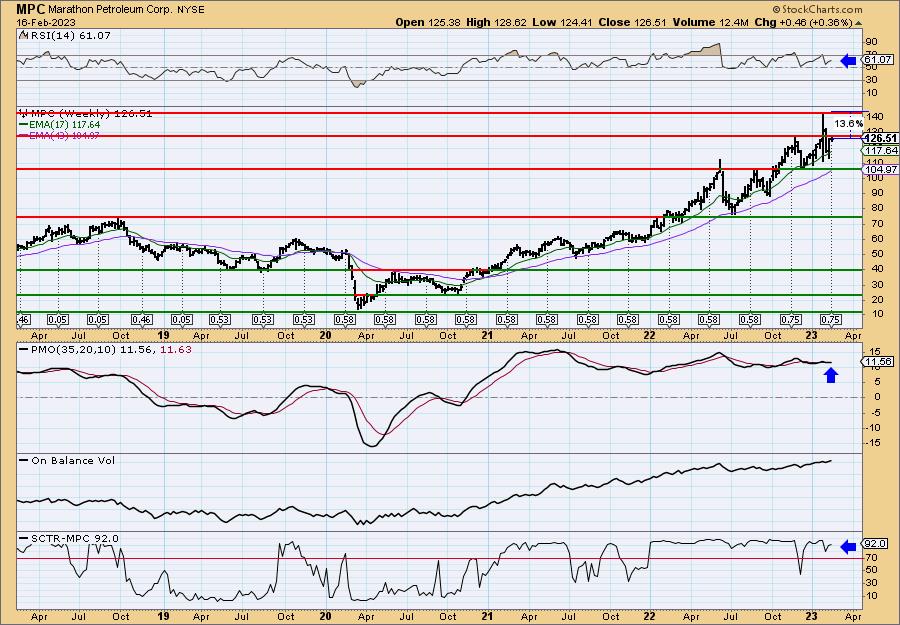
The weekly chart shows a very flat weekly PMO. This is due to the steady rising trend price has been in since mid-2022. I wouldn't worry too much about that for that reason. The OBV is rising in confirmation of the rising trend. The SCTR is excellent at 92% suggesting it could be considered a longer-term investment.
Palomar Holdings, Inc. (PLMR)
EARNINGS: 02/15/2023 (AMC) ** REPORTED TODAY **
Palomar Holdings, Inc. operates as an insurance holding company. The firm focuses on the residential and commercial earthquake markets in earthquake-exposed states such as California, Oregon, Washington and states with exposure to the New Madrid Seismic Zone. It offers property and casualty insurance. The company was founded by Armstrong Mac & Fisher Heath on October 4, 2013 and is headquartered in La Jolla, CA.
Predefined Scans Triggered: New CCI Buy Signals, Parabolic SAR Buy Signals, P&F Double Top Breakout and P&F Triple Top Breakout.
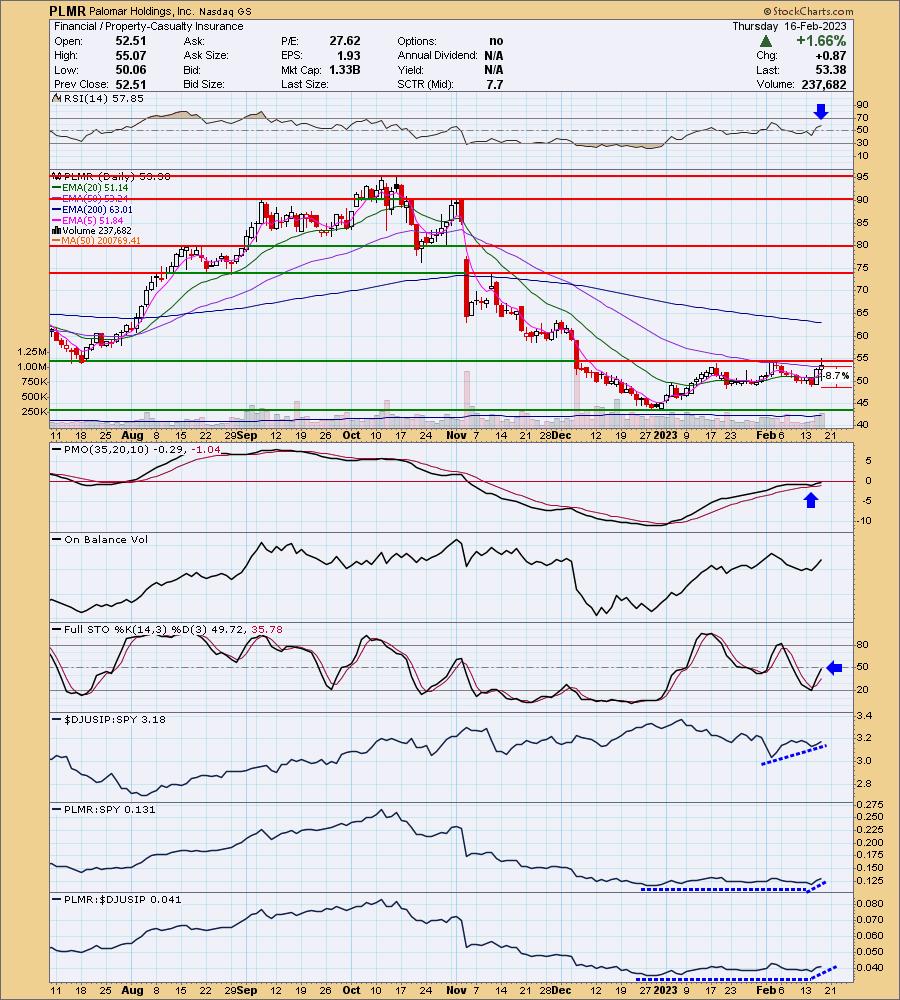
PLMR is down -1.44% in after hours trading. They just reported after the bell today so I'd avoid any overnight orders. It's been stuck beneath resistance at the July 2022 low, but today it did manage to trade just above it. It did finish back below resistance. I would look for a breakout given the positive RSI and very bullish PMO bottom above the signal line. Stochastics are rising, but aren't quite in positive territory yet. Relative strength studies are favorable and improving. The stop is set deeply, but I felt it necessary to protect against a drop below support. I set it at 8.7% around $58.02.
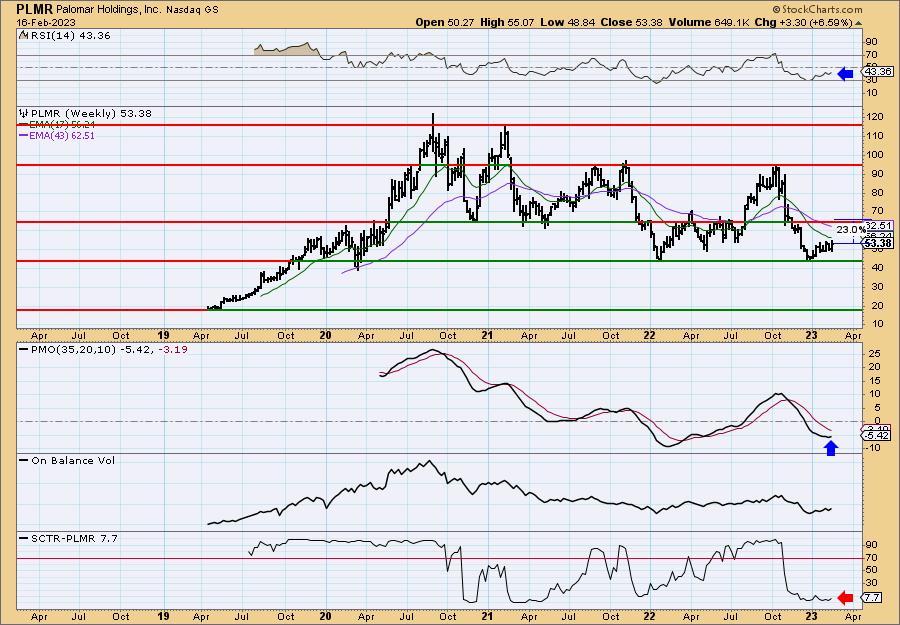
The weekly RSI is in negative territory but it is rising and now the weekly PMO is rising as well. It took a beating last quarter which explains its terrible SCTR percentage right now. I like the rising trend and particularly the bounce of strong support. If it can reach overhead resistance, it should give us an over 22% gain.
Don't forget, on Thursdays I look at reader-requested symbols, click HERE to send me an email. I read every email I receive and try to answer them all!
Current Market Outlook:
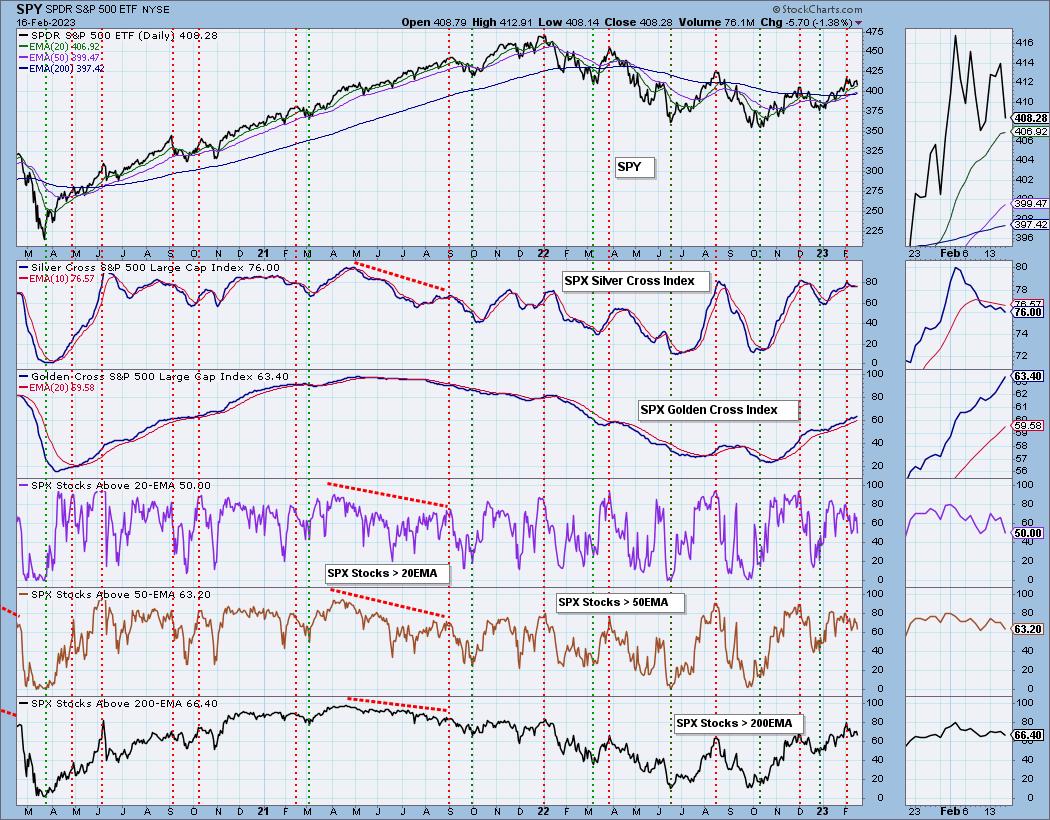
Market Environment: It is important to consider the odds for success by assessing the market tides. The following chart uses different methodologies for objectively showing the depth and trend of participation for intermediate- and long-term time frames.
- The Silver Cross Index (SCI) shows the percentage of SPX stocks on IT Trend Model BUY signals (20-EMA > 50-EMA)
- The Golden Cross Index (GCI) shows the percentage of SPX stocks on LT Trend Model BUY signals (50-EMA > 200-EMA)
Don't forget that as a "Diamonds" member, you have access to our GCI/SCI curated ChartList on DecisionPoint.com. You'll find it under "Members Only" links on the left side on the Blogs and Links Page.
Here is the current chart:
Full Disclosure: I am 20% exposed. All of these are on my radar.
I'm required to disclose if I currently own a stock I mention and/or may buy/short it within the next 72 hours.
"Technical Analysis is a windsock, not a crystal ball." - Carl Swenlin
(c) Copyright 2023 DecisionPoint.com
Watch the latest episode of DecisionPoint Trading Room with Carl & Erin Swenlin on Mondays 7:00p EST or on the DecisionPoint playlist on the StockCharts TV YouTube channel here!
NOTE: The stocks reported herein are from mechanical trading model scans that are based upon moving average relationships, momentum and volume. DecisionPoint analysis is then applied to get five selections from the scans. The selections given should prompt readers to do a chart review using their own analysis process. This letter is not a call for a specific action to buy, sell or short any of the stocks provided. There are NO sure things or guaranteed returns on the daily selection of "Diamonds in the Rough."
Regarding BUY/SELL Signals: The signal status reported herein is based upon mechanical trading model signals and crossovers. They define the implied bias of the price index/stock based upon moving average relationships and momentum, but they do not necessarily call for a specific action. They are information flags that should prompt chart review. Further, they do not call for continuous buying or selling during the life of the signal. For example, a BUY signal will probably (but not necessarily) return the best results if action is taken soon after the signal is generated. Additional opportunities for buying may be found as price zigzags higher, but the trader must look for optimum entry points. Conversely, exit points to preserve gains (or minimize losses) may be evident before the model mechanically closes the signal.
Helpful DecisionPoint Links:
DecisionPoint Shared ChartList and DecisionPoint Chart Gallery
Price Momentum Oscillator (PMO)
Swenlin Trading Oscillators (STO-B and STO-V)
For more links, go to DecisionPoint.com