
Today I look at three stocks that were requested by readers. Feel free to send yours in during the week and yours might be included!
There are two concepts I'm going to cover as I discuss today's "Diamonds in the Rough". One is rising prices with a falling PMO. Two is broadening patterns.
No mailbag questions to answer again this week. Feel free to send them in during the week.
We finally saw the pop that I had expected after the VIX punctured its lower Bollinger Band on our inverted scale. However, I don't think this rally will have staying power. Be careful expanding your exposure.
Tomorrow is the Diamond Mine trading room! Be sure to sign up using the registration link below. If you can't attend but have some symbols you'd like reviewed, please send them in tonight with the subject listed "For Diamond Mine" so they don't get lost in the other myriad of emails.
Good Luck & Good Trading,
Erin
Today's "Diamonds in the Rough": ACGL, ENVX and OSUR.
Other requests: TPH, PR, AMBC, PBH, PPLT, CAG, HALO, AMCX, SRPT, AGCO, SGML, BUD and CPB.

RECORDING LINK (2/17/2023):
Topic: DecisionPoint Diamond Mine (2/17/2023) LIVE Trading Room
Recording Link HERE
Passcode: Feb$17th
REGISTRATION for 2/24/2023:
When: Feb 24, 2023 09:00 AM Pacific Time (US and Canada)
Topic: DecisionPoint Diamond Mine (2/24/2023) LIVE Trading Room
Register in advance for this webinar HERE
After registering, you will receive a confirmation email containing information about joining the webinar.

Here is the last recording (2/13 - No recording on 2/20):
Welcome to DecisionPoint Diamonds, wherein I highlight ten "Diamonds in the Rough" per week. These are selected from the results of my DecisionPoint Scans which search for stocks that could benefit from the trend and condition of the market. Remember, these are not recommendations to buy or sell, but are the most interesting of the stocks that surfaced in my scans. My objective is to save you the work of the initial, tedious culling process, but you need to apply your own analysis to see if these stocks pique your interest as well. There are no guaranteed winners here!
"Predefined Scans Triggered" are taken from StockCharts.com using the "Symbol Summary" option instead of a "SharpChart" on the workbench.
Stop levels are all rounded down.
Arch Capt. Grp. Ltd. (ACGL)
EARNINGS: 04/26/2023 (AMC)
Arch Capital Group Ltd. engages in the provision of property and casualty insurance and reinsurance lines. It operates through the following segments: Insurance, Reinsurance, Mortgage, Corporate, and Other. The Insurance segment consists of insurance underwriting units which offer specialty product lines like construction and national accounts, excess and surplus casualty, lenders products, professional lines, and programs. The Reinsurance segment is composed of reinsurance underwriting which offers specialty product lines such as casualty, marine and aviation, other specialty, property catastrophe, property excluding property catastrophe, and other. The Mortgage segment includes U.S. and international mortgage insurance and reinsurance operations as well as GSE credit risk sharing transactions. The Corporate segment represents net investment income, other income, corporate expense, interest expense, net realized gains and losses, and net impairment losses. The Other segment refers to Watford Re. which is a variable interest entity. The company was founded by Clements Robert in March 1995 and is headquartered in Hamilton, Bermuda.
Predefined Scans Triggered: New 52-week Highs, Stocks in a New Uptrend (Aroon), Moved Above Upper Price Channel, P&F Ascending Triple Top Breakout.
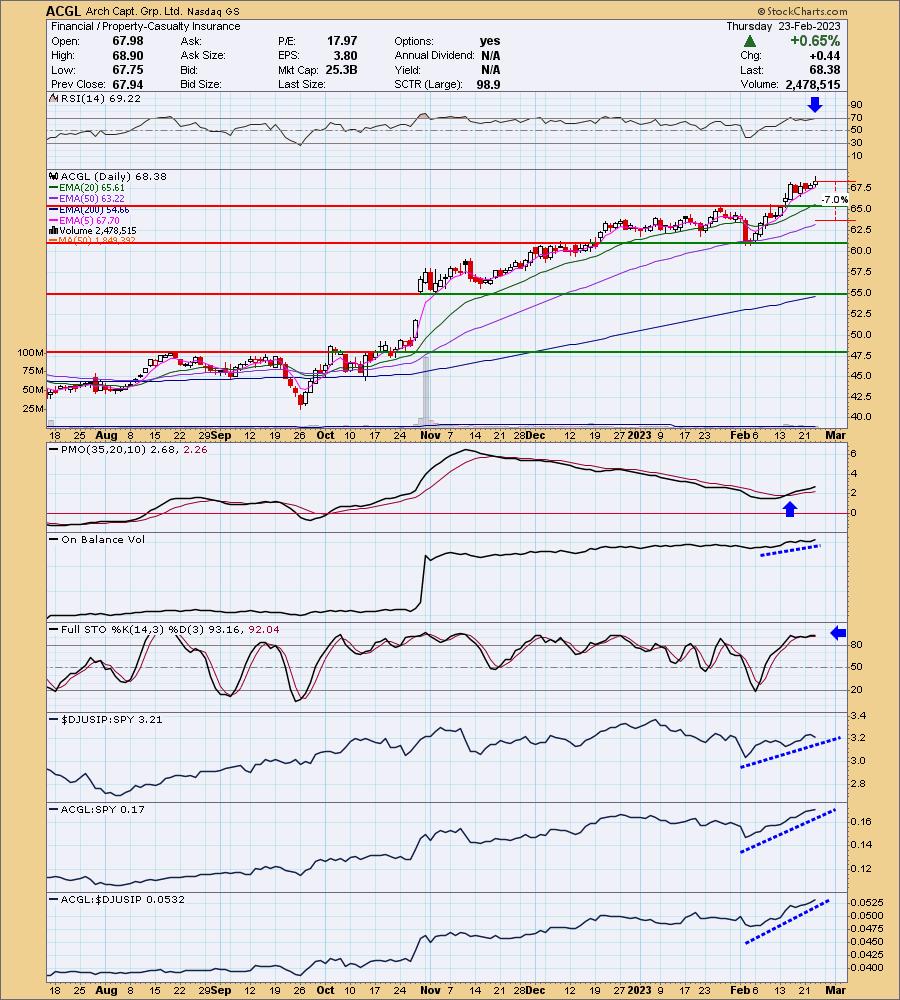
ACGL is unchanged in after hours trading. This is to be filed under a "winner that keeps on winning". Since September this stock has been quietly moving higher and higher. This has put the RSI near the top of its range, but it is still not overbought. The PMO is rising on a crossover BUY signal and is not overbought which is great given it is a winner that keeps on winning. Stochastics are steady above 90 not just 80. I've set the stop at the 50-day EMA around $63.59.
Concept 1: The PMO declined through November to January, but price continued higher? This is because the rising trend was steady and not really choppy. So, a declining PMO isn't always a bad thing. Scrutinizing price will help you determine if a falling PMO is okay. The biggest problem is that stocks like this don't always hit my scans.
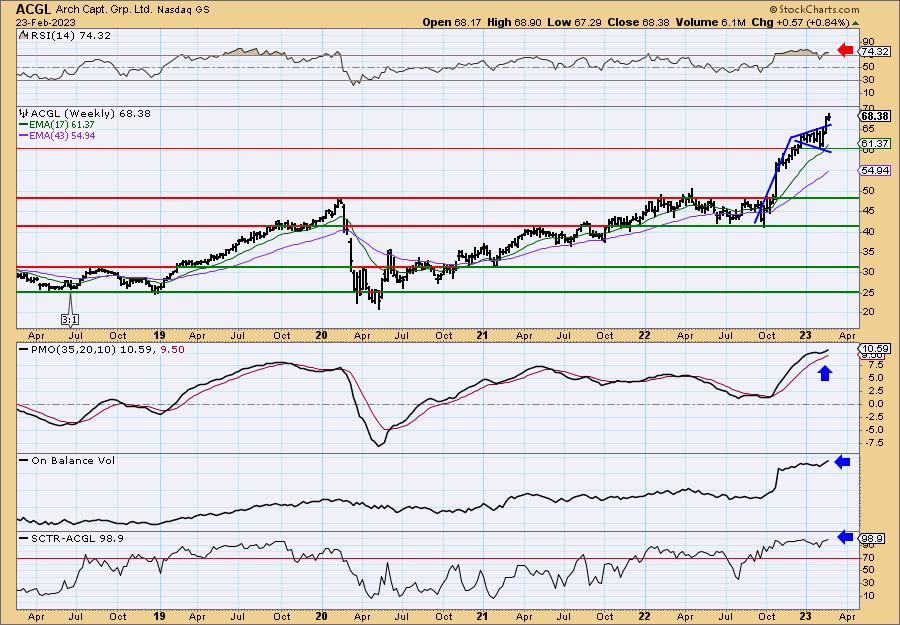
Concept 2: We have a flag on the weekly chart. The flag itself is a broadening pattern. These are actually bearish patterns as they describe volatility in price. Volatility is rarely our friend so we look for breakdowns.
However, this flag didn't break down, it broke out which makes the formation particularly bullish in my mind. The weekly RSI is overbought, but note it can stay that way for weeks. The weekly PMO is also overbought, but it seems to be extending its range for now. The OBV is confirming this breakout with a breakout of its own. The SCTR is well within the "hot zone" above 70*. Since it is making new all-time highs, consider an upside target of 15% around $78.64.
*We call it the "hot zone" because it implies that the stock/ETF is in the top 30% of its "universe" (large-, mid-, small-caps and ETFs) as far as trend and condition, particularly in the intermediate and long terms.
Enovix Corporation (ENVX)
EARNINGS: 02/22/2023 (AMC) ** Reported Yesterday **
Enovix Corp. engages in the design and development of silicon-anode lithium-ion batteries. The firm's proprietary 3D cell architecture increases energy density and maintains a high cycle life. It is also developing its 3D cell technology and production process for the electric vehicle and energy storage markets to help enable utilization of renewable energy. The company was founded by Mr. Harrold Jones Rust, III, Ashok Lahiri, and Murali Ramasubramanian in November 2006 and is headquartered in Fremont, CA.
Predefined Scans Triggered: Elder Bar Turned Green, New CCI buy Signals, Gap Ups, Stocks in a New Uptrend (Aroon), Filled black Candles, Parabolic SAR Buy Signals, P&F Low Pole and Entered Ichimoku Cloud.
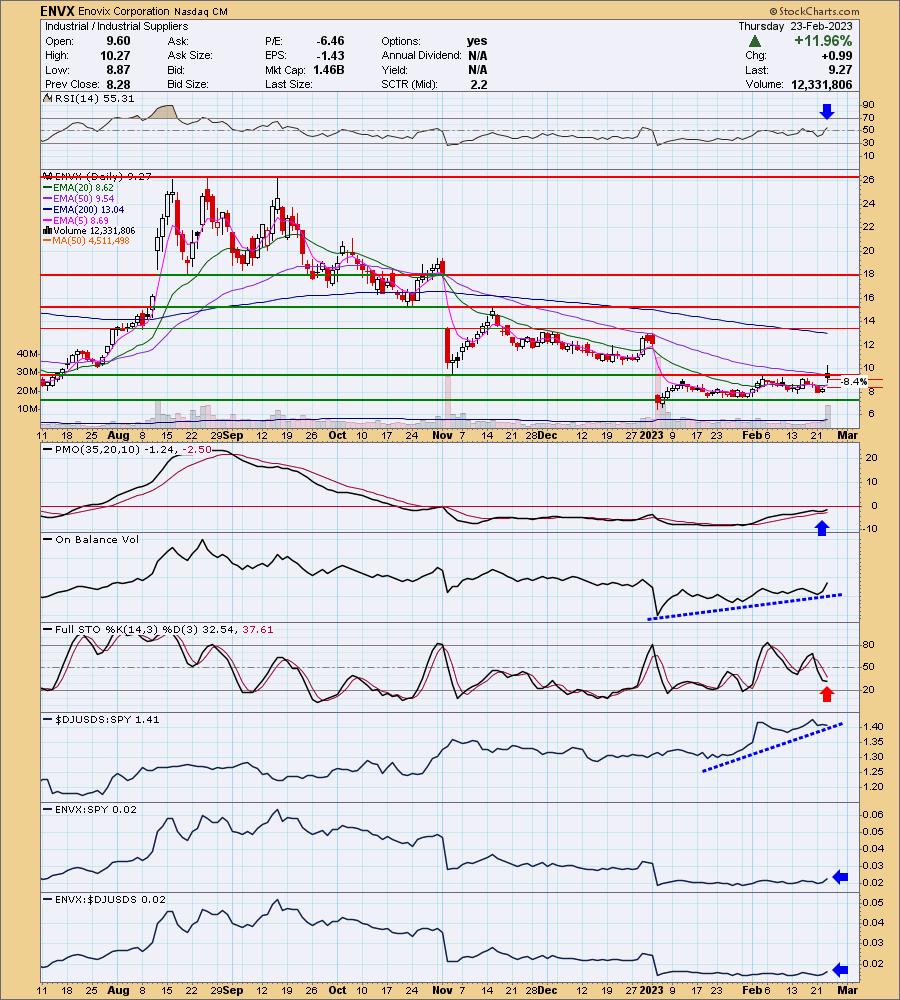
ENVX is up +0.22% in after hours trading. Today saw a breakout from a two month long trading range after a gap down. The unfortunate part is that it did close back within the trading range. Today's action was on earnings and with a nearly 12% gain today, I'd say investors were happy with what they saw. The technicals are very good. The RSI is now in positive territory and the PMO has formed a bottom above its signal line which is especially bullish. Relative strength for the group is strong, this stock has been a bit of a laggard in the relative performance arena. However, it is beginning to outperform on today's big gain. The stop was a bit tricky given the gain today. I opted to set it just below the gap around 8.4% or $8.49. If the gap is closed, follow-through to the downside should be expected.
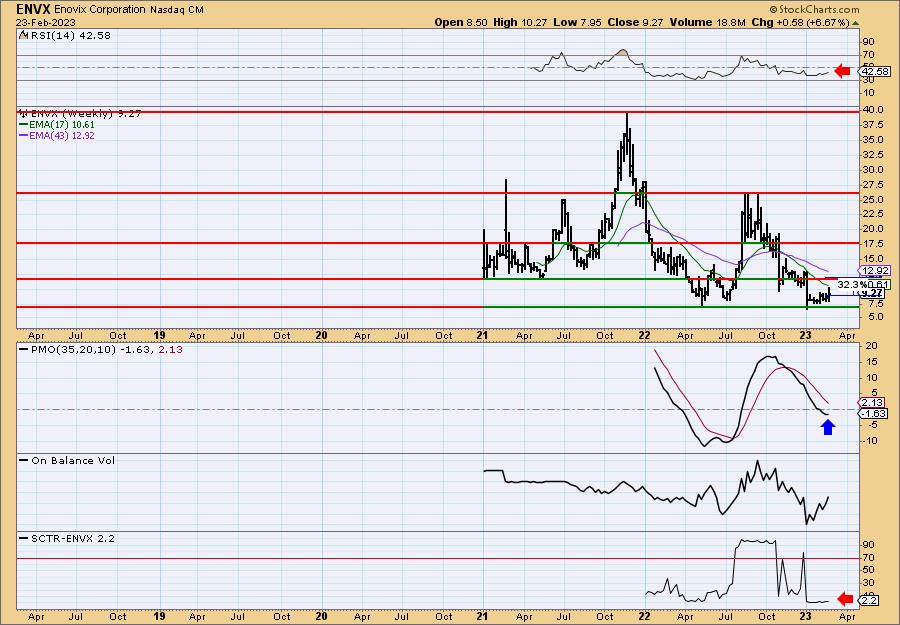
The weekly chart needs a lot of work so consider this one a short-term prospect, not a longer-term hold. The weekly RSI is negative and the weekly PMO is on a SELL signal. The SCTR is in the basement. On the positive side, the PMO is decelerating and could turn up shortly. I also like that price has bounced off all-time lows. Upside potential is over 32%.
OraSure Technologies, Inc. (OSUR)
EARNINGS: 05/09/2023 (AMC)
OraSure Technologies, Inc. engages in the development, manufacture, and distribution of point of care diagnostic tests and molecular collection devices designed to detect or diagnose critical medical conditions. It operates through the OSUR and DNAG segments. The OSUR segment offer oral fluid diagnostic products and specimen collection devices. The DNAG segment produces specimen collection kits that are used to collect, stabilize, transport, and store samples of genetic material for molecular testing in the consumer genetic, clinical genetic, academic research, pharmacogenomics, personalized medicine, microbiome, and animal genetics markets. The company was founded by Michael J. Gausling in May 2000 in and is headquartered in Bethlehem, PA.
Predefined Scans Triggered: Moved Above Upper Keltner Channel, Moved Above Upper Bollinger Band and P&F Double Top Breakout.
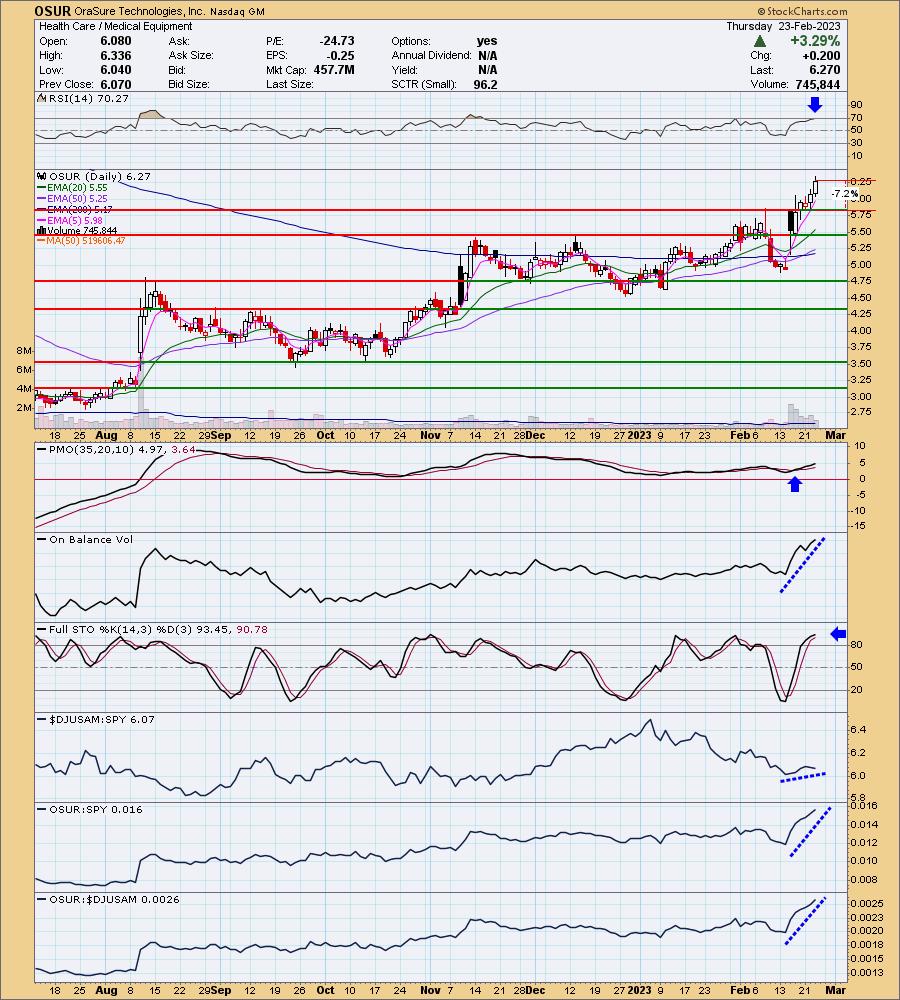
OSUR is up +3.83% in after hours trading. This is another one to file under 'winners keep on winning'. The RSI did just reach above 70, but we've seen it move much higher. Still, we should be careful given this stock's response to overbought conditions. The PMO is on a BUY signal and is not overbought. The OBV shows big time volume coming in on this one, so traders are interested. Stochastics are above 80. Relative strength is improving for the group and particularly for OSUR. I've set the stop below the early February intraday high at 7.2% around $5.81.
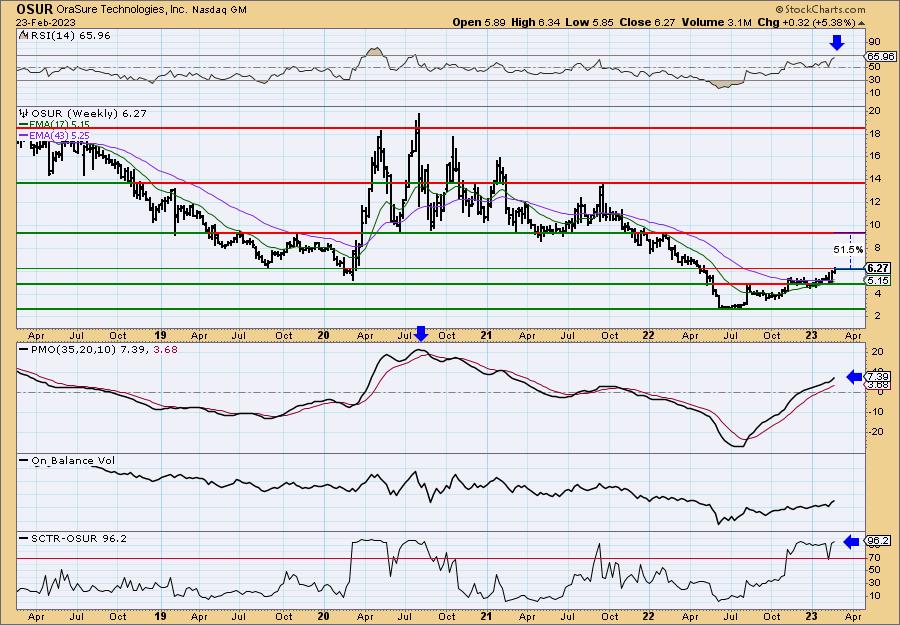
The weekly chart is very enticing given the tiny breakout above overhead resistance. The PMO is accelerating higher and isn't overbought. The weekly RSI is positive and the SCTR is a spectacular 96.2%. I love the upside potential on this one at over 51%. I might add a small position on this one.
Don't forget, on Thursdays I look at reader-requested symbols, click HERE to send me an email. I read every email I receive and try to answer them all!
Current Market Outlook:
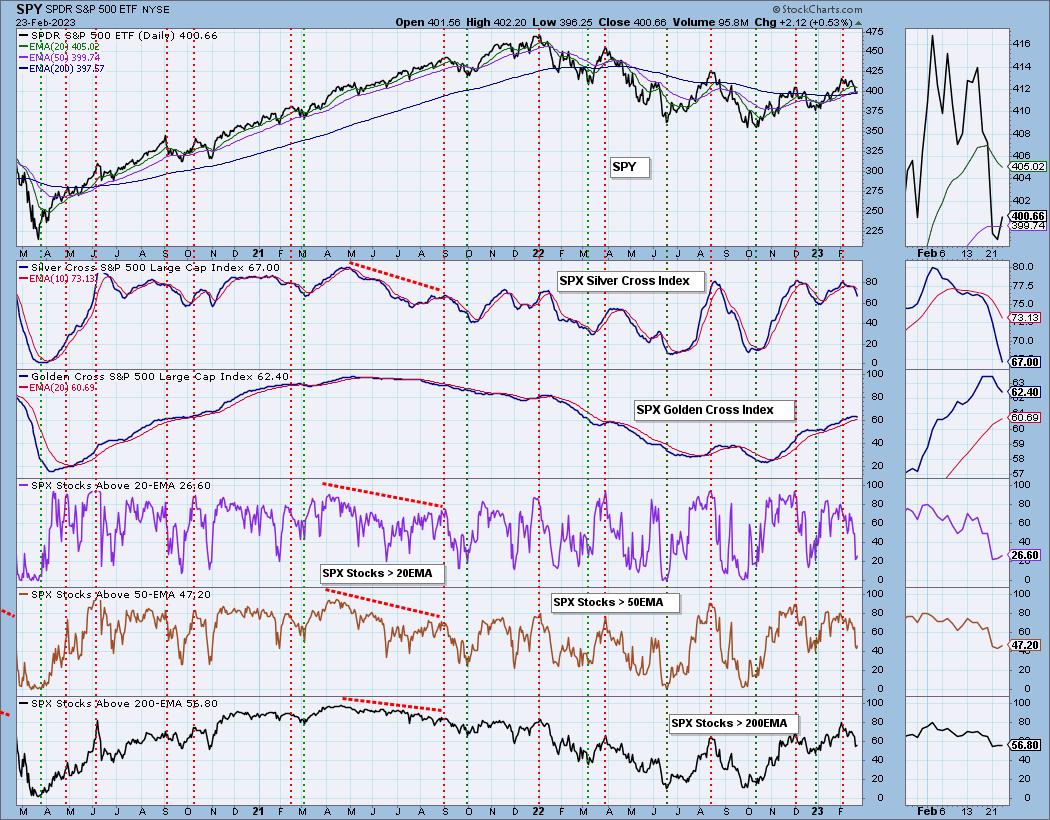
Market Environment: It is important to consider the odds for success by assessing the market tides. The following chart uses different methodologies for objectively showing the depth and trend of participation for intermediate- and long-term time frames.
- The Silver Cross Index (SCI) shows the percentage of SPX stocks on IT Trend Model BUY signals (20-EMA > 50-EMA)
- The Golden Cross Index (GCI) shows the percentage of SPX stocks on LT Trend Model BUY signals (50-EMA > 200-EMA)
Don't forget that as a "Diamonds" member, you have access to our GCI/SCI curated ChartList on DecisionPoint.com. You'll find it under "Members Only" links on the left side on the Blogs and Links Page.
Here is the current chart:
Full Disclosure: I am 22% exposed. I am interested in OSUR.
I'm required to disclose if I currently own a stock I mention and/or may buy/short it within the next 72 hours.
"Technical Analysis is a windsock, not a crystal ball." - Carl Swenlin
(c) Copyright 2023 DecisionPoint.com
Watch the latest episode of DecisionPoint Trading Room with Carl & Erin Swenlin on Mondays 7:00p EST or on the DecisionPoint playlist on the StockCharts TV YouTube channel here!
NOTE: The stocks reported herein are from mechanical trading model scans that are based upon moving average relationships, momentum and volume. DecisionPoint analysis is then applied to get five selections from the scans. The selections given should prompt readers to do a chart review using their own analysis process. This letter is not a call for a specific action to buy, sell or short any of the stocks provided. There are NO sure things or guaranteed returns on the daily selection of "Diamonds in the Rough."
Regarding BUY/SELL Signals: The signal status reported herein is based upon mechanical trading model signals and crossovers. They define the implied bias of the price index/stock based upon moving average relationships and momentum, but they do not necessarily call for a specific action. They are information flags that should prompt chart review. Further, they do not call for continuous buying or selling during the life of the signal. For example, a BUY signal will probably (but not necessarily) return the best results if action is taken soon after the signal is generated. Additional opportunities for buying may be found as price zigzags higher, but the trader must look for optimum entry points. Conversely, exit points to preserve gains (or minimize losses) may be evident before the model mechanically closes the signal.
Helpful DecisionPoint Links:
DecisionPoint Shared ChartList and DecisionPoint Chart Gallery
Price Momentum Oscillator (PMO)
Swenlin Trading Oscillators (STO-B and STO-V)
For more links, go to DecisionPoint.com