
I wasn't surprised to see Energy stocks in my scan results given the rally in Crude Oil. Additionally, Energy had the best day of all of the sectors. I found an interesting one with lots of upside potential; however, you will find more in the "Stocks to Review".
Another two areas that were prevalent in today's scans were Materials and Financials. I believe the Financial stocks are still high risk given the downside pressure on the group provided by Banks. Industrials also made an appearance. I opted to present one of the Materials stocks.
The last stock is from the beleaguered Healthcare Sector (XLV). I noticed yesterday that the sector is in a rising trend after seeing lower prices since January. I have a Pharma company that has plenty of promise.
Good Luck & Good Trading,
Erin
Today's "Diamonds in the Rough": BLCO, SLCA and YPF.
Stocks to Review: MLCO, PNR, LYB, AGCO, MSM, MT, PSX, MYE and RCI.

RECORDING LINK (3/24/2023):
Topic: DecisionPoint Diamond Mine (3/24/2023) LIVE Trading Room
Recording Link
Passcode: March#24
REGISTRATION for 4/3/2023:
When: Apr 3, 2023 09:00 AM Pacific Time (US and Canada)
Topic: DecisionPoint Diamond Mine (4/3/2023) LIVE Trading Room
Register in advance for this webinar HERE
After registering, you will receive a confirmation email containing information about joining the webinar.

Here is the last recording (3/27):
Welcome to DecisionPoint Diamonds, wherein I highlight ten "Diamonds in the Rough" per week. These are selected from the results of my DecisionPoint Scans which search for stocks that could benefit from the trend and condition of the market. Remember, these are not recommendations to buy or sell, but are the most interesting of the stocks that surfaced in my scans. My objective is to save you the work of the initial, tedious culling process, but you need to apply your own analysis to see if these stocks pique your interest as well. There are no guaranteed winners here!
"Predefined Scans Triggered" are taken from StockCharts.com using the "Symbol Summary" option instead of a "SharpChart" on the workbench.
Stop levels are all rounded down.
Bausch & Lomb Corp. (BLCO)
EARNINGS: 05/04/2023 (BMO)
Bausch + Lomb Corp. develops, manufactures, and markets eye health products. It offers over-the-counter supplements, eye care products, ophthalmic pharmaceuticals, contact lenses, lens care, ophthalmic surgical devices, and instruments. The company operates its business through three segments: Vision Care/Consumer Health Care, Ophthalmic Pharmaceuticals and Surgical. The Vision Care/Consumer Health Care segment includes both contact lens and consumer eye care businesses. The Ophthalmic Pharmaceuticals segment consists of a broad line of proprietary pharmaceutical products for post-operative treatments and treatments for a number of eye conditions, such as glaucoma, eye inflammation, ocular hypertension, dry eyes and retinal diseases. The Surgical segment consists of medical device equipment, consumables and instrumental tools and technologies for the treatment of corneal, cataracts, and vitreous and retinal eye conditions, and includes IOLs and delivery systems, phacoemulsification equipment and other surgical instruments and devices necessary for cataract surgery. Bausch + Lomb was founded by John Jacob Bausch and Henry Lomb in 1853 and is headquartered in Vaughan, Canada.
Predefined Scans Triggered: Bullish MACD Crossovers, P&F High Pole and Entered Ichimoku Cloud.
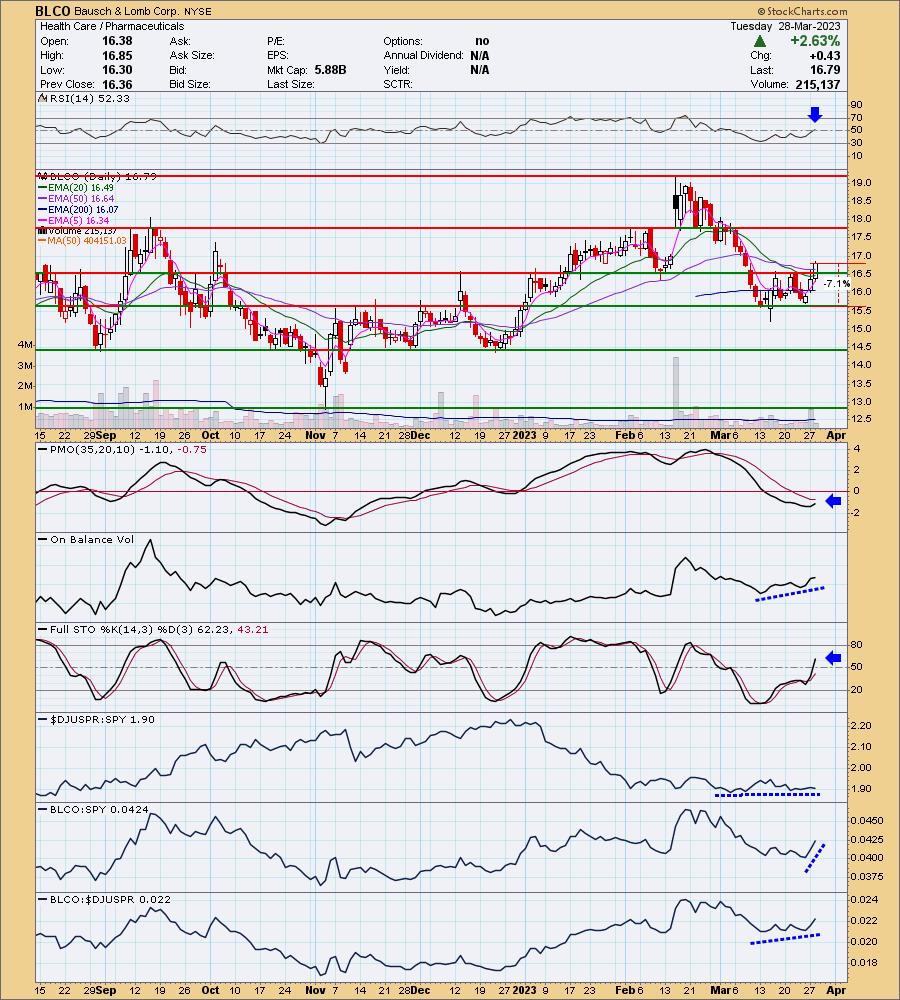
BLCO is up +1.25% in after hours trading. This was the first one I chose today and it was an instantaneous pick as soon as I saw the chart. Price broke out of a messy bullish triple-bottom. That breakout took price over the confirmation line and the 20/50-day EMAs today. The RSI is positive and the PMO is just turning up in oversold territory. The OBV is confirming the rising trend and Stochastics are rising vertically in positive territory above net neutral (50). Relative strength for Pharma isn't great, but it is traveling in inline with the market and so far our indicators are telling us the market should continue higher. BLCO is showing leadership within the group and it is outperforming the SPY. The stop is set below the chart pattern at 7.1% or $15.59.
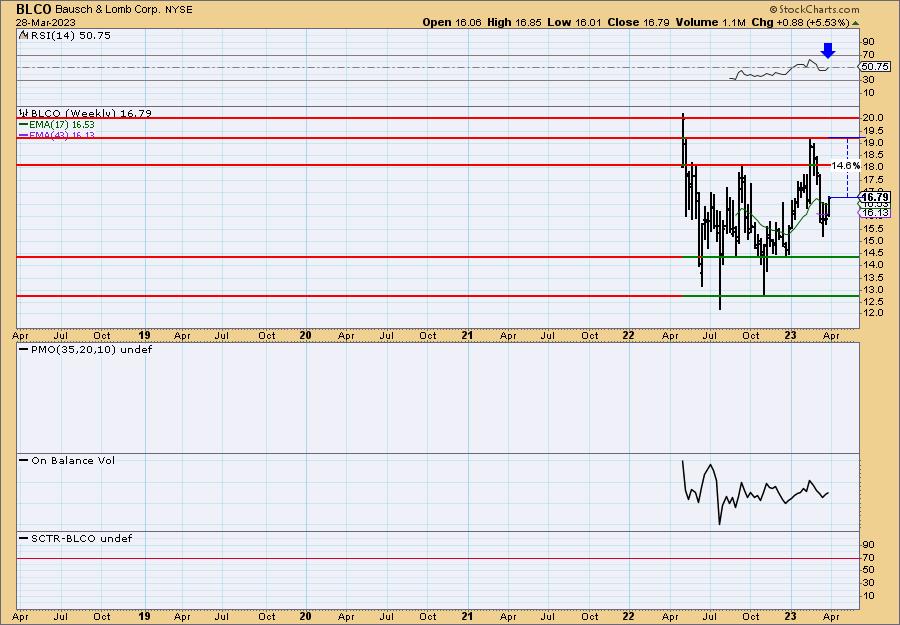
The weekly chart doesn't have enough data to show the weekly PMO, but we do see rising bottoms on the OBV and the weekly RSI just moved into positive territory. I've set upside potential at 14.6% which is double our stop level.
US Silica Holdings, Inc. (SLCA)
EARNINGS: 04/28/2023 (BMO)
U.S. Silica Holdings, Inc. engages in the provision of commercial silica products. It operates through the following segments: Oil and Gas Proppants, and Industrial and Specialty Products. The Oil and Gas Proppants segment focuses on delivering fracturing sand, which is pumped down oil and natural gas wells to prop open rock fissures and increase the flow rate of natural gas and oil from the wells. The Industrial and Specialty products segment consists of products and materials used in various industries, including container glass, fiberglass, specialty glass, flat glass, building products, fillers and extenders, foundry products, chemicals, recreation products and filtration products. The company was founded on November 14, 2008 and is headquartered in Katy, TX.
Predefined Scans Triggered: Bullish MACD Crossovers and Entered Ichimoku Cloud.
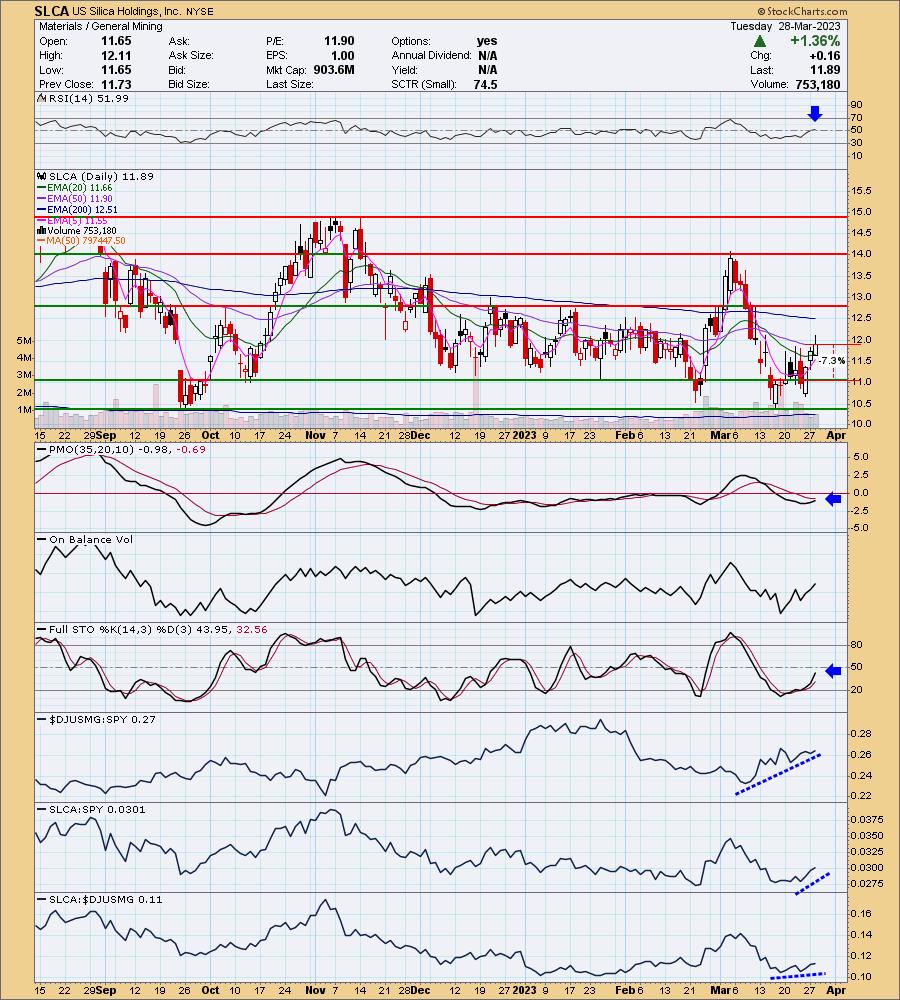
SLCA is unchanged in after hours trading. I generally pass on trading range charts, but you'll see that there is tons of upside potential on the weekly chart. Price confirmed a bullish double-bottom of the March high. The RSI is now positive and the PMO is turning up. Stochastics are still below net neutral (50), but they are rising strongly and should hit that territory on the next rally. Relative strength is increasing for the group and SLCA is beginning to outperform the group and consequently the SPY. I've set the stop below strong support at 7.3% or $11.02.
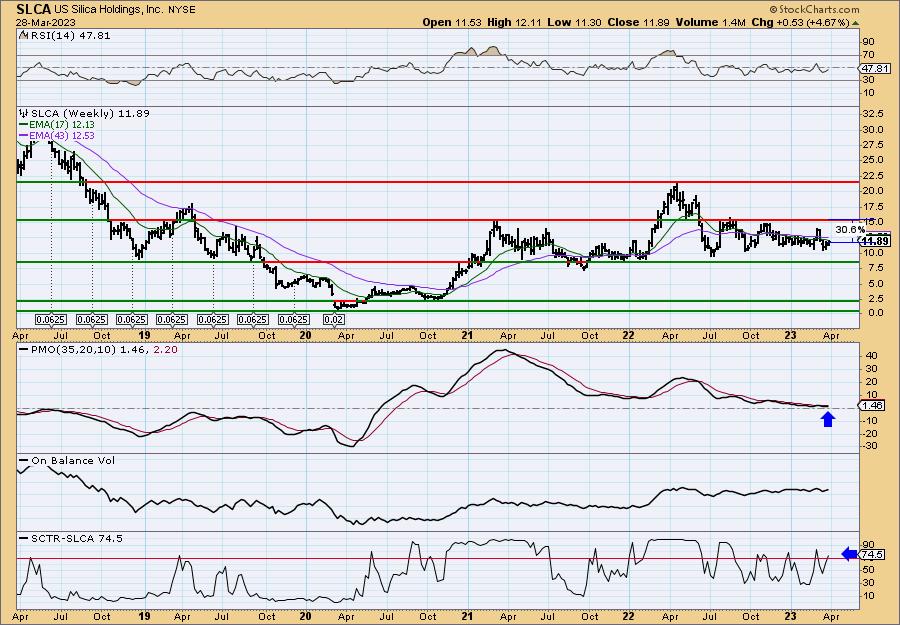
SLCA has plenty of upside potential should it reach the top of the trading range. The weekly indicators are not great as the weekly RSI, while rising, is in negative territory. The weekly PMO is flat due to the trading range, but it does hold a crossover SELL currently. We do see that the SCTR is now in the "hot zone*" above 70.
*We call it the "hot zone" because it implies that the stock/ETF is in the top 30% of its "universe" (large-, mid-, small-caps and ETFs) as far as trend and condition, particularly in the intermediate and long terms.
YPF Sociedad Anonima (YPF)
EARNINGS: 05/11/2023
YPF SA engages in the exploration, production, and distribution of oil and gas. It operates through the following segments: Upstream, Gas and Power, Downstream, Central Administration and Other. The Upstream segment sells petroleum and natural gas. The Gas and Power segment markets natural gas to third parties and downstream segment; and manages commercial and technical LNG Regasification Terminals in Bahia Blanca and Escobar. The Downstream segment produces petroleum refining and petrochemicals. The Central Administration and Other segment covers corporate administrative expenses and assets, construction activities, and the environmental remediation. The company was founded on June 2, 1977 and is headquartered in Buenos Aires, Argentina.
Predefined Scans Triggered: Bullish MACD Crossovers and Parabolic SAR Buy Signals.
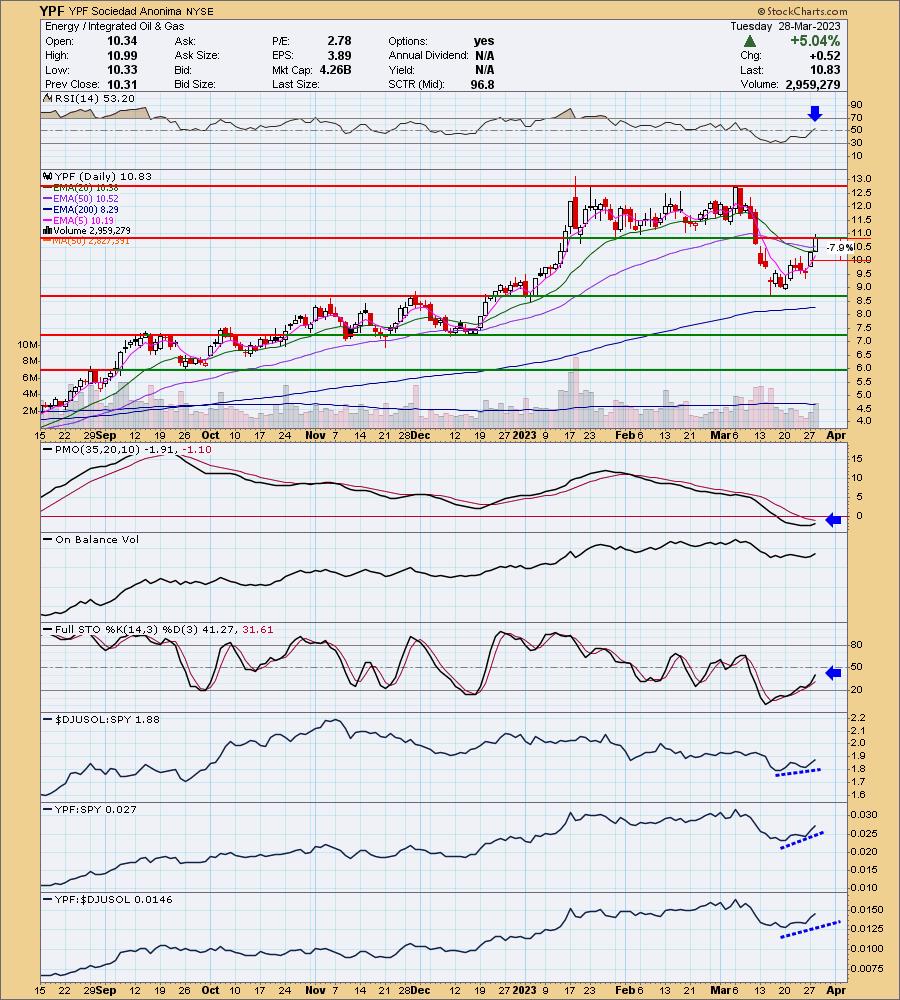
YPF is up +0.83% in after hours trading. The one concern I have is that we could see price pullback now that it has hit strong overhead resistance. However, after a probable pullback, the indicators suggest a breakout will occur. The RSI just moved into positive territory and the PMO is turning up in oversold territory. Stochastics are still in negative territory, but have a nice rising trend. Relative strength studies are positive with the group outperforming and YPF showing leadership within the group. The stop is set somewhat deeply because of today's 5%+ rally. It will be thinner should YPF pullback here.
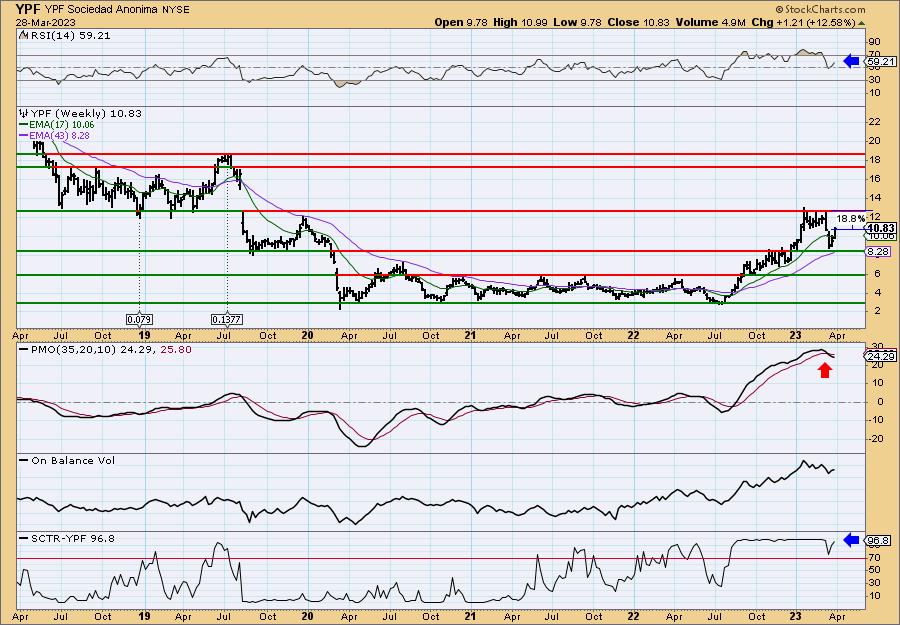
The weekly chart is mixed. The weekly RSI remains in positive territory and the SCTR is top-notch at 96.8%. However, the weekly PMO does not inspire confidence, so consider this a short-term trade. I would guess that when Crude Oil hits overhead resistance at the top of its trading range, Oil related stocks will turn back down.
Don't forget, on Thursdays I look at reader-requested symbols, click HERE to send me an email. I read every email I receive and try to answer them all!
Current Market Outlook:
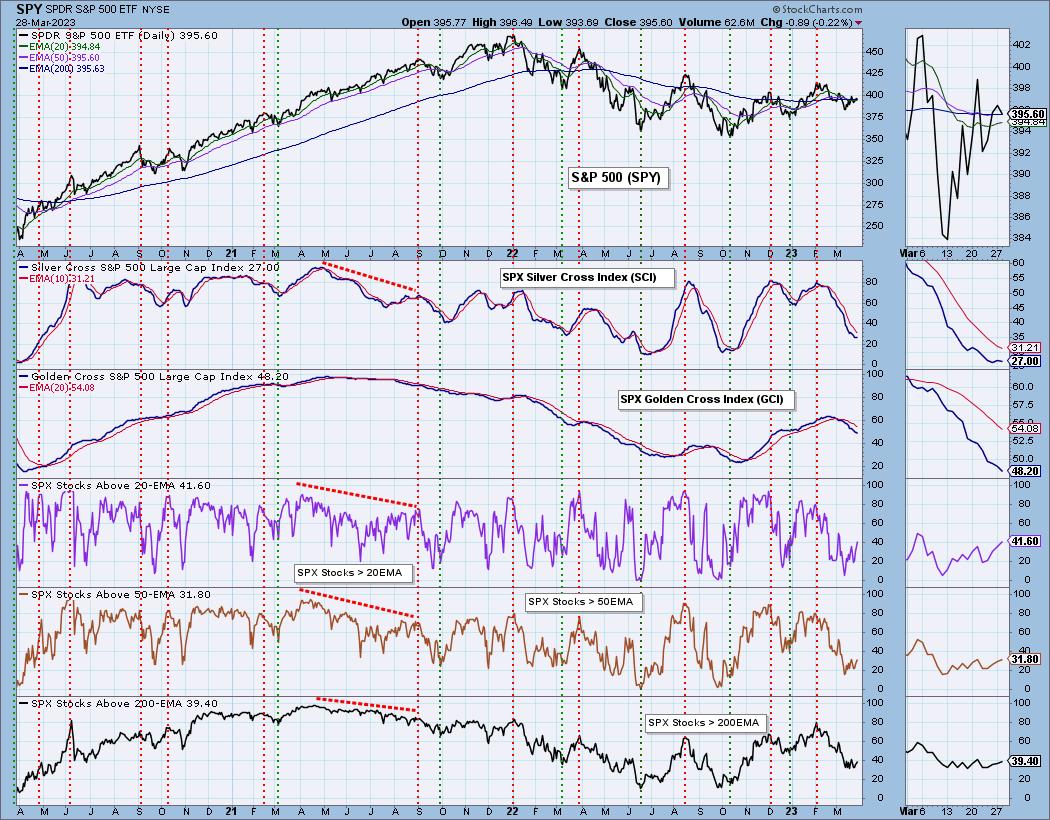
Market Environment: It is important to consider the odds for success by assessing the market tides. The following chart uses different methodologies for objectively showing the depth and trend of participation for intermediate- and long-term time frames.
- The Silver Cross Index (SCI) shows the percentage of SPX stocks on IT Trend Model BUY signals (20-EMA > 50-EMA)
- The Golden Cross Index (GCI) shows the percentage of SPX stocks on LT Trend Model BUY signals (50-EMA > 200-EMA)
Don't forget that as a "Diamonds" member, you have access to our GCI/SCI curated ChartList on DecisionPoint.com. You'll find it under "Members Only" links on the left side on the Blogs and Links Page.
Here is the current chart:
Full Disclosure: I am 23% long, 2% short.
I'm required to disclose if I currently own a stock I mention and/or may buy/short it within the next 72 hours.
"Technical Analysis is a windsock, not a crystal ball." - Carl Swenlin
(c) Copyright 2023 DecisionPoint.com
Watch the latest episode of DecisionPoint Trading Room with Carl & Erin Swenlin on Mondays 7:00p EST or on the DecisionPoint playlist on the StockCharts TV YouTube channel here!
NOTE: The stocks reported herein are from mechanical trading model scans that are based upon moving average relationships, momentum and volume. DecisionPoint analysis is then applied to get five selections from the scans. The selections given should prompt readers to do a chart review using their own analysis process. This letter is not a call for a specific action to buy, sell or short any of the stocks provided. There are NO sure things or guaranteed returns on the daily selection of "Diamonds in the Rough."
Regarding BUY/SELL Signals: The signal status reported herein is based upon mechanical trading model signals and crossovers. They define the implied bias of the price index/stock based upon moving average relationships and momentum, but they do not necessarily call for a specific action. They are information flags that should prompt chart review. Further, they do not call for continuous buying or selling during the life of the signal. For example, a BUY signal will probably (but not necessarily) return the best results if action is taken soon after the signal is generated. Additional opportunities for buying may be found as price zigzags higher, but the trader must look for optimum entry points. Conversely, exit points to preserve gains (or minimize losses) may be evident before the model mechanically closes the signal.
Helpful DecisionPoint Links:
DecisionPoint Shared ChartList and DecisionPoint Chart Gallery
Price Momentum Oscillator (PMO)
Swenlin Trading Oscillators (STO-B and STO-V)
For more links, go to DecisionPoint.com