
Today I had the good fortune to be a panelist on StockChartsTV's "The Pitch" with Mish Schneider and Mary Ellen McGonagle. On the show we each bring five stock picks that we 'pitch' to the audience. Two of today's "Diamonds in the Rough" are from my stock selections. I added a new one today that is showing a very favorable setup.
This will be a spoiler as I'm listing what we all presented. You can review them and then when the show airs tomorrow, you can hear the details. You can watch the show on StockChartsTV at 11:00a ET by clicking the "StockChartsTV" tab from any StockCharts page. The recording should be up on the StockCharts' YouTube channel by around 1p ET.
After negative divergences that appeared yesterday, I was expecting today's decline and given the voracity, it could linger tomorrow. Unfortunately that bullish outlook was severely damaged by a look at our indicators (Keep apprised in the DP Alert.). We could be setting up cheaper entries over the next day or two, but now we have to be on guard with our current positions. I won't be expanding exposure until this decline is digested.
Good Luck & Good Trading,
Erin
Today's "Diamonds in the Rough": AGYS, JCI and PCAR.
Runner-ups: ARRY, AMLX and GUT.
Mary Ellen's Pitch: ABNB, ANET, ALV, META and NVDA.
Mish's Pitch: RMBL, TME, CORN, TEVA and VNM.

RECORDING LINK (3/3/2023):
Topic: DecisionPoint Diamond Mine (3/3/2023) LIVE Trading Room
Recording Link
Passcode: March#3rd
REGISTRATION for 3/10/2023:
When: Mar 10, 2023 09:00 AM Pacific Time (US and Canada)
Topic: DecisionPoint Diamond Mine (3/10/2023) LIVE Trading Room
Register in advance for this webinar HERE
After registering, you will receive a confirmation email containing information about joining the webinar.

Here is the last recording (3/6):
Welcome to DecisionPoint Diamonds, wherein I highlight ten "Diamonds in the Rough" per week. These are selected from the results of my DecisionPoint Scans which search for stocks that could benefit from the trend and condition of the market. Remember, these are not recommendations to buy or sell, but are the most interesting of the stocks that surfaced in my scans. My objective is to save you the work of the initial, tedious culling process, but you need to apply your own analysis to see if these stocks pique your interest as well. There are no guaranteed winners here!
"Predefined Scans Triggered" are taken from StockCharts.com using the "Symbol Summary" option instead of a "SharpChart" on the workbench.
Stop levels are all rounded down.
Agilysys Inc. (AGYS)
EARNINGS: 05/16/2023 (AMC)
Agilysys, Inc. operates as a technology company. It offers innovative software for point-of-sale, payment gateway, reservation and table management, guest offers management, property management, inventory and procurement, analytics, document management, and mobile and wireless solutions and services to the hospitality industry. The firm also serves the gaming industry for both corporate and tribal, hotels resort and cruise, foodservice management, and the restaurant, university, and healthcare sectors. The company was founded in 1963 and is headquartered in Alpharetta, GA.
Predefined Scans Triggered: New 52-week Highs, Moved Above Upper Bollinger Band, P&F Double top Breakout and P&F triple Top Breakout.
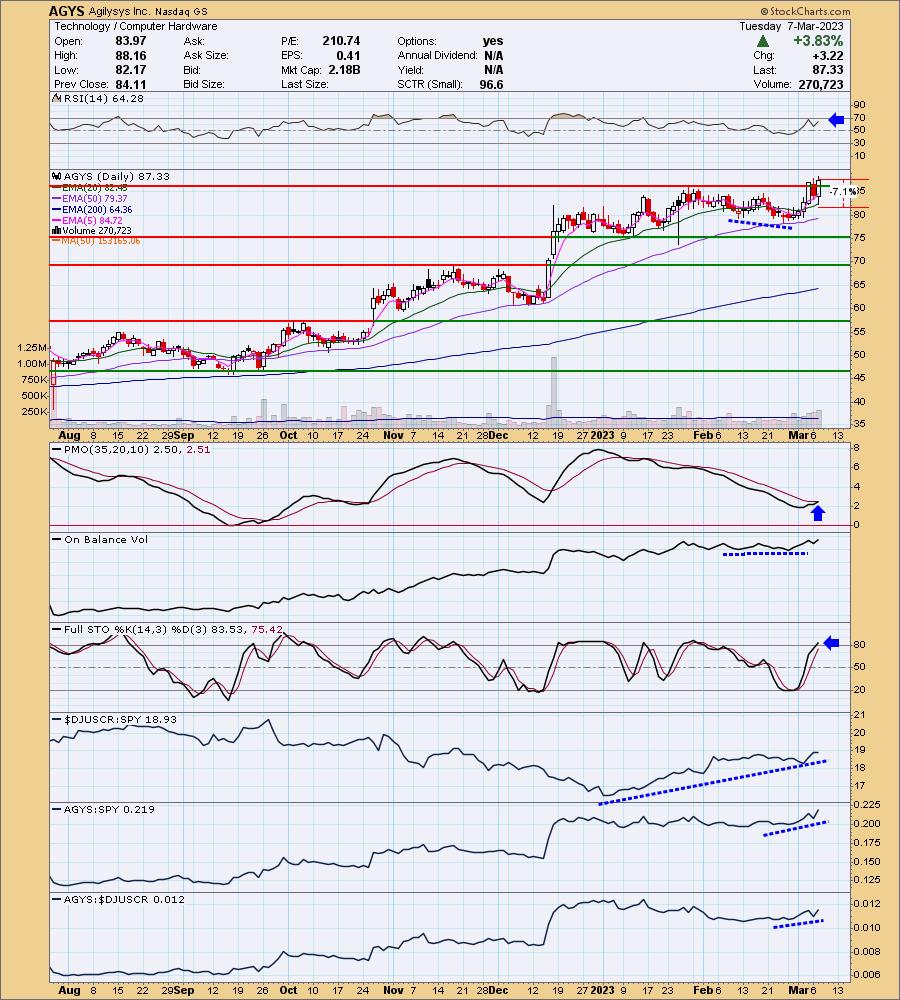
AGYS is unchanged in after hours trading. The market had a bad day, but AGYS did not. In fact, it formed a giant bullish engulfing candlestick and maintained the breakout from Friday. The RSI is positive and the PMO is about to trigger a crossover BUY signal. The OBV holds a slight positive divergence with price lows. Typically those divergences will lead to extended rallies. Stochastics have reached above 80 and relative strength shows a group and this stock beginning to outperform again as relative performance did cool last month. I've set a stop below the 20-day EMA at 7.1% or $81.12.
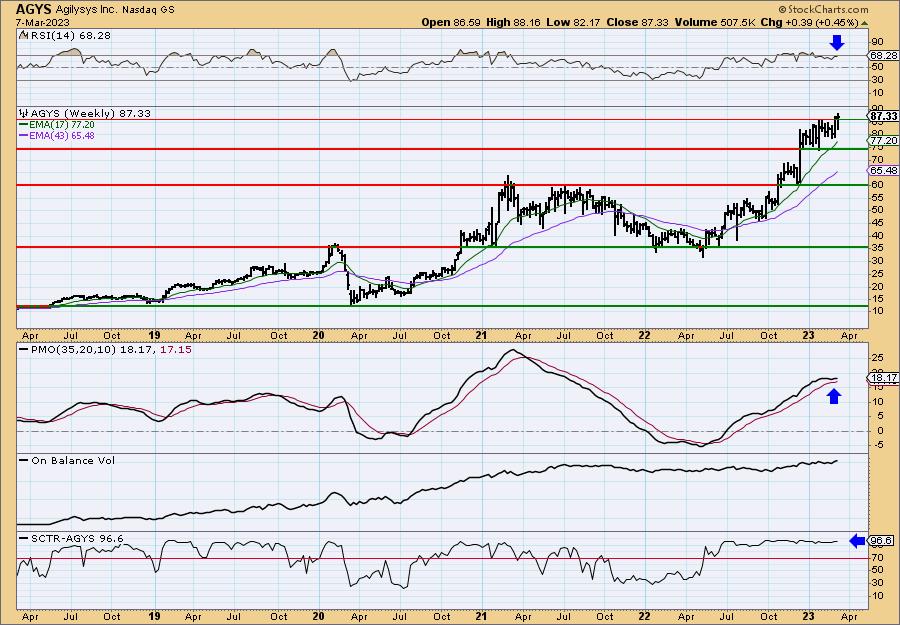
We have another breakout to new all-time highs. The weekly RSI is strong and not really overbought yet. The weekly PMO is turning up above its signal line and is definitely not overbought. The SCTR has been holding at the very top of the "hot zone" since the middle of last year. This stock has plenty of internal strength. Since it is at all-time highs, consider a 15% stop around $100.42.
*We call it the "hot zone" because it implies that the stock/ETF is in the top 30% of its "universe" (large-, mid-, small-caps and ETFs) as far as trend and condition, particularly in the intermediate and long terms.
Johnson Controls Intl plc (JCI)
EARNINGS: 05/03/2023 (BMO)
Johnson Controls International Plc engages in the provision of building products, energy solutions, integrated infrastructure and next generation transportation systems. Its technology and service capabilities include fire, security, HVAC, power solutions and energy storage to serve various end markets including large institutions, commercial buildings, retail, industrial, small business and residential. The company was established in 1885 and is headquartered in Cork, Ireland.
Predefined Scans Triggered: None.
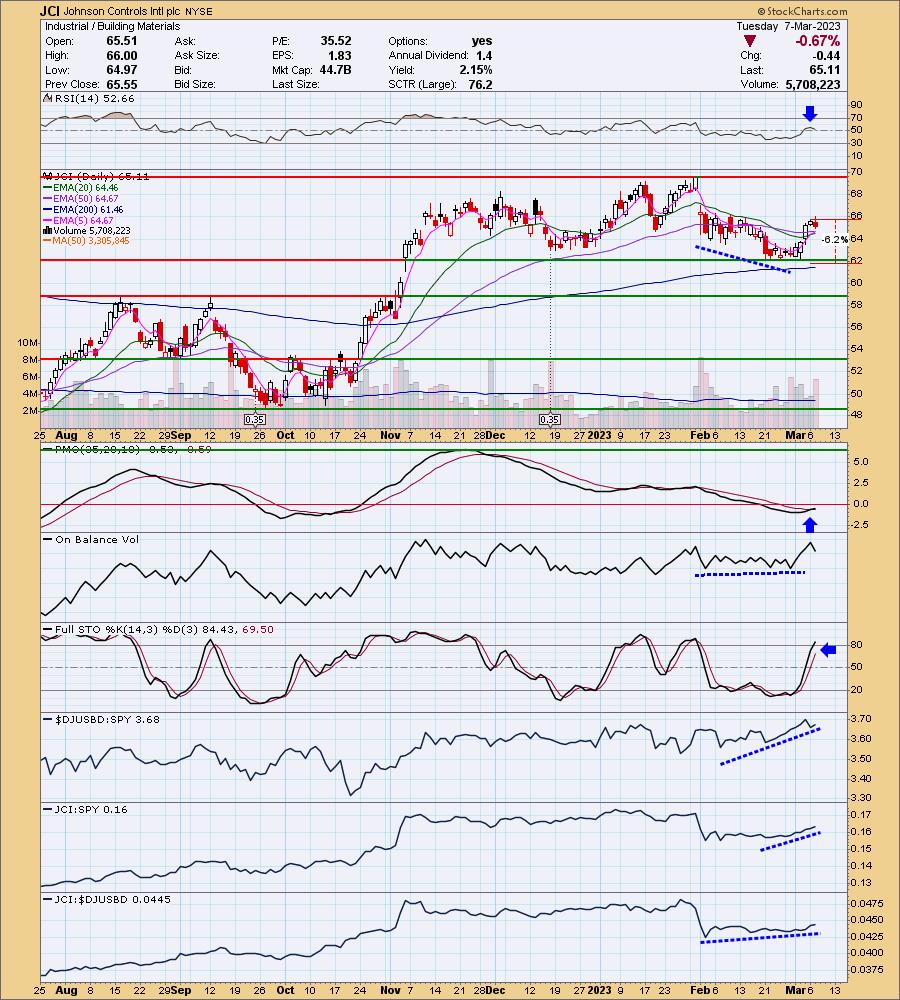
JCI is unchanged in after hours trading. Price has broken out of a declining trend and has pushed above all key moving averages. The RSI is positive and the PMO just triggered a crossover BUY signal today. Stochastics are above 80. After four days of rally, it was due for some pullback. We could see another day or two of decline, but that would form a bullish cup with handle pattern. I've set the stop below support at 6.2% or $61.07.
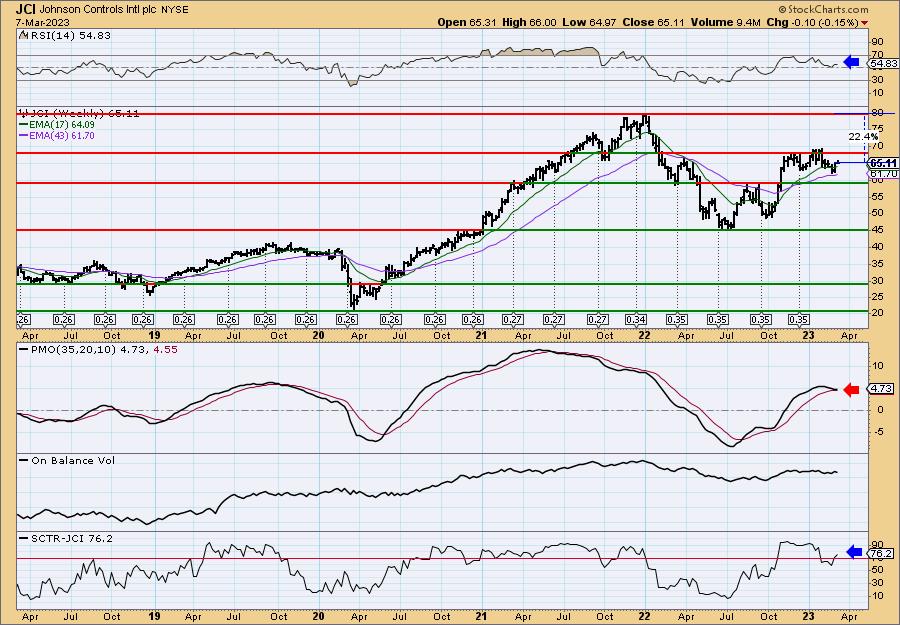
The weekly chart looks less appetizing given the weekly PMO is topping. On the bright side, it hasn't triggered a crossover SELL signal yet and it could avoid it with a positive close this week. Other than the PMO this looks pretty good. The weekly RSI is positive and the SCTR is back in the "hot zone". Should price overcome near-term resistance, we have an upside target at the all-time high which is over 22% away.
PACCAR, Inc. (PCAR)
EARNINGS: 04/25/2023 (BMO)
PACCAR, Inc. is a global technology company, which engages in the design and manufacture of light, medium, and heavy-duty trucks. It operates through the following segments: Truck, Parts and Financial Services. The Truck segment designs and manufactures heavy, medium, and light duty diesel trucks which are marketed under the Kenworth, Peterbilt, and DAF brands. The Parts segment distributes aftermarket parts for trucks and related commercial vehicles. The Financial Services segment provides finance and leasing products and services provided to truck customers and dealers. The company was founded by William Pigott Sr. in 1905 and is headquartered in Bellevue, WA.
Predefined Scans Triggered: New 52-week Highs and Stocks in a New Uptrend (ADX).
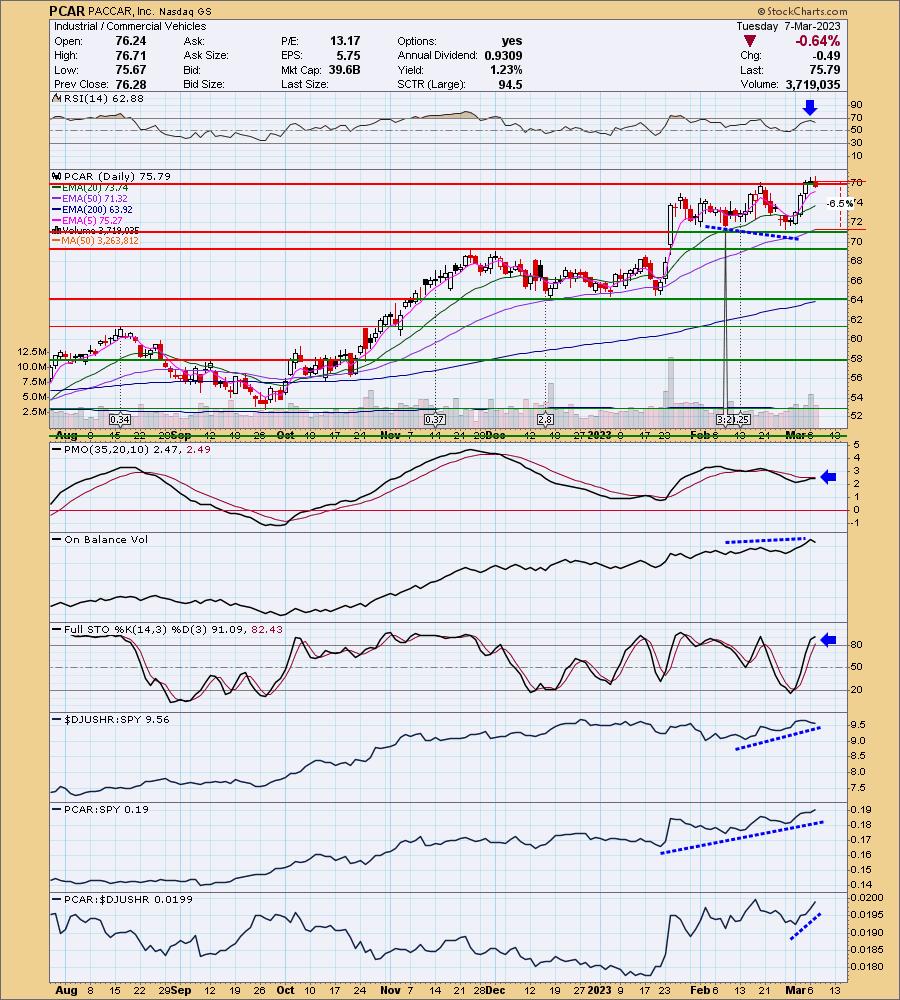
PCAR is up +0.40% in after hours trading. Friday saw a tiny breakout and now price is consolidating right at support near the February high. The RSI is positive and the PMO is nearing a crossover BUY signal. There is a positive OBV divergence that led into this rally. Stochastics are above 80. Relative strength is rising for both the industry group and PCAR. PCAR is a leader amongst its group given the rising relative strength line. The stop is set at 6.5% below support around $70.86.
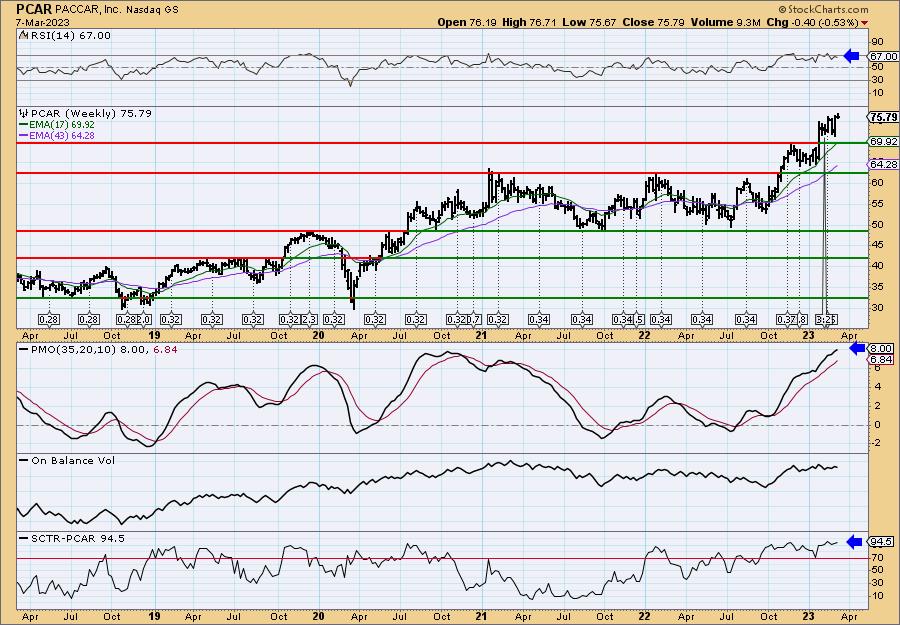
The weekly chart is excellent, although we do note that the PMO is overbought. Still, it is rising strongly and could push even higher should the rising trend hold up. The weekly RSI is positive and the SCTR is at an excellent 94.5%. Given it is at all-time highs, consider an upside target of 15% or $87.16.
Don't forget, on Thursdays I look at reader-requested symbols, click HERE to send me an email. I read every email I receive and try to answer them all!
Current Market Outlook:
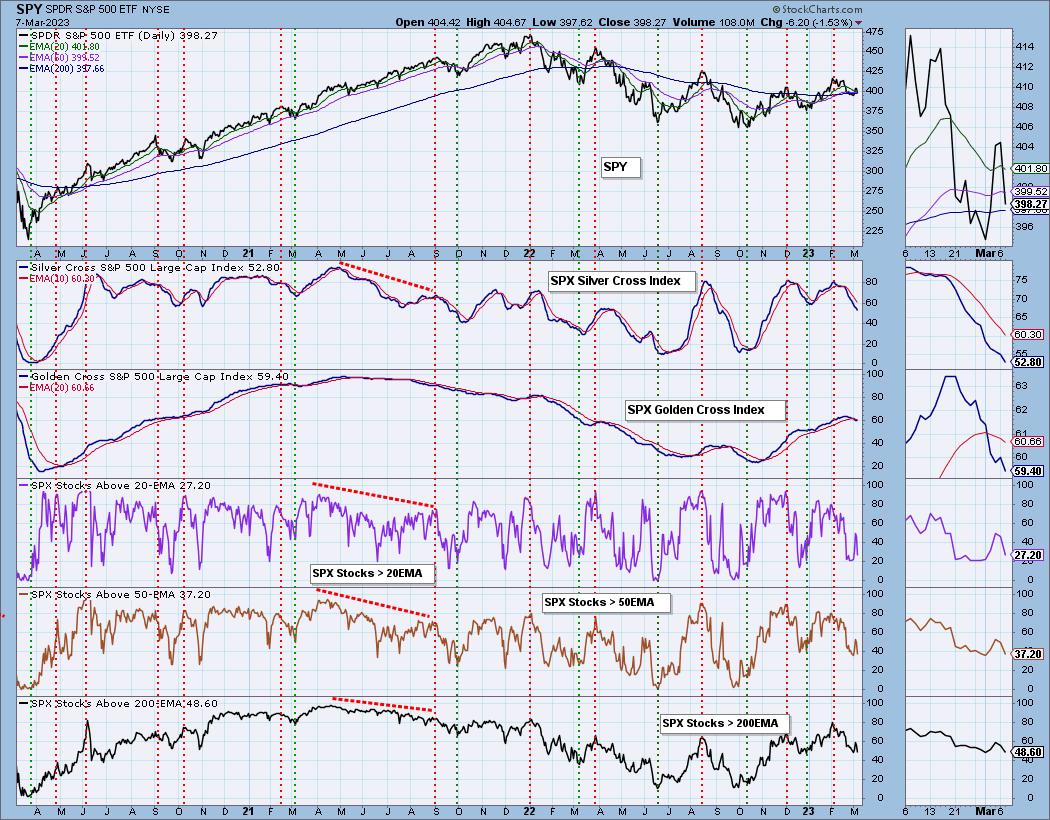
Market Environment: It is important to consider the odds for success by assessing the market tides. The following chart uses different methodologies for objectively showing the depth and trend of participation for intermediate- and long-term time frames.
- The Silver Cross Index (SCI) shows the percentage of SPX stocks on IT Trend Model BUY signals (20-EMA > 50-EMA)
- The Golden Cross Index (GCI) shows the percentage of SPX stocks on LT Trend Model BUY signals (50-EMA > 200-EMA)
Don't forget that as a "Diamonds" member, you have access to our GCI/SCI curated ChartList on DecisionPoint.com. You'll find it under "Members Only" links on the left side on the Blogs and Links Page.
Here is the current chart:
Full Disclosure: I am 25% exposed.
I'm required to disclose if I currently own a stock I mention and/or may buy/short it within the next 72 hours.
"Technical Analysis is a windsock, not a crystal ball." - Carl Swenlin
(c) Copyright 2023 DecisionPoint.com
Watch the latest episode of DecisionPoint Trading Room with Carl & Erin Swenlin on Mondays 7:00p EST or on the DecisionPoint playlist on the StockCharts TV YouTube channel here!
NOTE: The stocks reported herein are from mechanical trading model scans that are based upon moving average relationships, momentum and volume. DecisionPoint analysis is then applied to get five selections from the scans. The selections given should prompt readers to do a chart review using their own analysis process. This letter is not a call for a specific action to buy, sell or short any of the stocks provided. There are NO sure things or guaranteed returns on the daily selection of "Diamonds in the Rough."
Regarding BUY/SELL Signals: The signal status reported herein is based upon mechanical trading model signals and crossovers. They define the implied bias of the price index/stock based upon moving average relationships and momentum, but they do not necessarily call for a specific action. They are information flags that should prompt chart review. Further, they do not call for continuous buying or selling during the life of the signal. For example, a BUY signal will probably (but not necessarily) return the best results if action is taken soon after the signal is generated. Additional opportunities for buying may be found as price zigzags higher, but the trader must look for optimum entry points. Conversely, exit points to preserve gains (or minimize losses) may be evident before the model mechanically closes the signal.
Helpful DecisionPoint Links:
DecisionPoint Shared ChartList and DecisionPoint Chart Gallery
Price Momentum Oscillator (PMO)
Swenlin Trading Oscillators (STO-B and STO-V)
For more links, go to DecisionPoint.com