
It's Reader Request Day and Mailbag! I haven't had a mailbag question in a few weeks, but this one came in today asking about the use of the 5-minute PMO to time entries:
Can you elucidate how the PMO can be used reading the crossovers on the 5 minute daily scale?
Below is a 5-minute candlestick chart that I will use as an example. There are two types of entries, conservative and aggressive. I'll explain the conservative rules. The aggressive entry doesn't wait for the conservative rules to apply.
Conservative Entries: PMO upside crossover and positive RSI (above 50)
Conservative Sell: PMO Turns Down
Aggressive Entries:
- PMO rising and/or crossover BUY with negative RSI
- RSI positive with PMO rising (very aggressive if PMO falling)
- Or any other combination that isn't a "conservative entry"
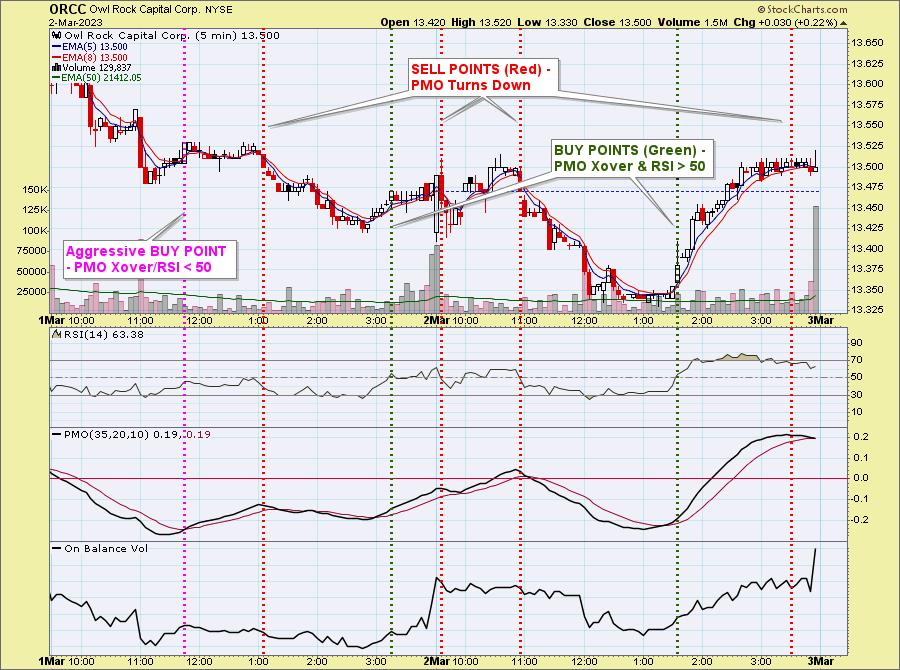
I think that covers it, but if you have further questions let me know. The unfortunate issue is that it doesn't generally happen right when you pull up the chart. It will often times require rechecks, but even if the PMO crossed over an hour or more previously and it is rising with a positive RSI, that would also be a conservative entry. The main idea is to avoid buying at tops and to sell before a midday decline.
Today's requests were easy, but I do note that three are down in after hours trading. Thank you for sending in some really nice looking charts! Remember, if you'd like me to look at your request, email them to me. Also, if you can't attend the Diamond Mine live, you can always send your symbol requests by Thursday night. I'm usually in a rush in the morning to prepare the spreadsheet and don't always check my email.
Good news! I have organized and made a spreadsheet that will encompass the past four weeks of "Diamonds in the Rough". I will update it on Fridays and denote if stops are hit.
Good Luck & Good Trading,
Erin
Today's "Diamonds in the Rough": BVN, IMAX, LUNA and X.
Other requests: RGLD, AVD, DEN, HNRG, MAXN, WDS, AMBC, AMX, BWXT, CIVI and REGN.

RECORDING LINK (2/24/2023):
Topic: DecisionPoint Diamond Mine (2/24/2023) LIVE Trading Room
Passcode: Feb#24th
REGISTRATION for 3/3/2023:
When: Mar 3, 2023 09:00 AM Pacific Time (US and Canada)
Topic: DecisionPoint Diamond Mine (3/3/2023) LIVE Trading Room
Register in advance for this webinar HERE
After registering, you will receive a confirmation email containing information about joining the webinar.

Here is the last recording (2/27):
Recording Dated: 2/27/2023
Welcome to DecisionPoint Diamonds, wherein I highlight ten "Diamonds in the Rough" per week. These are selected from the results of my DecisionPoint Scans which search for stocks that could benefit from the trend and condition of the market. Remember, these are not recommendations to buy or sell, but are the most interesting of the stocks that surfaced in my scans. My objective is to save you the work of the initial, tedious culling process, but you need to apply your own analysis to see if these stocks pique your interest as well. There are no guaranteed winners here!
"Predefined Scans Triggered" are taken from StockCharts.com using the "Symbol Summary" option instead of a "SharpChart" on the workbench.
Stop levels are all rounded down.
Compania de Minas Buenaventura SA (BVN)
EARNINGS: 04/27/2023 (AMC)
Compania de Minas Buenaventura SAA engages in the development and exploration of mineral properties. It operates through the following segments: Production and Sale of Minerals, Exploration and Development Activitie, Energy Generation and Transmission Services, Insurance Brokerage, Rental of Mining Concessions, Holding of Investments in Shares, and Industrial Activities. The company was founded by Alberto Benavides de la Quintana on September 7, 1953 and is headquartered in Lima, Peru.
Predefined Scans Triggered: Moved Above Upper Keltner Channel, Moved Above Upper Price Channel and P&F Low Pole.
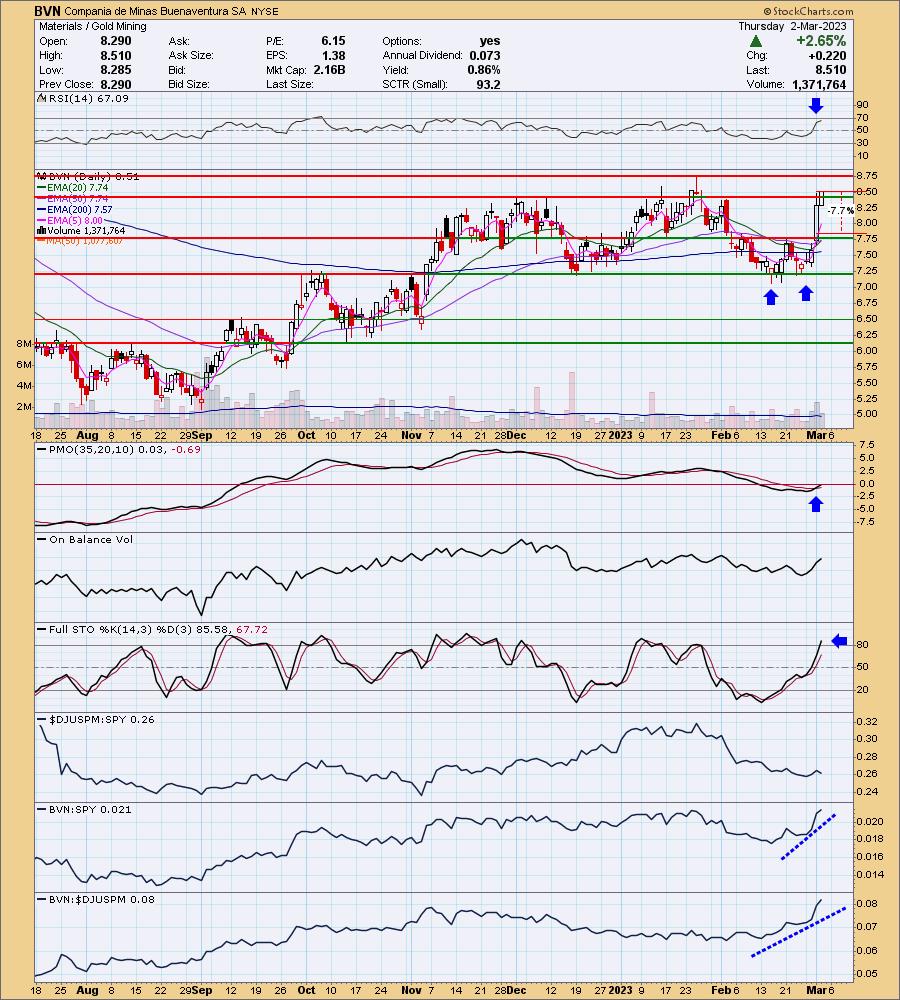
BVN is down -2.70% in after hours trading. Gold Miners took back much of their gains, but they are beginning to reverse higher. This selection takes advantage of relative strength of the stock against the group. I like the Gold chart and short-term indicators are telling me the market is ready for a short upside reversal. Those conditions will serve Gold Miners well. It had a big day on earnings which were reported on Tuesday, after the market closed; hence the big rally yesterday. Today saw a nice continuation. It is within a resistance zone, but the indicators are quite favorable. The RSI is positive, rising and not overbought. The PMO just triggered a crossover BUY signal. Stochastics are now above 80. The bullish double-bottom pattern has fulfilled its upside target. The stop is set just above the confirmation line of the double-bottom at 7.7% or $7.85. It was too deep when set beneath support.
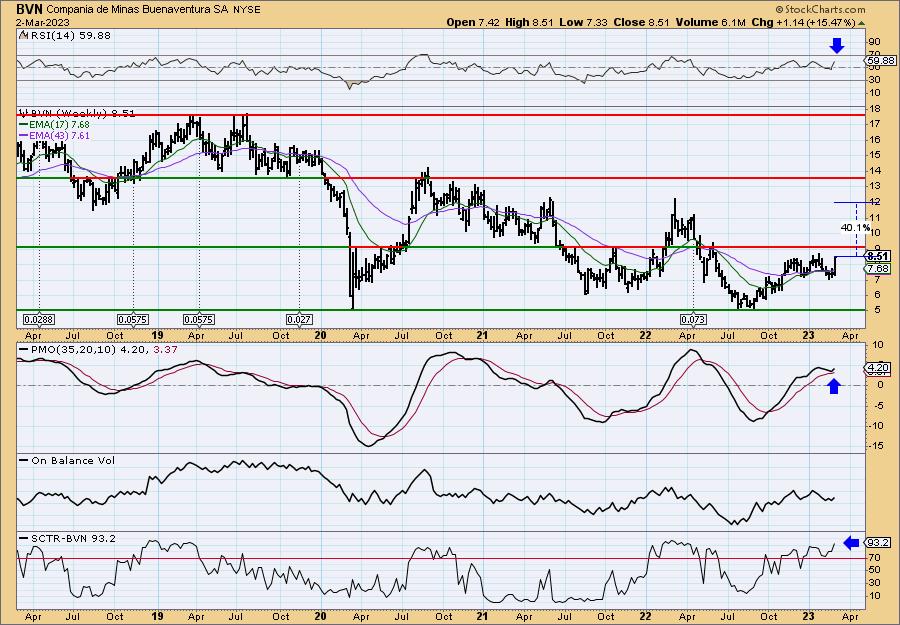
Resistance does look formidable on the weekly chart, but if it can get above it, I see a 40%+ gain possible. The weekly RSI is in positive territory and not overbought. The weekly PMO just turned up above its signal line. The SCTR is well within the "hot zone" at an excellent 93.2%.
*We call it the "hot zone" because it implies that the stock/ETF is in the top 30% of its "universe" (large-, mid-, small-caps and ETFs) as far as trend and condition, particularly in the intermediate and long terms.
Imax Corp. (IMAX)
EARNINGS: 04/27/2023 (AMC)
IMAX Corp. is an entertainment technology company, which engages in the business of motion picture technologies and presentations. It operates through following business segments: IMAX Technology Network, IMAX Technology Sales and Maintenance, and Film Distribution and Post-Production. The IMAX Technology Network segment includes the IMAX DMR segment and contingent rent from the JRSA segment. The IMAX Technology Sales and Maintenance segment refers to the IMAX Systems, IMAX Maintenance, and other theater business segments, as well as fixed revenues from the JRSA segment. The Film Distribution and Post-Production segment relates to the distribution of large-format documentary films. The company was founded by Graeme Ferguson, Roman Kroitor, Robert P. Kerr and William Shaw in 1967 and is headquartered in Mississauga, Canada.
Predefined Scans Triggered: Improving Chaikin Money Flow, Moved Above Upper Keltner Channel, Moved Above Upper Bollinger Band, Moved Above Upper Price Channel and P&F Double Top Breakout.
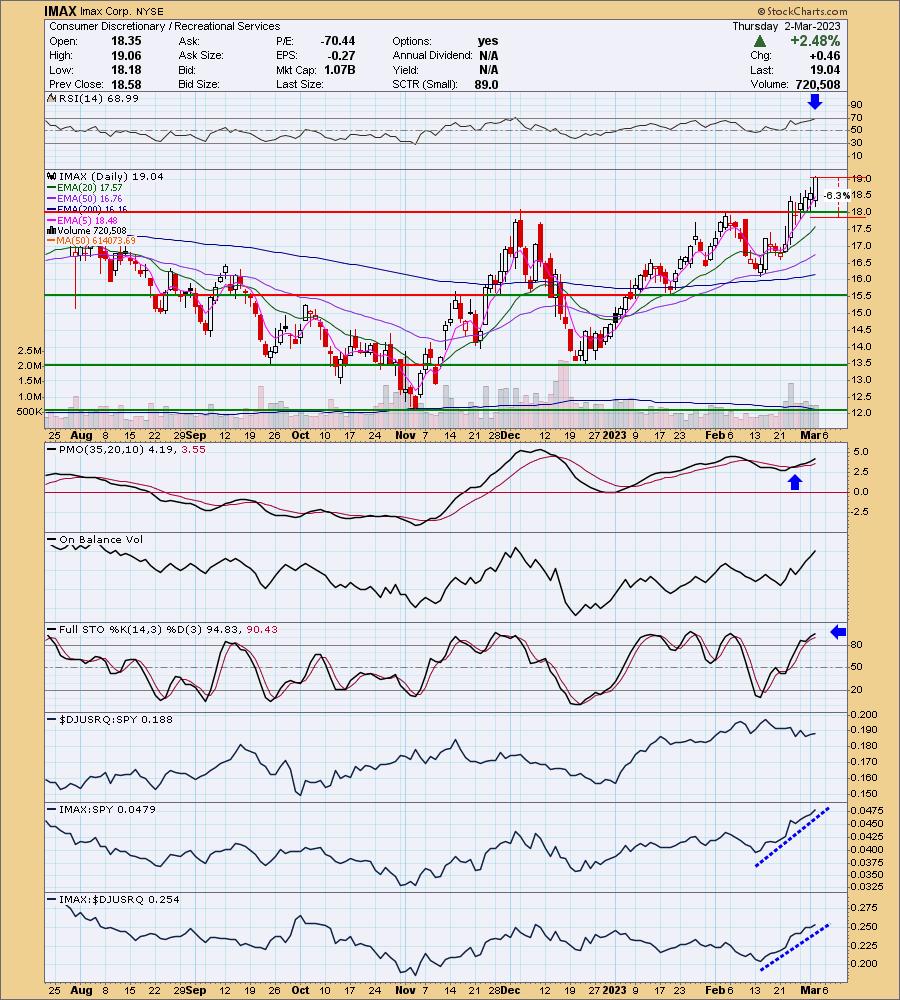
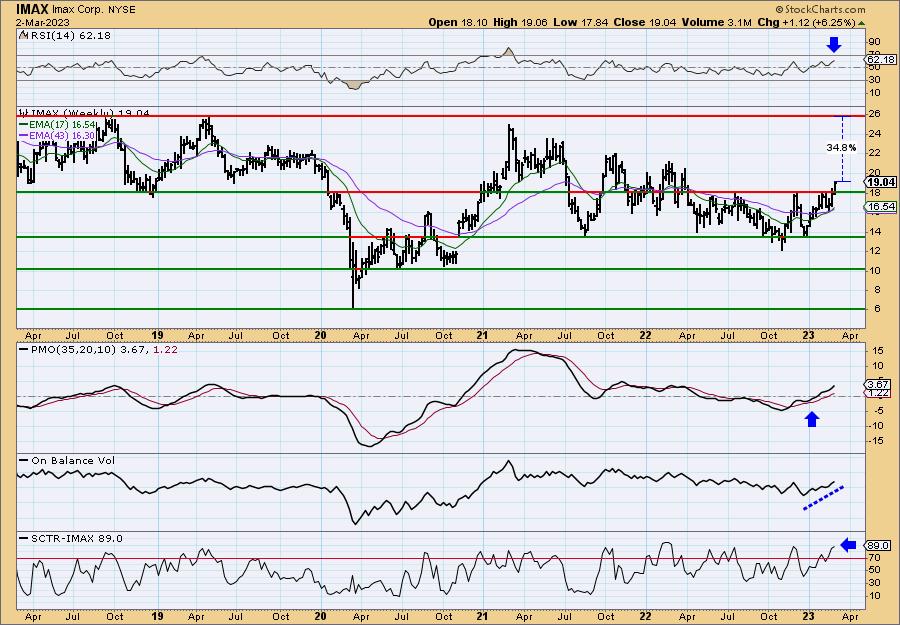
IMAX is down -1.68% in after hours trading. After reporting on 2/22, this stock has been on a great run. Today's big bullish engulfing candlestick suggests more upside tomorrow in spite of the negative after hours trading action. The RSI is positive and not yet overbought. The PMO is on a crossover BUY signal and rising. Stochastics are above 80. The group is really underperforming which could be a drag on IMAX, but based on relative strength it hasn't hurt it much. The stop is set at about 6.3% or $17.84.
I was impressed with the upside potential on this very nice breakout above near-term resistance and the 2018/2019 lows. The weekly RSI is rising in positive territory and isn't overbought. The weekly PMO has bottomed above its signal line which is extra bullish. The OBV is confirming the rally. The SCTR is a strong 89%.
Luna Innovations Inc. (LUNA)
EARNINGS: 03/14/2023 (AMC)
Luna Innovations, Inc. engages as an advanced optical technology company. The firm provides high performance fiber optic test, measurement and control products for the telecommunications and photonics industries, and distributed fiber optic sensing solutions that measure and monitor materials and structures for applications in aerospace, automotive, energy, oil and gas, security and infrastructure. Its distributed fiber optic sensing products help designers and manufacturers more efficiently develop new and innovative products by measuring stress, strain, and temperature at a high resolution for new designs or manufacturing processes. The company was founded by Kent A. Murphy in July 1990 and is headquartered in Roanoke, VA.
Predefined Scans Triggered: None.
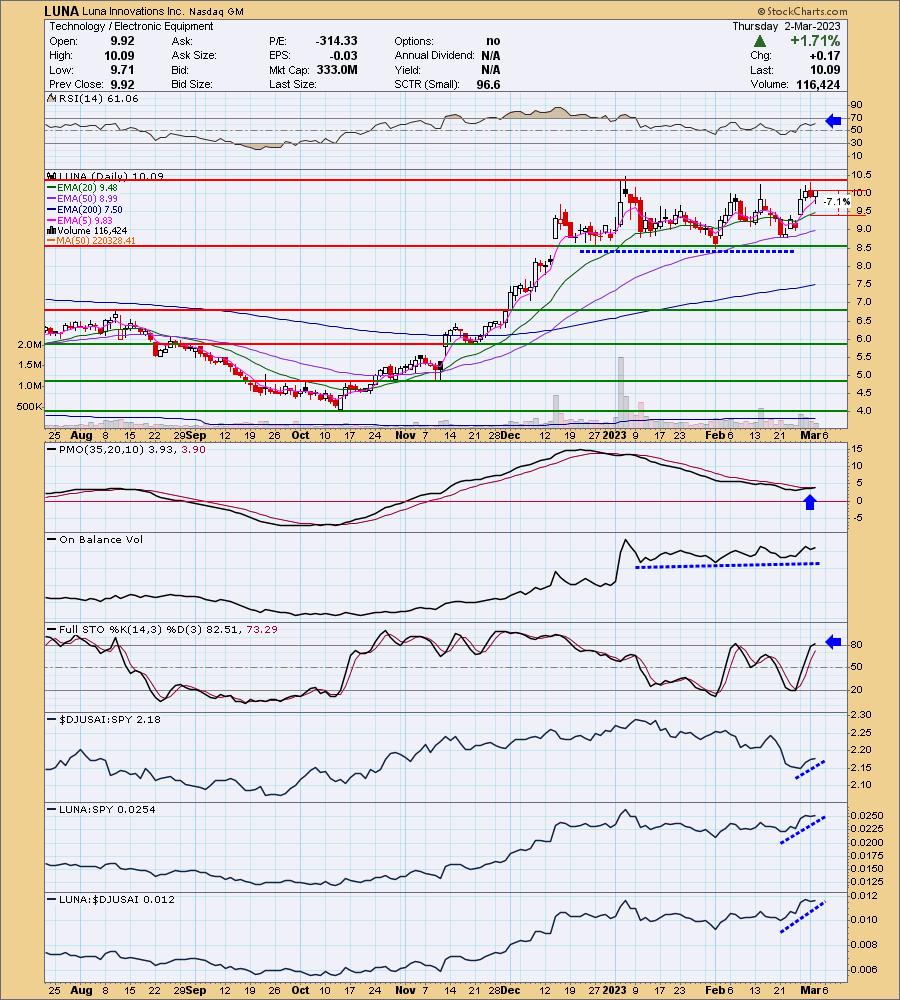
LUNA is up +1.59% in after hours trading. It will be reporting a few weeks so keep that in mind. I generally am not a fan of trading ranges but this one is looking interesting. The RSI is firmly positive and the PMO just triggered a crossover BUY signal. There is a slight positive OBV divergence between price lows and OBV lows. Stochastics are now above 80. The group is starting to show some improvement and LUNA is currently outperforming the group and the SPY. It is still vulnerable to another test of the bottom of the range, but notice that prior upside reversals were not accompanied by a crossover BUY signal or even rising PMO in some cases. It looks more ripe now. The stop is set below the 20-day EMA at around 7.1% or $9.37.
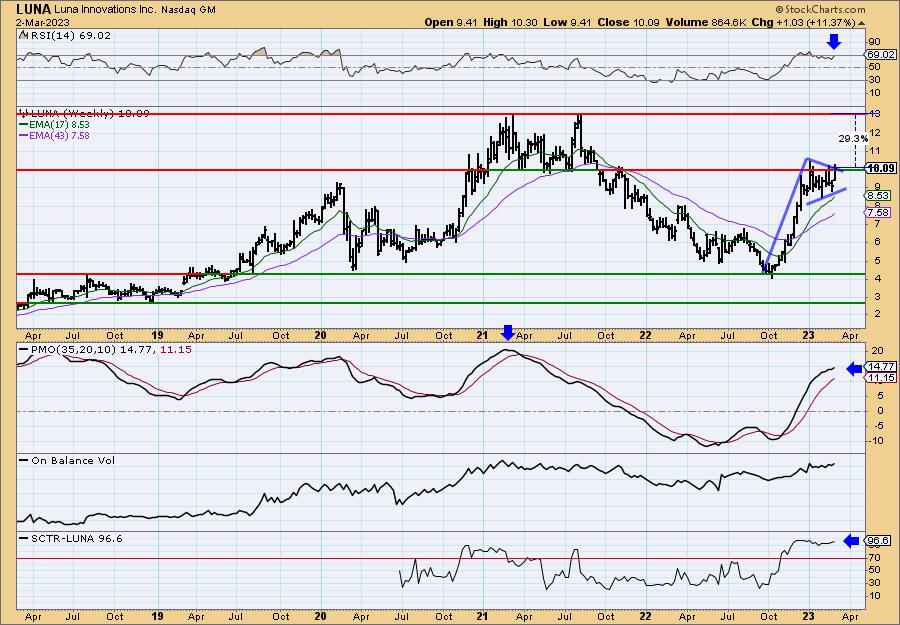
We have a bullish flag formation with a pennant for a flag. This week it is beginning to breakout above resistance and out of the flag. The weekly RSI is positive and not yet overbought. The weekly PMO is rising on a BUY signal and isn't overbought. The SCTR is an exceptional 96.6%. Upside potential is nearly 30%.
USX-US Steel Group, Inc. (X)
EARNINGS: 05/04/2023 (AMC)
United States Steel Corp. engages in the manufacturing and selling of steel products. It operates through the following business segments: Flat-Rolled Products, Mini Mill, U.S. Steel Europe, and Tubular Products. The Flat-Rolled Products segment includes managing steel plants and production facilities that manufacture steel slabs, rounds, strip mill plates, sheets, tin mill, iron ore, and coke. The Mini Mill segment produces hot-rolled, cold-rolled and coated sheets. The U.S. Steel Europe segment produces and markets strip mill plates, spiral welded pipe, heating radiators, refractory ceramic materials. The Tubular Products segment manufactures and trades seamless and electric resistance welded steel casing and tubing, line pipe, and mechanical tubing. The company was founded in 1901 and is headquartered in Pittsburgh, PA.
Predefined Scans Triggered: None.
X is down -0.58% in after hours trading. Yesterday it broke out, but formed a bearish filled black candlestick. The bearish candle did not fulfill and instead we saw a pullback to intraday lows and a close above resistance. The RSI is positive and not overbought. The PMO just triggered a crossover BUY signal. Stochastics are above 80 and relative strength is looking pretty good. The group is doing very well against the SPY and X is seeing some strength against this already successful group so it is hence outperforming the SPY. The stop is set below the 20-day EMA at 7% or $28.84.
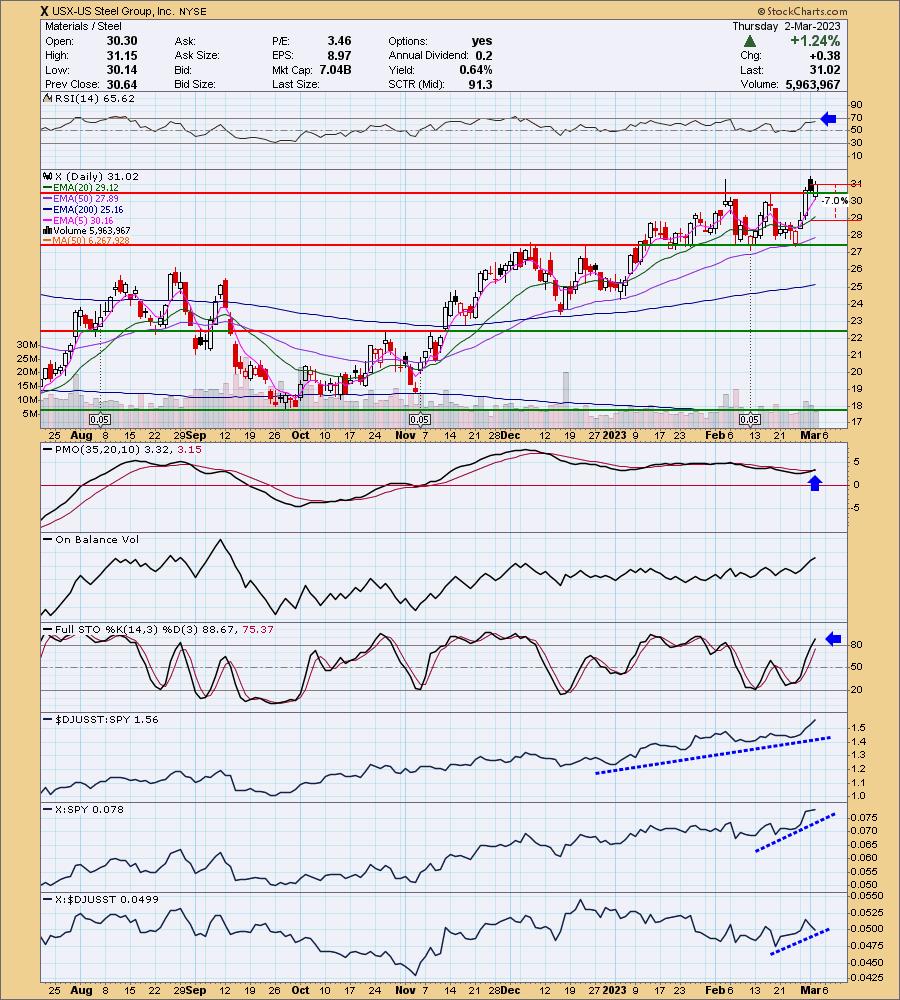
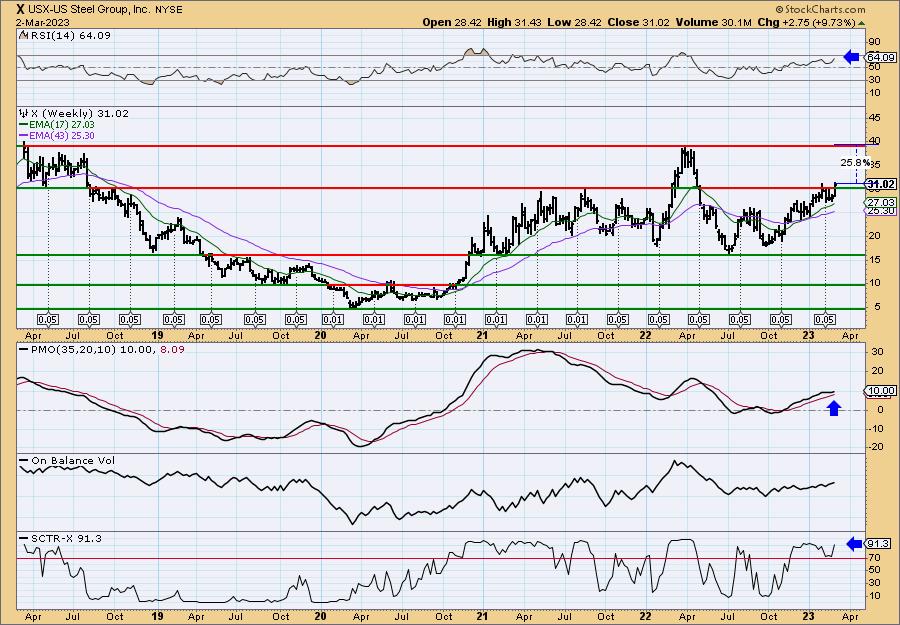
The weekly chart shows an impressive breakout above overhead resistance, very strong overhead resistance I might add. The weekly RSI is positive, rising and not overbought. The weekly PMO is turning back up above its signal line which is especially bullish. The OBV is confirming the rising trend and the SCTR is in the top of the hot zone at 91.3%. Upside potential if it can reach the 2022 high is over 25%. I think it is doable.
Don't forget, on Thursdays I look at reader-requested symbols, click HERE to send me an email. I read every email I receive and try to answer them all!
Current Market Outlook:
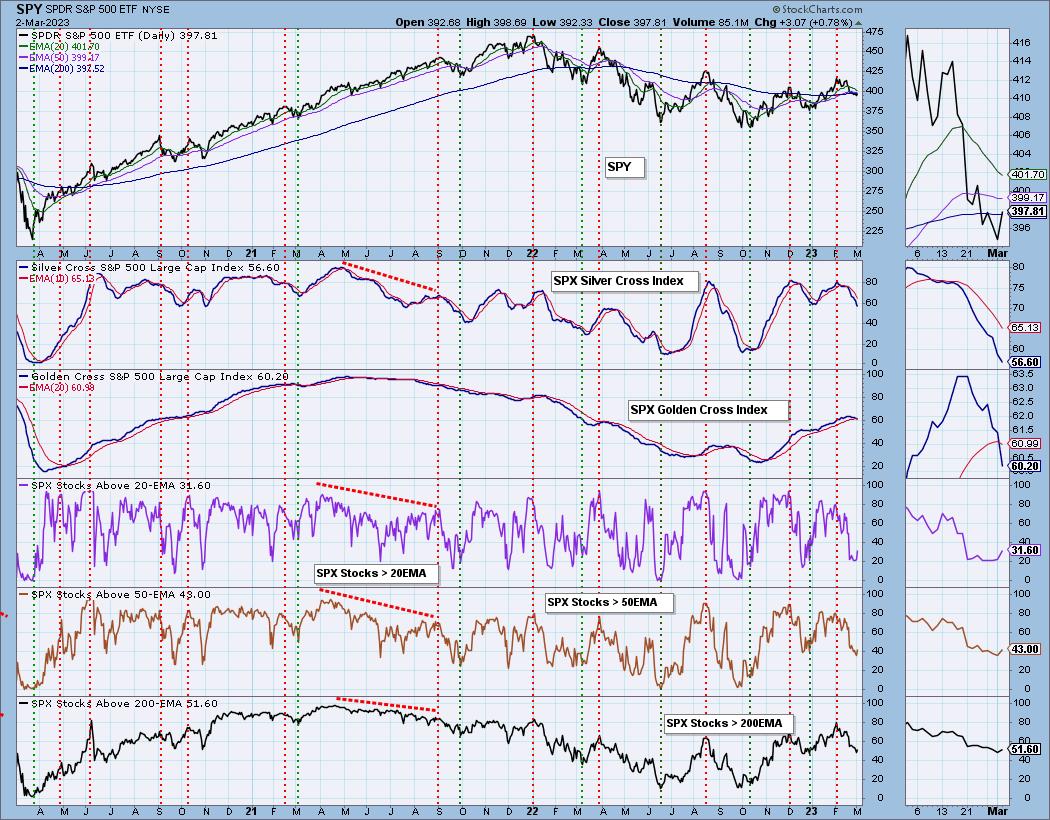
Market Environment: It is important to consider the odds for success by assessing the market tides. The following chart uses different methodologies for objectively showing the depth and trend of participation for intermediate- and long-term time frames.
- The Silver Cross Index (SCI) shows the percentage of SPX stocks on IT Trend Model BUY signals (20-EMA > 50-EMA)
- The Golden Cross Index (GCI) shows the percentage of SPX stocks on LT Trend Model BUY signals (50-EMA > 200-EMA)
Don't forget that as a "Diamonds" member, you have access to our GCI/SCI curated ChartList on DecisionPoint.com. You'll find it under "Members Only" links on the left side on the Blogs and Links Page.
Here is the current chart:
Full Disclosure: I am 22% exposed.
I'm required to disclose if I currently own a stock I mention and/or may buy/short it within the next 72 hours.
"Technical Analysis is a windsock, not a crystal ball." - Carl Swenlin
(c) Copyright 2023 DecisionPoint.com
Watch the latest episode of DecisionPoint Trading Room with Carl & Erin Swenlin on Mondays 7:00p EST or on the DecisionPoint playlist on the StockCharts TV YouTube channel here!
NOTE: The stocks reported herein are from mechanical trading model scans that are based upon moving average relationships, momentum and volume. DecisionPoint analysis is then applied to get five selections from the scans. The selections given should prompt readers to do a chart review using their own analysis process. This letter is not a call for a specific action to buy, sell or short any of the stocks provided. There are NO sure things or guaranteed returns on the daily selection of "Diamonds in the Rough."
Regarding BUY/SELL Signals: The signal status reported herein is based upon mechanical trading model signals and crossovers. They define the implied bias of the price index/stock based upon moving average relationships and momentum, but they do not necessarily call for a specific action. They are information flags that should prompt chart review. Further, they do not call for continuous buying or selling during the life of the signal. For example, a BUY signal will probably (but not necessarily) return the best results if action is taken soon after the signal is generated. Additional opportunities for buying may be found as price zigzags higher, but the trader must look for optimum entry points. Conversely, exit points to preserve gains (or minimize losses) may be evident before the model mechanically closes the signal.
Helpful DecisionPoint Links:
DecisionPoint Shared ChartList and DecisionPoint Chart Gallery
Price Momentum Oscillator (PMO)
Swenlin Trading Oscillators (STO-B and STO-V)
For more links, go to DecisionPoint.com