
The market appears ready to digest the rally as a bearish engulfing candlestick formed on the SPY. Scan results weren't scant, but I wasn't thrilled with the charts today. I wasn't surprised to see similar bearish engulfing candlesticks, but I had a lot of topping Stochastics and even bearish filled black candlesticks. Not to worry, I did find three selections lined up to rally.
One of the stocks, Berry Petroleum (BRY) should take advantage of the new rally in Crude Oil. I've liked Materials of late and decided to include Scotts Co (SMG), the maker's of Miracle-Gro. My final selection is from the Financial sector. I still have my inverse ETF for Financials, but I decided this Insurance group stock, Kemper Corp (KMPR) had a great looking chart. I did see a few Banks on the list, but I'm still gun shy regarding Banks.
Good Luck & Good Trading,
Erin
Today's "Diamonds in the Rough": BRY, KMPR and SMG.
Runner-ups: DRS, ET, FTI, IHG, MAX, GOF, META, SRPT and RDFN.

RECORDING LINK (3/31/2023):
Topic: DecisionPoint Diamond Mine (3/31/2023) LIVE Trading Room
Passcode: March#31
REGISTRATION for 4/7/2023:
When: Apr 7, 2023 09:00 AM Pacific Time (US and Canada)
Topic: DecisionPoint Diamond Mine (4/7/2023) LIVE Trading Room
Register in advance for this webinar HERE.
After registering, you will receive a confirmation email containing information about joining the webinar.

Here is the last recording (4/3):
Welcome to DecisionPoint Diamonds, wherein I highlight ten "Diamonds in the Rough" per week. These are selected from the results of my DecisionPoint Scans which search for stocks that could benefit from the trend and condition of the market. Remember, these are not recommendations to buy or sell, but are the most interesting of the stocks that surfaced in my scans. My objective is to save you the work of the initial, tedious culling process, but you need to apply your own analysis to see if these stocks pique your interest as well. There are no guaranteed winners here!
"Predefined Scans Triggered" are taken from StockCharts.com using the "Symbol Summary" option instead of a "SharpChart" on the workbench.
Stop levels are all rounded down.
Berry Petroleum Corp. (BRY)
EARNINGS: 05/03/2023 (BMO)
Berry Corp. is an energy exploration company, which engages in the acquisition, exploration, development, and production of domestic oil and natural gas reserves. It operates through the Exploration and Production (E&P) and Well Servicing and Abandonment segments. The E&P segment consists of the development and production of onshore, low geologic risk, long-lived conventional oil and gas reserves, primarily located in California, as well as Utah. The Well Servicing and Abandonment segment is involved in the wellsite services in California to oil and natural gas production companies, with a focus on well servicing, well abandonment services and water logistics. The company was founded by C. J. Berry in 1909 and is headquartered in Dallas, TX.
Predefined Scans Triggered: P&F High Pole.
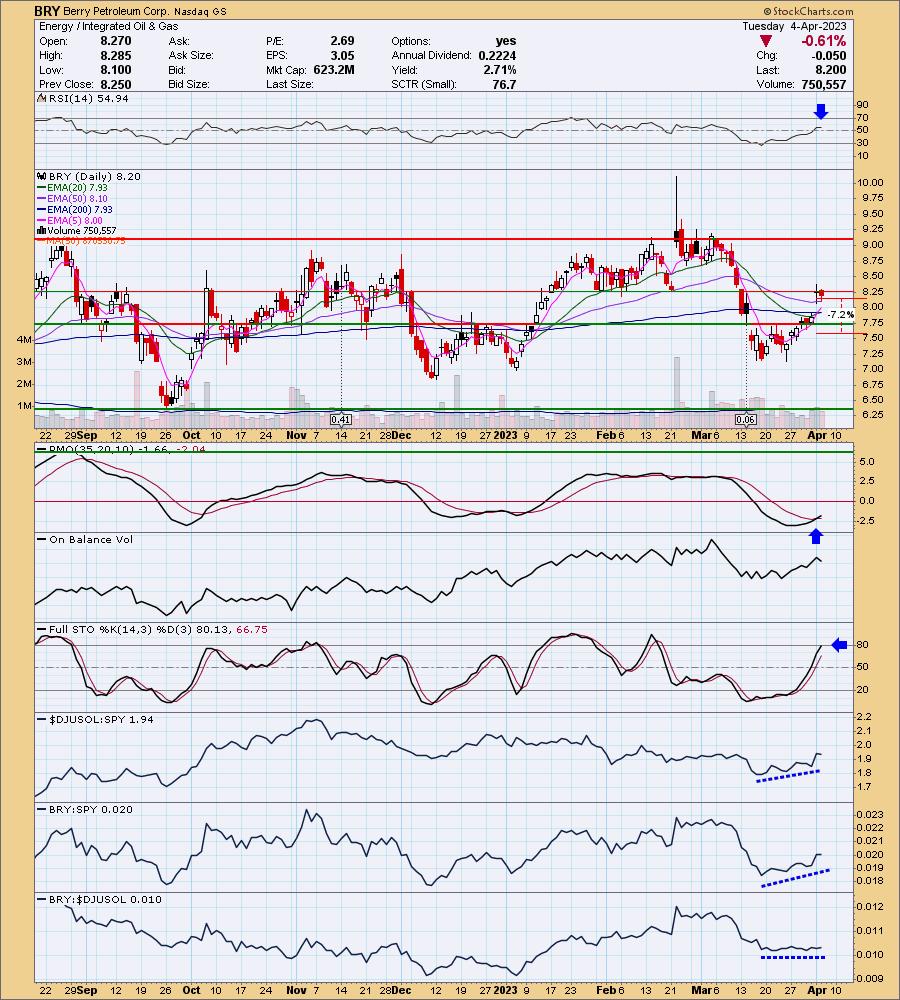
BRY is down -1.10% in after hours trading. Price gapped up alongside Crude Oil yesterday, but spent the day digesting that rally. Technically price is beneath near-term resistance, but indicators are very positive suggesting a breakout ahead. The RSI is positive and not overbought. The PMO is rising on a clean crossover BUY signal. OBV is rising in line with price and Stochastics are now above 80 and rising.The stop is set below the gap and below the next level of support at 7.2% or $7.60.
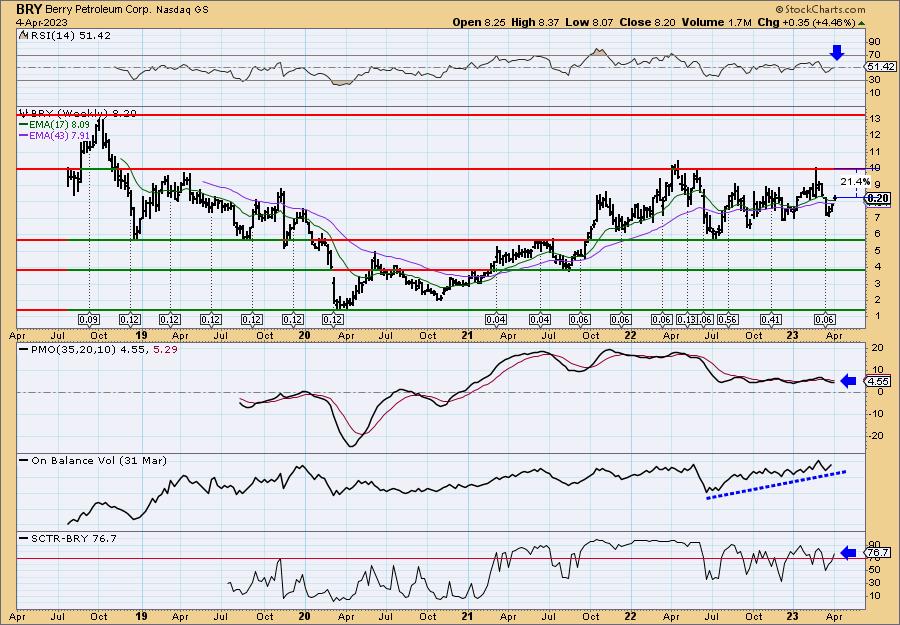
BRY has a flat weekly PMO mainly due to the wide trading range it is in. There are rising price bottoms which is good as this one follows Crude Oil and Crude does not have a rising trend like BRY. The OBV is confirming the rally and the SCTR is in the "hot zone"* above 70. Upside potential is over 20%.
*We call it the "hot zone" because it implies that the stock/ETF is in the top 30% of its "universe" (large-, mid-, small-caps and ETFs) as far as trend and condition, particularly in the intermediate and long terms.
Kemper Corp. (KMPR)
EARNINGS: 05/01/2023 (AMC)
Kemper Corp. is a holding company, which engages in the property and casualty insurance, and life and health insurance businesses. It operates through the following segments: Specialty Property and Casualty Insurance, Preferred Property and Casualty Insurance, and Life and Health Insurance. The Specialty Property and Casualty Insurance segment provides personal and commercial automobile insurance. The Preferred Property and Casualty Insurance segment sells automobile, homeowners, and other personal insurance. The Life and Health Insurance segment offers financial security for loved ones, as well as financial protection from healthcare. The company was founded in 1990 and is headquartered in Chicago, IL.
Predefined Scans Triggered: P&F Bear Trap.
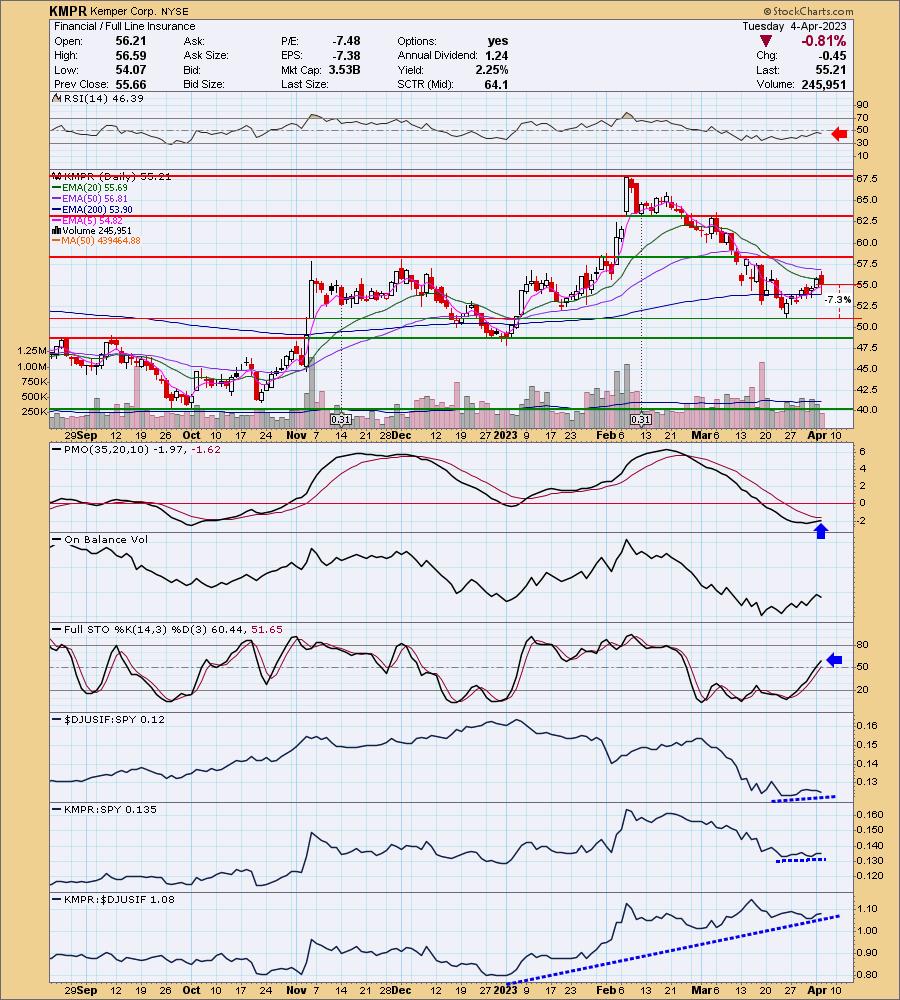
KMPR is unchanged in after hours trading. This one is just developing which is why I liked it. There weren't too many charts like this. I will say that the RSI is negative as it is below net neutral (50). Other than that, the indicators look good. The PMO is going in for a crossover BUY signal in oversold territory. Stochastics are rising in positive territory. Relative strength for the group is mostly in line with the SPY. KMPR over time has been a great relative performer within the group. It is outperforming the SPY modestly. The stop is set below support at 7.3% or $51.17.
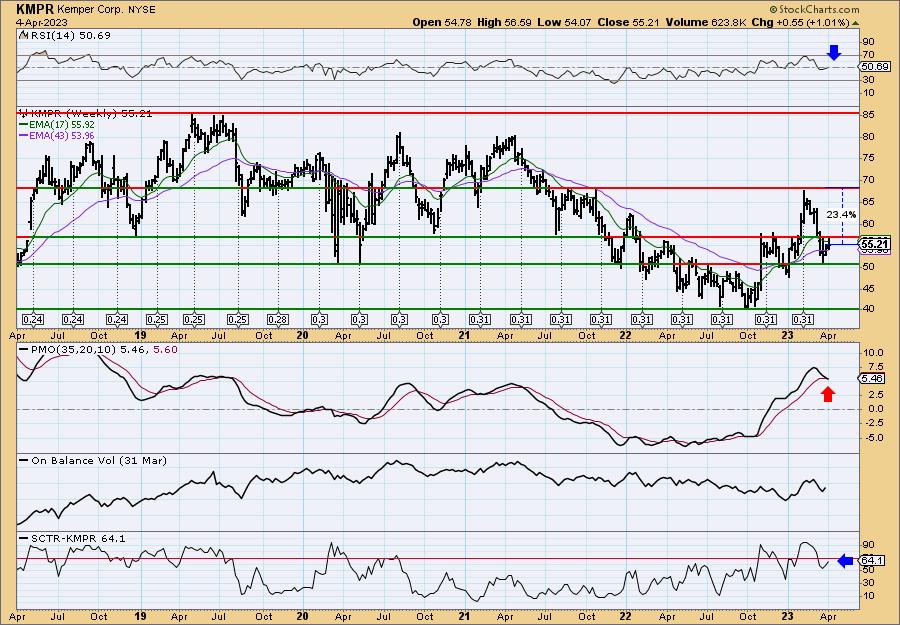
Price bounced off strong support at the 2020 lows. The weekly RSI is positive and rising. It is sitting beneath pretty strong overhead resistance and the weekly PMO has just triggered a crossover SELL. On the good side, the SCTR is rising and should be in the "hot zone" soon. Given the mixed weekly chart, consider this one a short-term trade.
Scotts Co. Cl A (SMG)
EARNINGS: 05/03/2023 (BMO)
Scotts Miracle-Gro Co. engages in the manufacturing, marketing, and sale of products for lawn and garden care and indoor and hydroponic gardening. Its products and services include lawn care, gardening and landscape, hydroponic hardware and growing environments, lighting, controls, and marketing agreement. It operates through the following segments: U.S. Consumer, Hawthorne, and Other. The U.S. Consumer and Other segments manufacture and market branded consumer lawn and garden products. The U.S. Consumer segment consists of consumer lawn and garden business in the United States. The Hawthorne segment manufactures, markets, and distributes lighting, nutrients, growing media, growing environments, and hardware products for indoor and hydroponic gardening in North America. The company was founded by Orlando McLean Scott in 1868 and is headquartered in Marysville, OH.
Predefined Scans Triggered: Bullish MACD Crossovers and P&F Double Top Breakout.
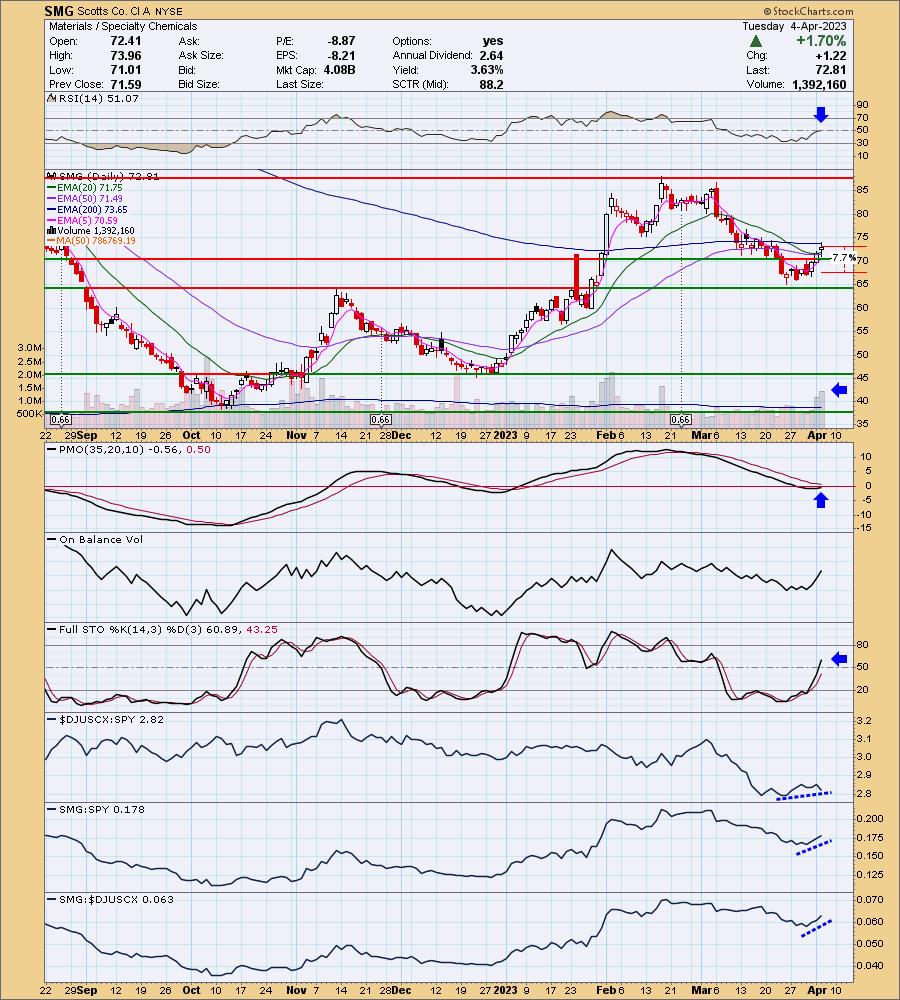
SMG is up +0.32% in after hours trading. We have a new rising trend and price has already overcome its first level of overhead resistance. Next up is the 200-day EMA. It shouldn't have a problem if the indicators are right. The RSI is now in positive territory. The PMO has turned up and should get above the zero line soon as it goes in for a crossover BUY signal. Volume is definitely coming in. Stochastics are now in positive territory. While the industry group may not be performing in stellar fashion, SMG is outperforming the group and the SPY. The stop is set halfway down the prior trading range at 7.7% or $67.20.
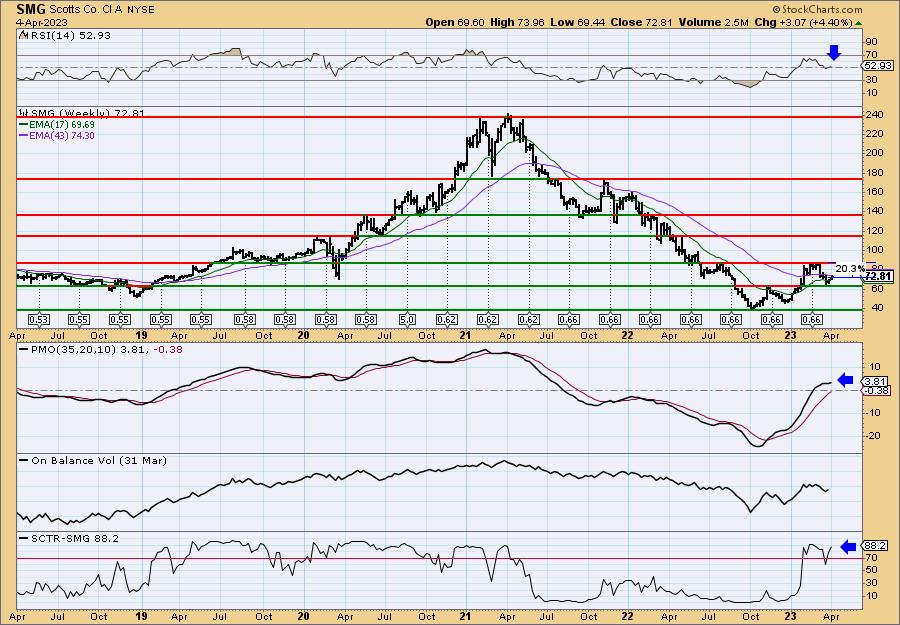
I think the weekly chart is positive enough to consider this investment more intermediate-term. The weekly RSI is rising in positive territory and the weekly PMO is turning up above its signal line which is especially bullish. The SCTR is well within the "hot zone". It also has upside potential of over 20%.
Don't forget, on Thursdays I look at reader-requested symbols, click HERE to send me an email. I read every email I receive and try to answer them all!
Current Market Outlook:
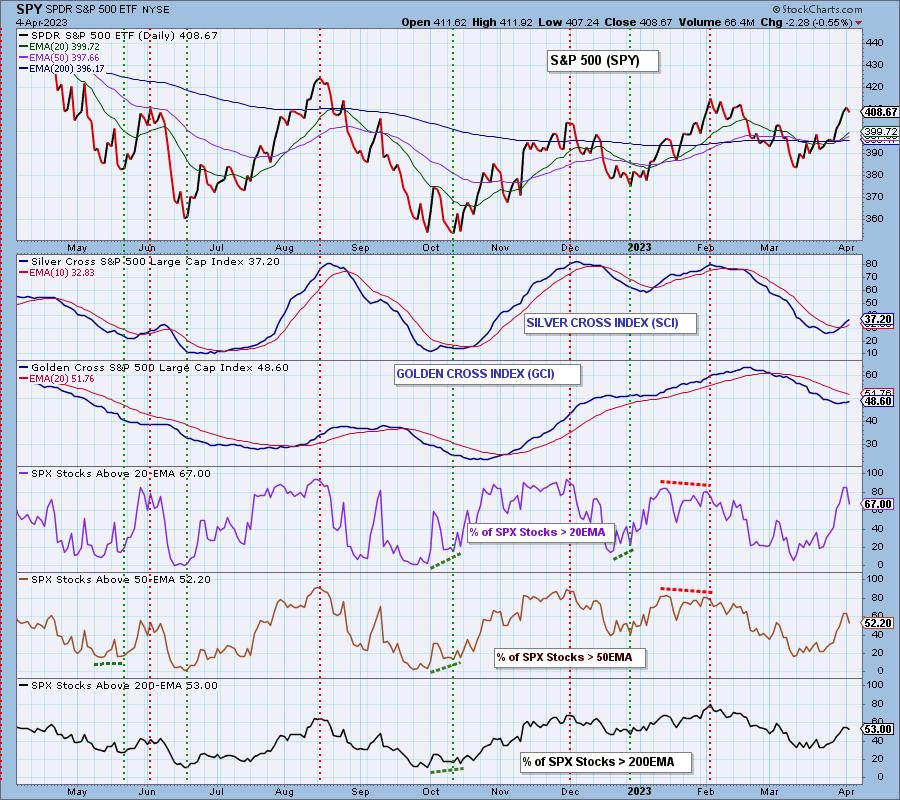
Market Environment: It is important to consider the odds for success by assessing the market tides. The following chart uses different methodologies for objectively showing the depth and trend of participation for intermediate- and long-term time frames.
- The Silver Cross Index (SCI) shows the percentage of SPX stocks on IT Trend Model BUY signals (20-EMA > 50-EMA)
- The Golden Cross Index (GCI) shows the percentage of SPX stocks on LT Trend Model BUY signals (50-EMA > 200-EMA)
Don't forget that as a "Diamonds" member, you have access to our GCI/SCI curated ChartList on DecisionPoint.com. You'll find it under "Members Only" links on the left side on the Blogs and Links Page.
Here is the current chart:
Full Disclosure: I am 28% long, 2% short.
I'm required to disclose if I currently own a stock I mention and/or may buy/short it within the next 72 hours.
"Technical Analysis is a windsock, not a crystal ball." - Carl Swenlin
(c) Copyright 2023 DecisionPoint.com
Watch the latest episode of DecisionPoint Trading Room with Carl & Erin Swenlin on Mondays 7:00p EST or on the DecisionPoint playlist on the StockCharts TV YouTube channel here!
NOTE: The stocks reported herein are from mechanical trading model scans that are based upon moving average relationships, momentum and volume. DecisionPoint analysis is then applied to get five selections from the scans. The selections given should prompt readers to do a chart review using their own analysis process. This letter is not a call for a specific action to buy, sell or short any of the stocks provided. There are NO sure things or guaranteed returns on the daily selection of "Diamonds in the Rough."
Regarding BUY/SELL Signals: The signal status reported herein is based upon mechanical trading model signals and crossovers. They define the implied bias of the price index/stock based upon moving average relationships and momentum, but they do not necessarily call for a specific action. They are information flags that should prompt chart review. Further, they do not call for continuous buying or selling during the life of the signal. For example, a BUY signal will probably (but not necessarily) return the best results if action is taken soon after the signal is generated. Additional opportunities for buying may be found as price zigzags higher, but the trader must look for optimum entry points. Conversely, exit points to preserve gains (or minimize losses) may be evident before the model mechanically closes the signal.
Helpful DecisionPoint Links:
DecisionPoint Shared ChartList and DecisionPoint Chart Gallery
Price Momentum Oscillator (PMO)
Swenlin Trading Oscillators (STO-B and STO-V)
For more links, go to DecisionPoint.com