
So far our expectation of a continued market decline is coming true. This puts us in a unique position with "Diamonds in the Rough". Do we simply go short or do we look for pockets of strength? For now, I'm looking for pockets of strength and today I found at least one.
The Gold Miners (GDX) have been reigniting as the market weakens which tells me this is a pocket of strength that can be exploited. Participation looks good beneath the surface (read the latest analysis in tonight's DP Alert).
I had a limited amount of requests today so I ended up adding one on my own from the Momentum Sleepers Scan. It is in the defensive Healthcare sector. I also added a request from an interesting industry group that had paused relative strength, but is picking up currently, Software. Biotechs are holding up and I have a request from that group too.
Since it's Reader Request Day, I'm including a few of the scan result symbols I liked today.
Don't forget to sign up for tomorrow's Diamond Mine trading room!
Good Luck & Good Trading,
Erin
Today's "Diamonds in the Rough": DT, EGO, RCEL and STRO.
Other requests: DRV, BFAM, MUX, OTTR and PACB.
Surge Scan: KEP and SNOW
Momentum Sleepers Scan: AGI and FNV.
** JULY VACATION **
I will be in Europe 7/14 - 7/27 so there will not be any Diamonds reports or trading rooms during that time. All subscribers with active subscriptions on 7/27 will be compensated with two weeks added to their renewal date.

RECORDING LINK (4/28/2023):
Topic: DecisionPoint Diamond Mine (4/28/2023) LIVE Trading Room
Passcode: April#28
REGISTRATION for 5/5/2023:
When: May 5, 2023 09:00 AM Pacific Time (US and Canada)
Topic: DecisionPoint Diamond Mine (5/5/2023) LIVE Trading Room
Register in advance for this webinar HERE
After registering, you will receive a confirmation email containing information about joining the webinar.

Here is the last recording (5/1):
Welcome to DecisionPoint Diamonds, wherein I highlight ten "Diamonds in the Rough" per week. These are selected from the results of my DecisionPoint Scans which search for stocks that could benefit from the trend and condition of the market. Remember, these are not recommendations to buy or sell, but are the most interesting of the stocks that surfaced in my scans. My objective is to save you the work of the initial, tedious culling process, but you need to apply your own analysis to see if these stocks pique your interest as well. There are no guaranteed winners here!
"Predefined Scans Triggered" are taken from StockCharts.com using the "Symbol Summary" option instead of a "SharpChart" on the workbench.
Stop levels are all rounded down.
Dynatrace Inc. (DT)
EARNINGS: 05/17/2023 (BMO)
Dynatrace, Inc. engages in the development of a software intelligence platform, purpose-built for the enterprise cloud. The firm's platform utilizes artificial intelligence at its core and advanced automation to provide answers, not just data, about the performance of applications, the underlying hybrid cloud infrastructure, and the experience of the customers' users. It specializes in cloud ecosystem integration, incident and alert management integration, DevOps CI/CD integration, user experience and business intelligence insights. The company was founded in 2005 and is headquartered in Waltham, MA.
Predefined Scans Triggered: New CCI Buy Signals, Moved Above Upper Bollinger Band, Moved Above Upper Price Channel and Parabolic SAR Buy Signals.
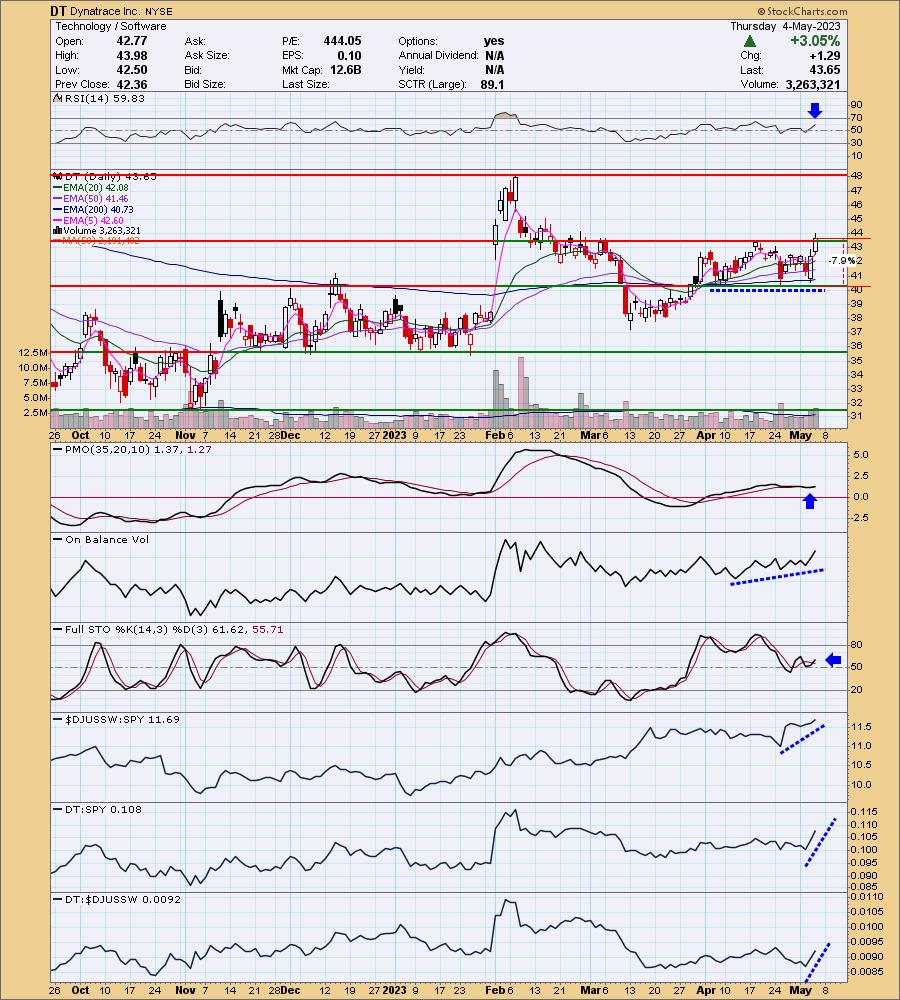
DT is up +0.80% in after hours trading. Today it had a strong breakout above resistance. It also saw a PMO Crossover BUY signal. The RSI is positive and the OBV has a positive divergence with price lows. Stochastics have stayed in mostly positive territory even with two earlier declines. They are rising now. Relative strength for this area of the market is beginning to increase again. The group never really suffered that much. DT is showing excellent strength against the SPY and the group. The stop is set below support at 7.9% or $40.20.
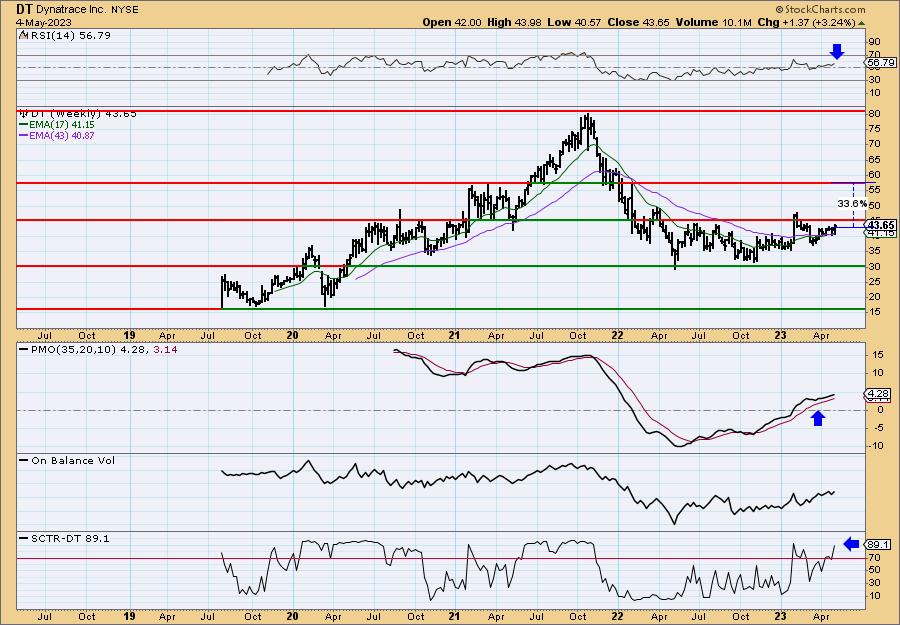
The weekly chart shows us that price is still stuck in a trading range, but the last low didn't move all the way down to the bottom. That suggests internal strength. The weekly RSI is positive and the weekly PMO is rising on an oversold BUY Signal. The SCTR is in the "hot zone"* above 70. If it can break through resistance, upside potential is over 33%.
*If a stock is in the "hot zone" above 70, it implies that it is stronger than 70% of its universe (large-, mid-, small-caps and ETFs) primarily in the intermediate to long terms.
Eldorado Gold Corp. (EGO)
EARNINGS: 07/27/2023 (AMC)
Eldorado Gold Corp. engages in the mining, development, and exploration of gold. It operates through the following segment: Turkey, Canada, and Greece. The company was founded by Richard J. Barclay, Marco Antonio Romero, and Gary D. Nordin on April 2, 1992 and is headquartered in Vancouver, Canada.
Predefined Scans Triggered: Moved Above Upper Keltner Channel and P&F Low Pole.
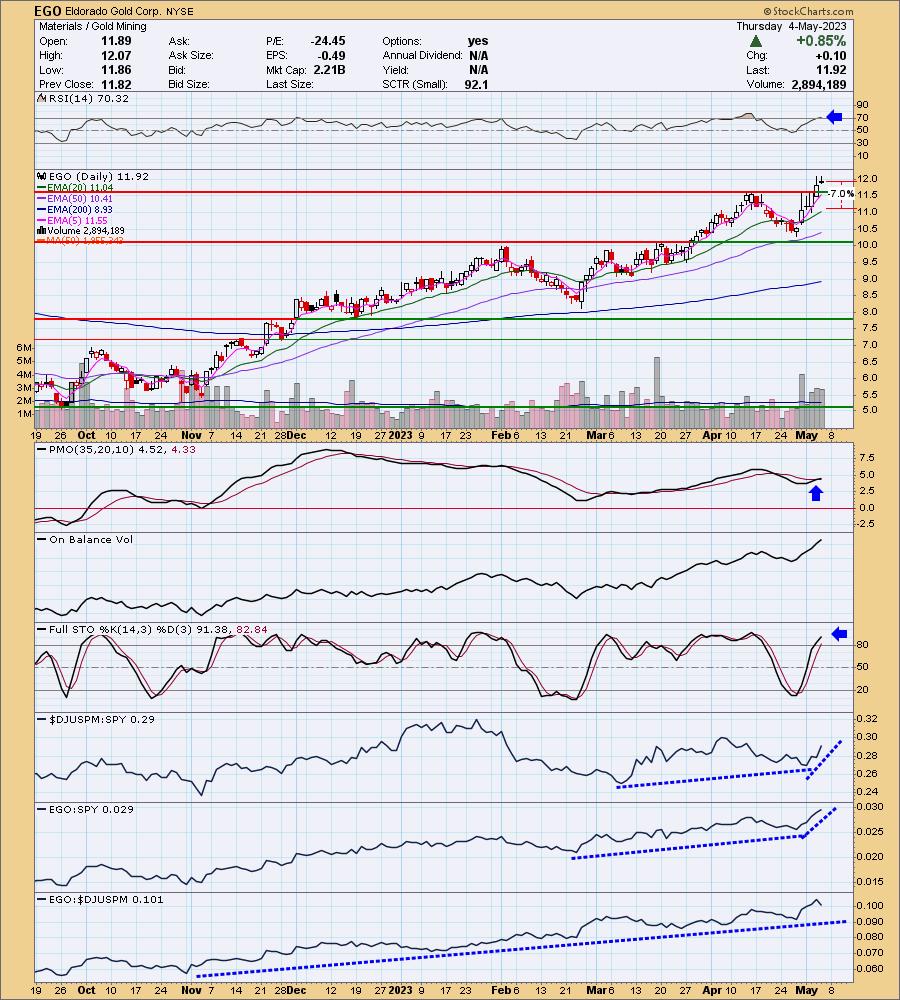
EGO is up +1.51% in after hours trading. Price has broken out where it hasn't broken out on Gold Miners (GDX) and many of the Gold Mining stocks. This put it in the forefront for me. The RSI is overbought, but on a good rally run, it will remain so. There is a recent PMO Crossover BUY Signal and Stochastics are above 80. Volume is pouring in. The stop is set at the 20-day EMA at about 7% or $11.08.
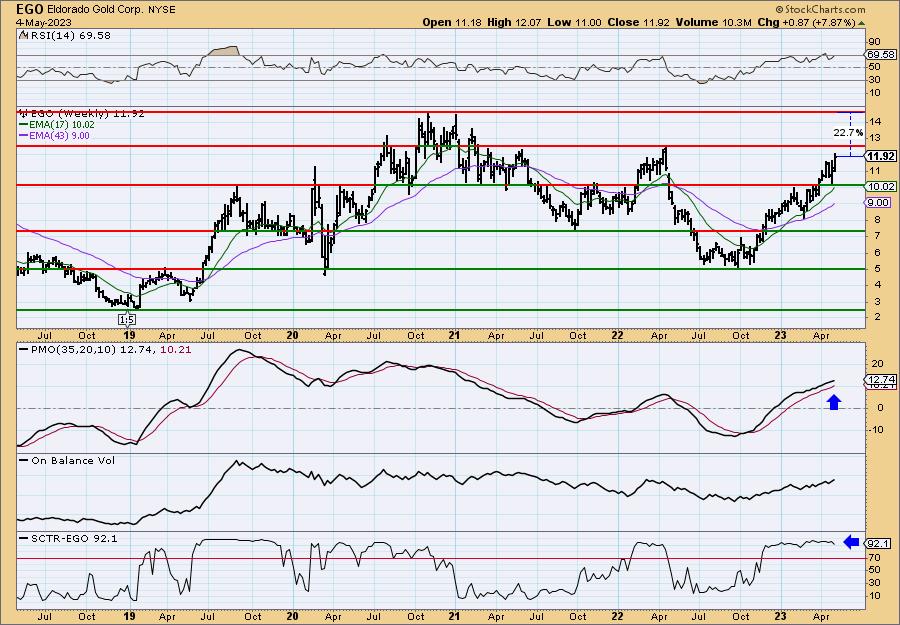
The weekly chart is very strong and shows us there is still plenty of upside potential even though it is near all-time highs. The weekly RSI is positive and not quite overbought. The weekly PMO continues to rise and is also not overbought. The SCTR is well within the hot zone. Upside target is 22.7%.
Avita Medical Ltd. (RCEL)
EARNINGS: 05/11/2023 (AMC)
AVITA Medical, Inc., through its subsidiaries, engages in the development and commercialization of a technology platform that enables point-of-care autologous skin restoration for multiple unmet needs. Its product, RECELL system, is a device that enables healthcare professionals to produce a suspension of spray-on skin cells using a small sample of the patient's own skin for the treatment of acute thermal burns. The company was founded in December 1992 and is headquartered in Valencia, CA.
Predefined Scans Triggered: P&F Ascending Triple Top Breakout and P&F Double Top Breakout.
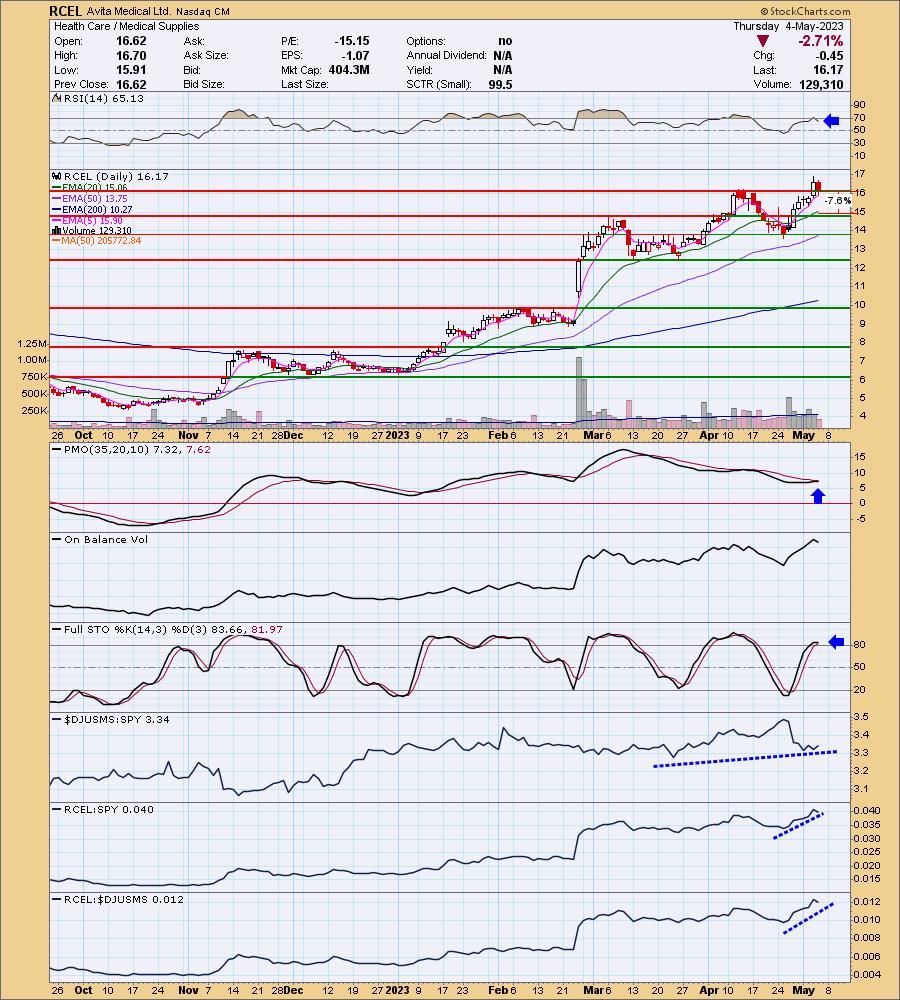
RCEL is up +1.98% in after hours trading. I love that today price pulled back to support after a strong breakout. It is the pause that was necessary so it could resume its rally. The RSI moved back into positive territory out of overbought territory. The PMO is nearing a Crossover BUY Signal. Volume is strong and today's selling looked like profit taking on low volume. Stochastics are above 80 and relative strength for RCEL is excellent. The stop is set around 7.6% below the 20-day EMA or $14.94.
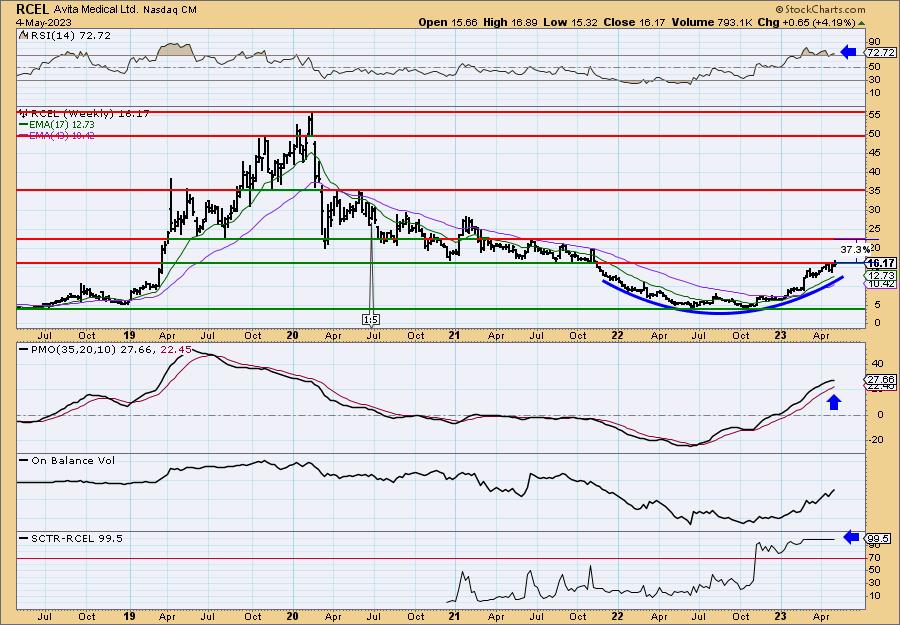
There is a large cup-shaped basing pattern on the weekly chart. The weekly RSI is overbought, but not exceedingly so. The weekly PMO did decelerate, but is ultimately rising and not overbought. The SCTR is at the very top of the hot zone. Upside potential is over 37%.
Sutro Biopharma Inc. (STRO)
EARNINGS: 05/15/2023 (AMC)
Sutro Biopharma Inc. engages in the drug discovery, development and manufacture of pharmaceutical products. It focuses on the next generation cancer and autoimmune therapeutics. The company was founded by James R. Swartz and Sutanto Widjaja on April 21, 2003 and is headquartered in South San Francisco, CA.
Predefined Scans Triggered: Entered Ichimoku Cloud.
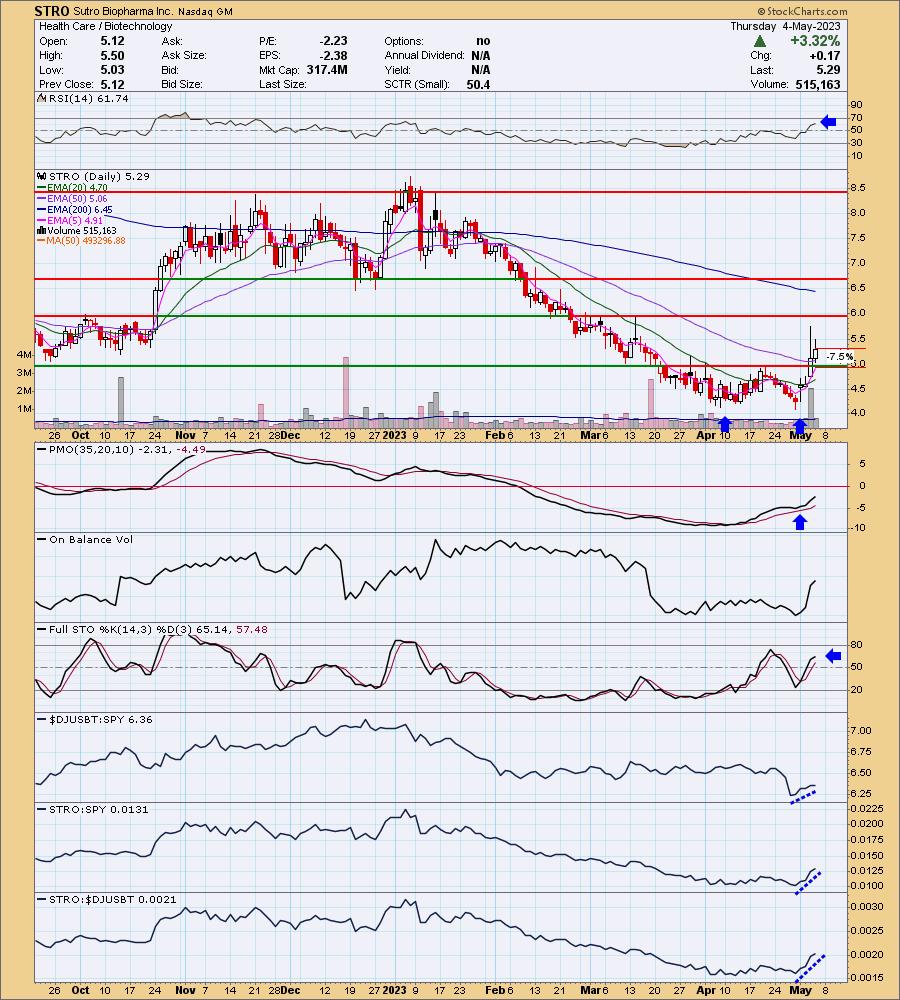
STRO is down -0.57% in after hours trading. I would've liked this one a bit better on a pullback like RCEL because I expect we could see some profit taking. Any decline would offer a nice entry as long as it stays above new support. There is a double-bottom pattern that has been confirmed so we should expect the minimum upside target to be reached at $6.00. The indicators suggest it could move higher than that. The RSI is positive and the PMO has surged above its signal line (bottom above the signal line). Volume is coming in and Stochastics are rising in positive territory. Relative strength is also picking up. The stop is set beneath the confirmation line of the double-bottom pattern at 7.5% or $4.89.
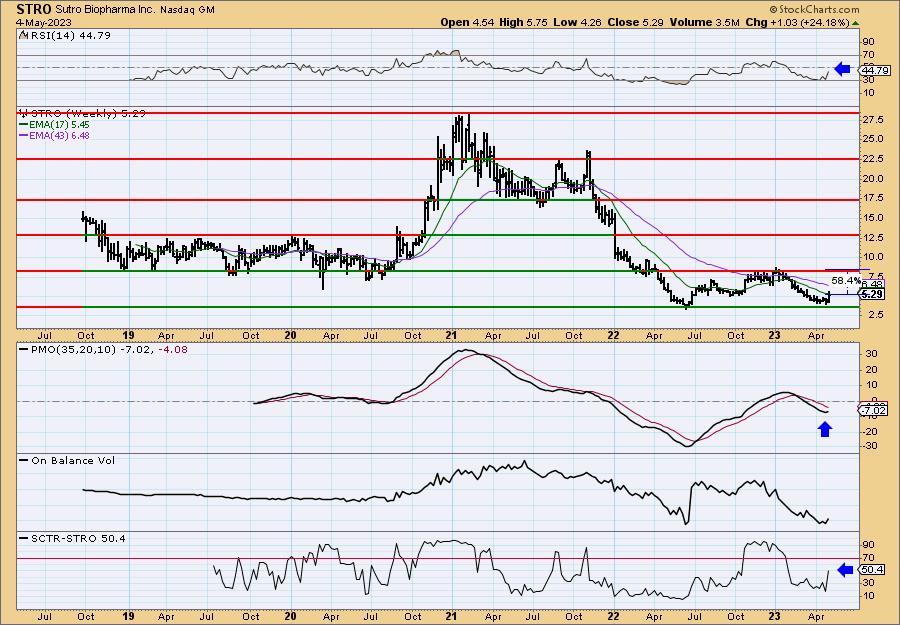
Price has been in a trading range. That works out right now because it is at the bottom of the range and a trip to the top would be an over 58% gain. The weekly RSI is negative, but rising. The weekly PMO just turned up. The SCTR is rising vertically and should hit the hot zone soon.
Don't forget, on Thursdays I look at reader-requested symbols, click HERE to send me an email. I read every email I receive and try to answer them all!
Current Market Outlook:
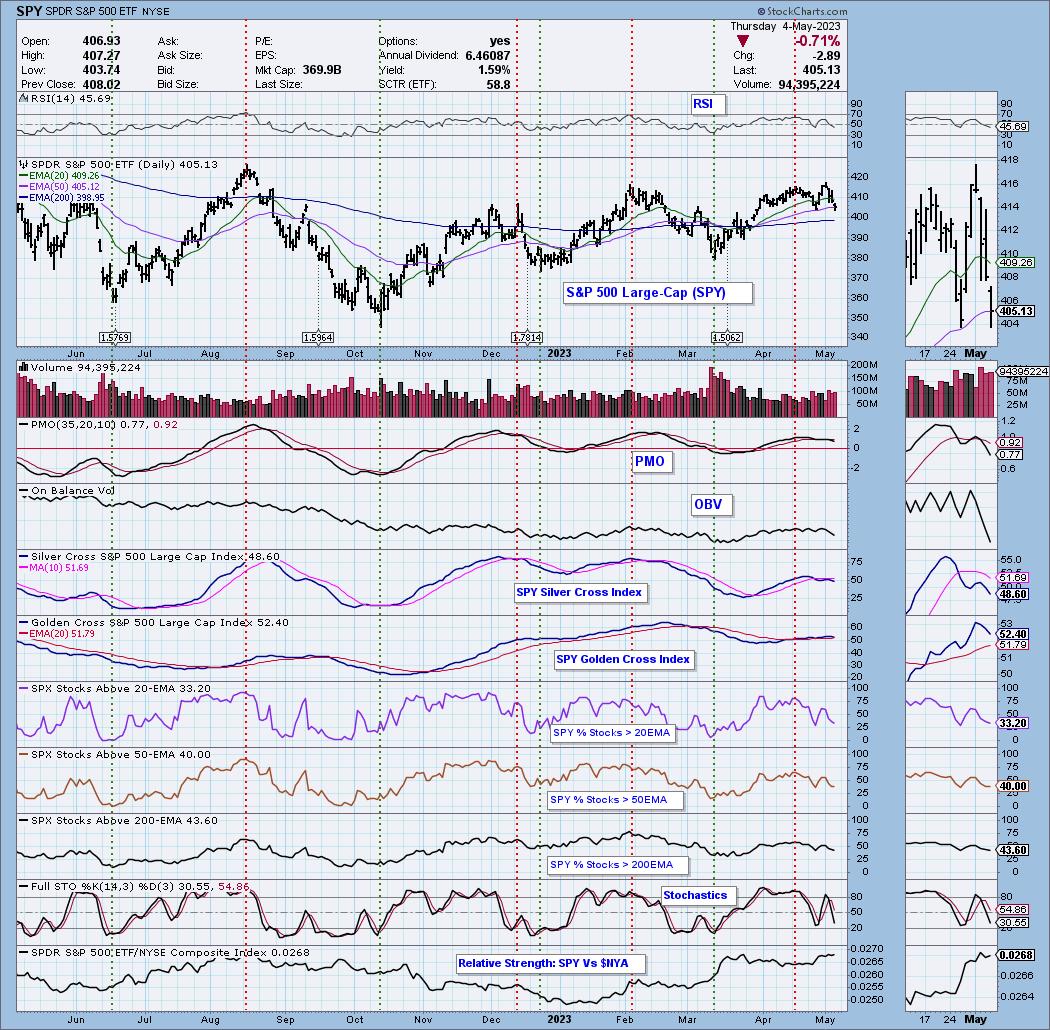
Market Environment: It is important to consider the odds for success by assessing the market tides. The following chart uses different methodologies for objectively showing the depth and trend of participation for intermediate- and long-term time frames.
- The Silver Cross Index (SCI) shows the percentage of SPX stocks on IT Trend Model BUY signals (20-EMA > 50-EMA)
- The Golden Cross Index (GCI) shows the percentage of SPX stocks on LT Trend Model BUY signals (50-EMA > 200-EMA)
Don't forget that as a "Diamonds" member, you have access to our GCI/SCI curated ChartList on DecisionPoint.com. You'll find it under "Members Only" links on the left side on the Blogs and Links Page.
Here is the current chart:
Full Disclosure: I am 18% long, 7% short.
I'm required to disclose if I currently own a stock I mention and/or may buy/short it within the next 72 hours.
"Technical Analysis is a windsock, not a crystal ball." - Carl Swenlin
(c) Copyright 2023 DecisionPoint.com
Watch the latest episode of DecisionPoint Trading Room with Carl & Erin Swenlin on Mondays 7:00p EST or on the DecisionPoint playlist on the StockCharts TV YouTube channel here!
NOTE: The stocks reported herein are from mechanical trading model scans that are based upon moving average relationships, momentum and volume. DecisionPoint analysis is then applied to get five selections from the scans. The selections given should prompt readers to do a chart review using their own analysis process. This letter is not a call for a specific action to buy, sell or short any of the stocks provided. There are NO sure things or guaranteed returns on the daily selection of "Diamonds in the Rough."
Regarding BUY/SELL Signals: The signal status reported herein is based upon mechanical trading model signals and crossovers. They define the implied bias of the price index/stock based upon moving average relationships and momentum, but they do not necessarily call for a specific action. They are information flags that should prompt chart review. Further, they do not call for continuous buying or selling during the life of the signal. For example, a BUY signal will probably (but not necessarily) return the best results if action is taken soon after the signal is generated. Additional opportunities for buying may be found as price zigzags higher, but the trader must look for optimum entry points. Conversely, exit points to preserve gains (or minimize losses) may be evident before the model mechanically closes the signal.
Helpful DecisionPoint Links:
DecisionPoint Shared ChartList and DecisionPoint Chart Gallery
Price Momentum Oscillator (PMO)
Swenlin Trading Oscillators (STO-B and STO-V)
For more links, go to DecisionPoint.com