
I really enjoy Reader Request Day because I get to zero in on what you are looking or find interesting currently in the market. Today I was presented with a small group of stocks. Two of them have names you'll recognize. I only opted to present one of the two, but both admittedly look quite good.
The one I'm not covering is Alphabet - Class C (GOOG). The chart does look bullish, but today's gap up move has me nervous about a reverse island formation. That would imply a gap down soon.
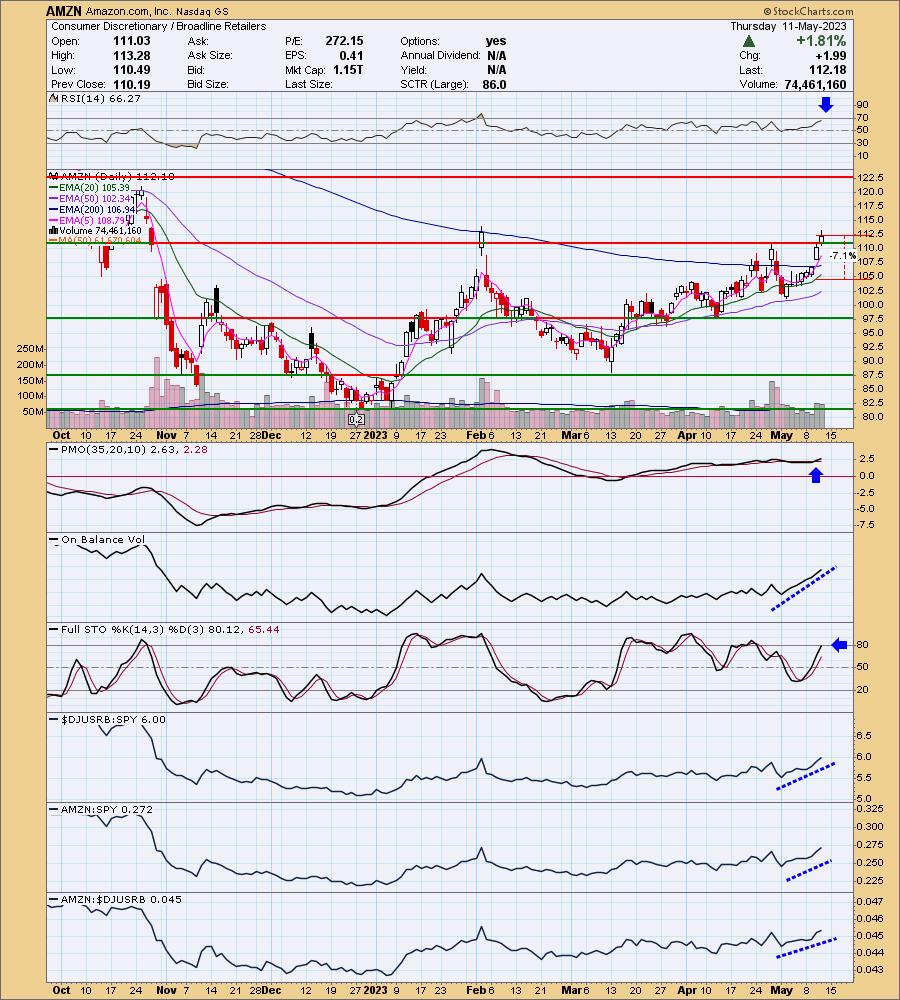
Amazon (AMZN) is the one I'm covering. I've been skeptical about Amazon primarily because I had heard they were conducting layoffs not too long ago. The chart looks very good right now. Being a mega-cap stock could hurt it in what Carl and I believe will be a nasty market decline, but for now, the chart has merit.
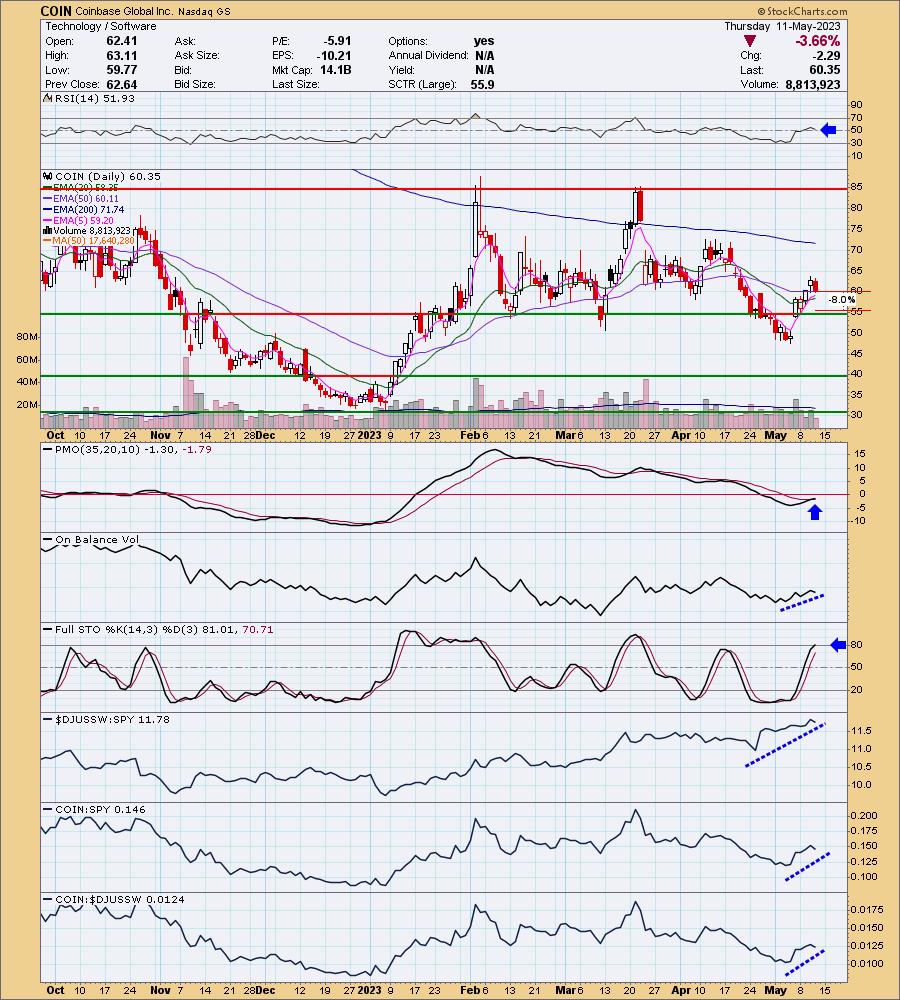
The next one I'm covering is Coinbase Global (COIN). I covered this one at the end of March, but it was requested again and I liked the chart. Just know this one is highly volatile so while the upside potential is massive, downside potential could have you getting stopped out quickly.
The next stock is a Canadian company, Standard Lithium Ltd (SLI.V). I don't usually get requests from our Canadian friends. I'm presenting it because the chart is positive, but I'm glad I can get some coverage in for our Canadian subscribers.
The final stock is from our "Sector to Watch", Real Estate. Welltower (WELL) saw a PMO "surge" this week and appears ready to breakout of a trading range.
Don't forget to sign up to attend tomorrow's Diamond Mine trading room! Bring your symbol requests and readiness for some good conversation in the chat room. Registration information is below the Diamonds logo.
Good Luck & Good Trading,
Erin
Today's "Diamonds in the Rough": AON, HWM and MHO.
Runner-ups: SGML, LSI, GWRE, ARMK and CRWD.
** JULY VACATION **
I will be in Europe 7/14 - 7/27 so there will not be any Diamonds reports or trading rooms during that time. All subscribers with active subscriptions on 7/27 will be compensated with two weeks added to their renewal date.

RECORDING LINK (5/5/2023):
Topic: DecisionPoint Diamond Mine (5/5/2023) LIVE Trading Room
Passcode: May##5th
REGISTRATION for 5/12/2023:
When: May 12, 2023 09:00 AM Pacific Time (US and Canada)
Topic: DecisionPoint Diamond Mine (5/12/2023) LIVE Trading Room
Register in advance for this webinar HERE
After registering, you will receive a confirmation email containing information about joining the webinar.

Here is the last recording (5/8):
Welcome to DecisionPoint Diamonds, wherein I highlight ten "Diamonds in the Rough" per week. These are selected from the results of my DecisionPoint Scans which search for stocks that could benefit from the trend and condition of the market. Remember, these are not recommendations to buy or sell, but are the most interesting of the stocks that surfaced in my scans. My objective is to save you the work of the initial, tedious culling process, but you need to apply your own analysis to see if these stocks pique your interest as well. There are no guaranteed winners here!
"Predefined Scans Triggered" are taken from StockCharts.com using the "Symbol Summary" option instead of a "SharpChart" on the workbench.
Stop levels are all rounded down.
Amazon.com, Inc. (AMZN)
EARNINGS: 07/27/2023 (AMC)
Amazon.com, Inc. is a multinational technology company, which engages in the provision of online retail shopping services. It operates through the following segments: North America, International, and Amazon Web Services (AWS). The North America segment is involved in the retail sales of consumer products including from sellers and subscriptions through North America-focused online and physical stores. It also includes export sales from online stores. The International segment focuses on the amounts earned from retail sales of consumer products including from sellers and subscriptions through internationally-focused online stores. The AWS segment consists of global sales of compute, storage, database, and other services for start-ups, enterprises, government agencies, and academic institutions. The company was founded by Jeffrey P. Bezos in July 1994 and is headquartered in Seattle, WA.
Predefined Scans Triggered: Moved Above Upper Keltner Channel, Stocks in a New Uptrend (Aroon), Moved Above Upper Price Channel, P&F Ascending Triple Top Breakout and P&F Double Top Breakout.
AMZN is up +0.08% in after hours trading. I am considering today to be a breakout move. It technically didn't get above the February top, but I consider that an outlier. This breakout occurred with a break above both the April high and gap resistance from late October. The RSI is positive and amazingly isn't overbought after its rally all month long. The PMO is putting margin between it and the signal line while on a BUY signal. The OBV is confirming both the breakout and the rising trend. It's confirming the breakout because it is rising above its February high too. Stochastics are now above 80 and relative strength is rising across the board. The stop is set at 7.1% below the 20-day EMA and halfway down the previous trading range or $104.21.
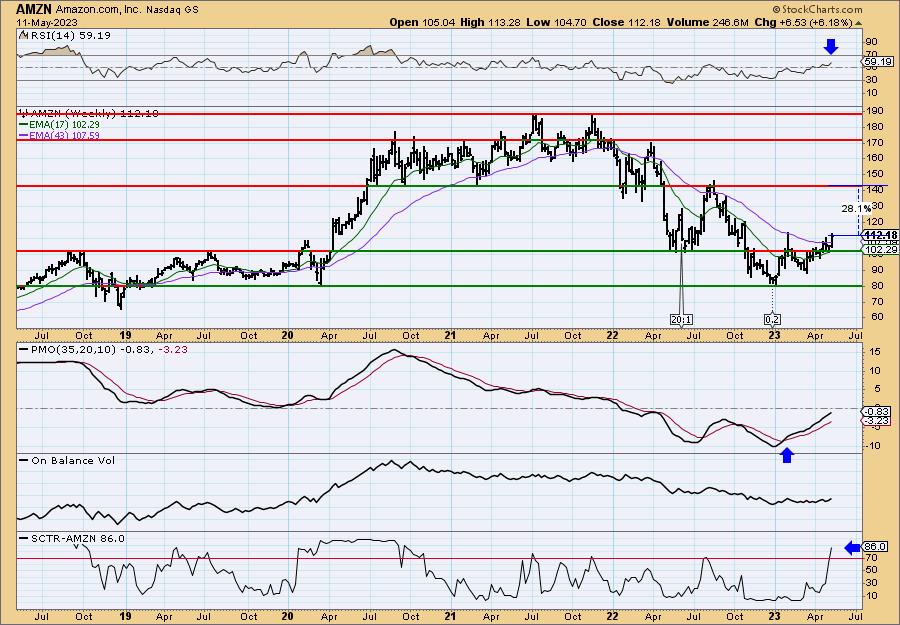
The weekly chart is quite favorable. There is a double-bottom pattern that will be confirmed on a break above the intraday high from February. I like its chances. The weekly RSI is positive and the weekly PMO is rising on a Crossover BUY Signal. The SCTR has shot up into the "hot zone" above 70*. Upside potential is excellent at about 28%.
*If a stock is in the "hot zone" above 70, it implies that it is stronger than 70% of its universe (large-, mid-, small-caps and ETFs) primarily in the intermediate to long terms.
Coinbase Global Inc. (COIN)
EARNINGS: 08/08/2023 (AMC)
Coinbase Global, Inc. engages in technology and financial infrastructure products and services. It offers crypto-powered technologies including self-custody wallets, decentralized apps and services, and open community engagement platforms. The company was founded by Brian Armstrong in 2012 and is headquartered in San Francisco, CA.
Predefined Scans Triggered: Ichimoku Cloud Turned Red.
COIN is up +0.56% in after hours trading. Price previously dropped out of its intermediate-term price trend and promptly rebounded back into it. It had a bad day but did avoid forming a bearish engulfing candlestick. Price pulled back to the 50-day EMA and closed above it. This seems a good place for another move higher. The RSI did fall on today's deep decline, but it remains in positive territory. There is a new PMO Crossover BUY Signal and the OBV is rising with price in confirmation. Stochastics are now above 80 and relative strength is increasing for the group and the stock. I would like to set the stop deeper, but 8% is generally the top of my stop range. This stop is at that 8% or $55.52.
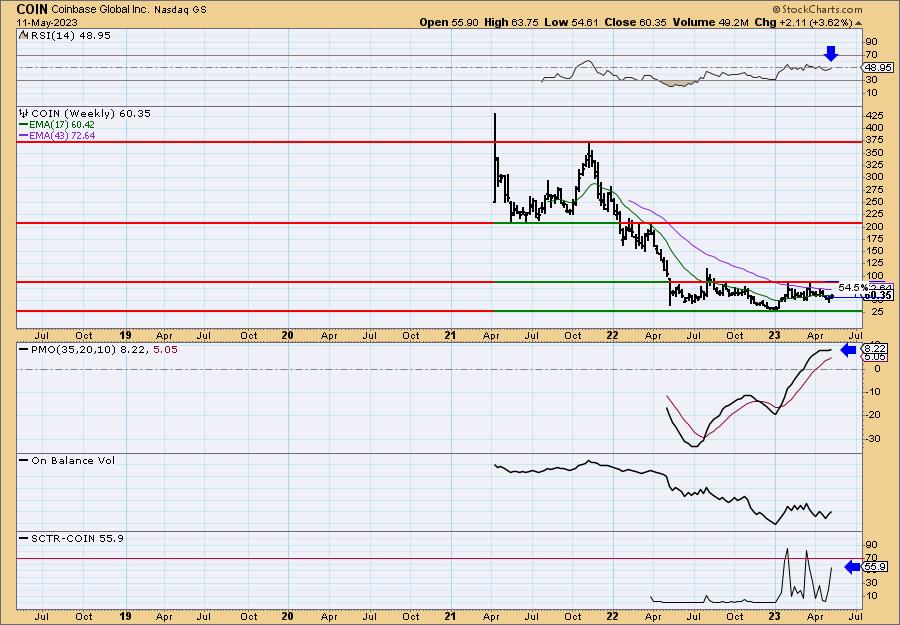
The long-term trading range is solid and price is in the middle of it. The weekly RSI is rising and should move into positive territory shortly. The SCTR isn't in the hot zone, but it is rising vertically and get very close. Upside potential if it gets to the top of the long-term trading range is over 50%.
Standard Lithium Ltd. (SLI.V)
EARNINGS: N/A
Standard Lithium Ltd. engages in the testing and proving of the commercial viability of lithium extraction. Its projects include Arkansas Lithium, Lithium Brine Processing, and California Lithium. The company was founded by Alvaro Anthony on August 14, 1998 and is headquartered in Vancouver, Canada.
Predefined Scans Triggered: Filled Black Candles and Hanging Man.
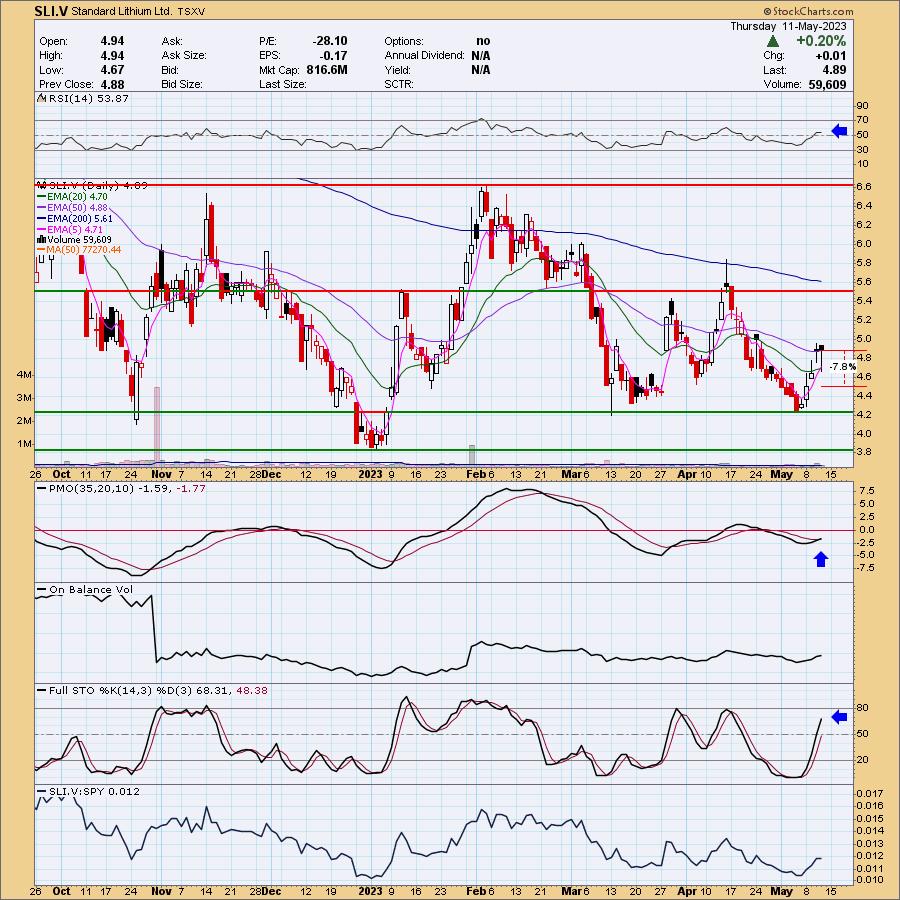
SLI.V doesn't trade after hours. I see a complex bullish double-bottom developing. It won't be confirmed until it rises past 5.80. It is looking good given the RSI is positive and there is a new PMO Crossover BUY Signal. Stochastics are rising strongly and it is outperforming the SPY. There is a filled black candlestick which implies a decline tomorrow, but given the strong indicators, I expect this rising trend to hold up. The stop is set at 7.8%, below the early April low or 4.50.
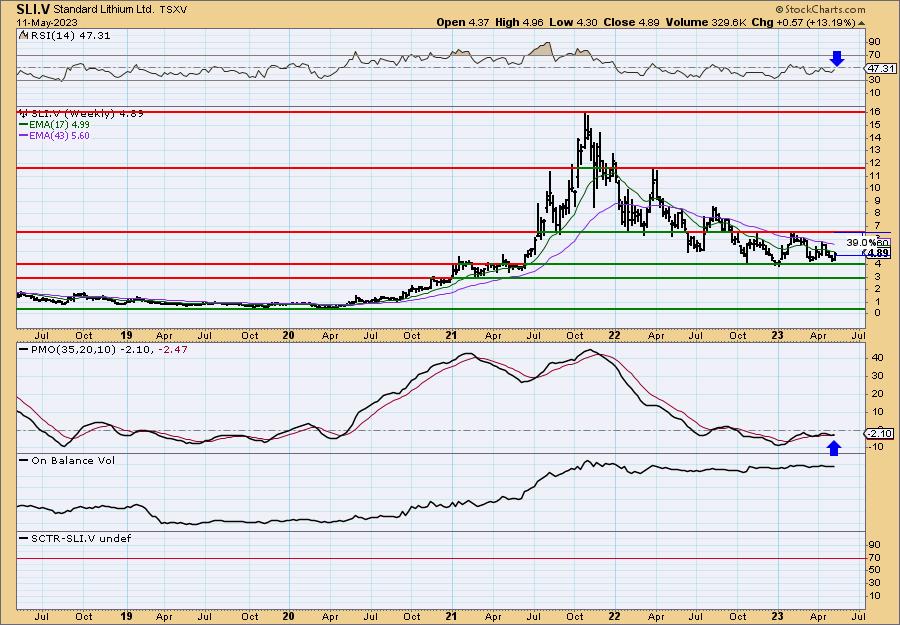
Price is in a long-term trading range with price currently about a third of the way up. The weekly RSI is negative but rising. I see a weekly PMO surge (bottom above the signal line) which suggests a possible rise to the top of the range. Upside potential is about 39%.
Welltower Inc. (WELL)
EARNINGS: 08/01/2023 (AMC)
Welltower, Inc. engages in the provision of health care infrastructure and investment of seniors housing operators, post-acute providers, and health systems. It operates through the following segments: Seniors Housing Operating, Triple-net, and Outpatient Medical. The Seniors Housing Operating segment includes the seniors housing communities. The Triple-net segment offers long-term/post-acute care facilities, assisted living facilities, independent living/continuing care retirement communities, care homes (United Kingdom), independent support living facilities (Canada), care homes with nursing (United Kingdom), and combinations thereof. The Outpatient Medical segment provides outpatient medical buildings. The company was founded in 1970 and is headquartered in Toledo, OH.
Predefined Scans Triggered: Hollow Red Candles.
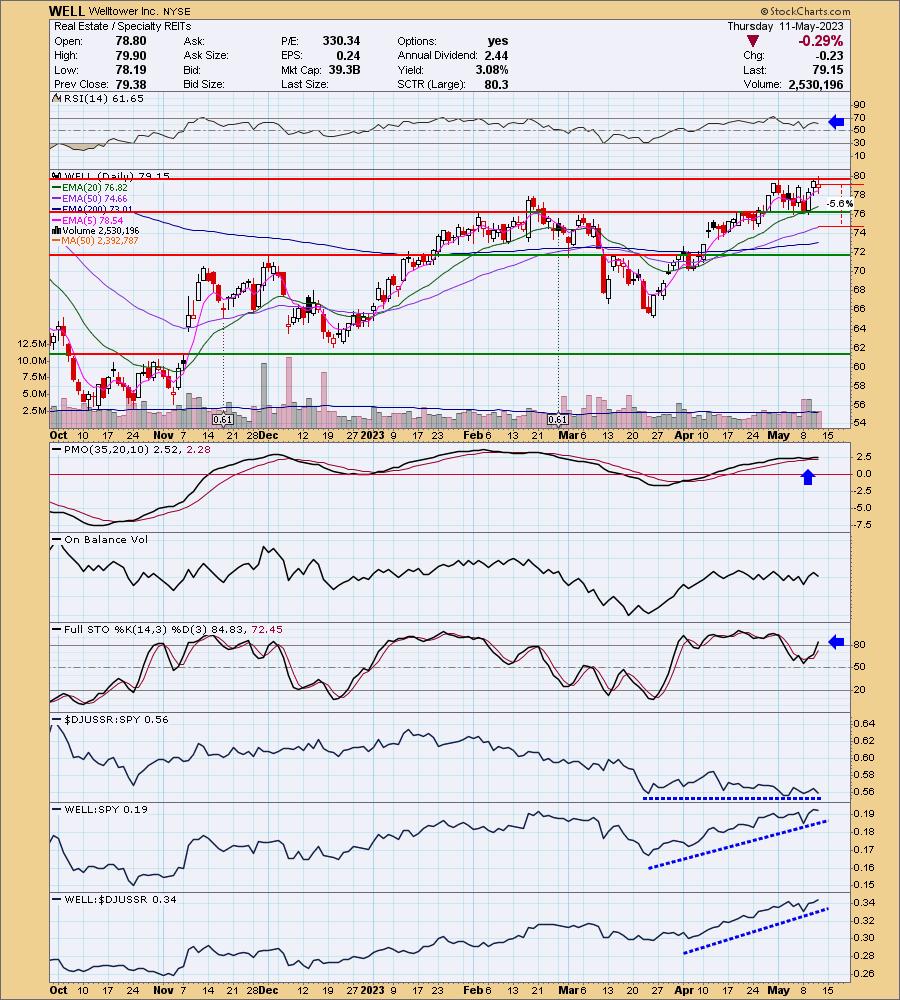
WELL is down -0.35% in after hours trading. Price is trapped in a trading range currently, but the indicators are lined up bullishly and I like that the stop doesn't need to be deep. The RSI is positive. The PMO surged above the signal line earlier which suggests a breakout ahead. Stochastics reversed in positive territory and are now above 80. The OBV is flat unfortunately, along with relative strength for the group. However, WELL is easily outperforming both the group and the SPY. The stop is set at the 50-day EMA at 5.6% or $74.71.
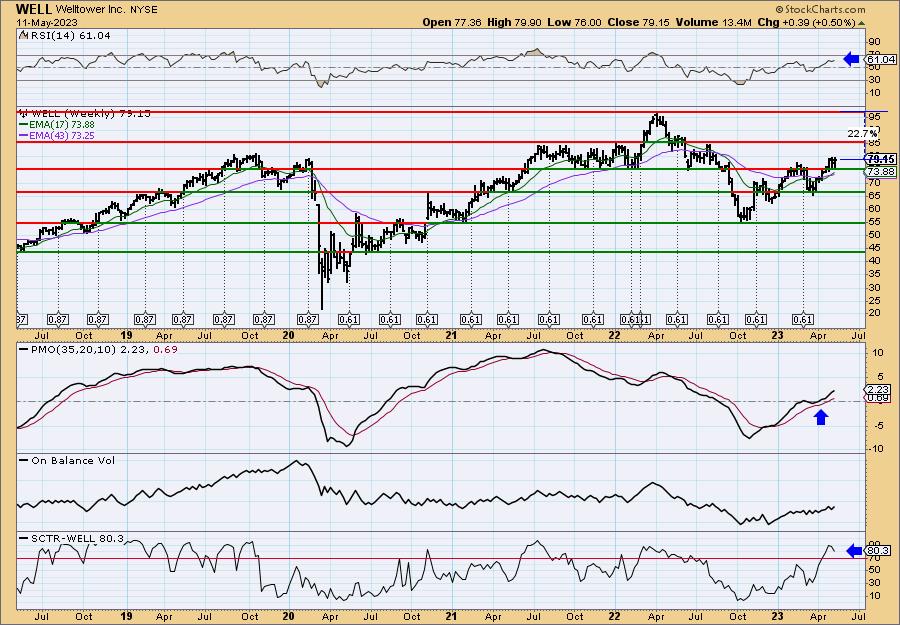
The weekly chart shows a positive weekly RSI and a SCTR in the hot zone. Best would be the weekly PMO surge above the signal line earlier this year. The OBV is rising in concert with price. Upside potential if it reaches the 2022 high is over 22%.
Don't forget, on Thursdays I look at reader-requested symbols, click HERE to send me an email. I read every email I receive and try to answer them all!
Current Market Outlook:
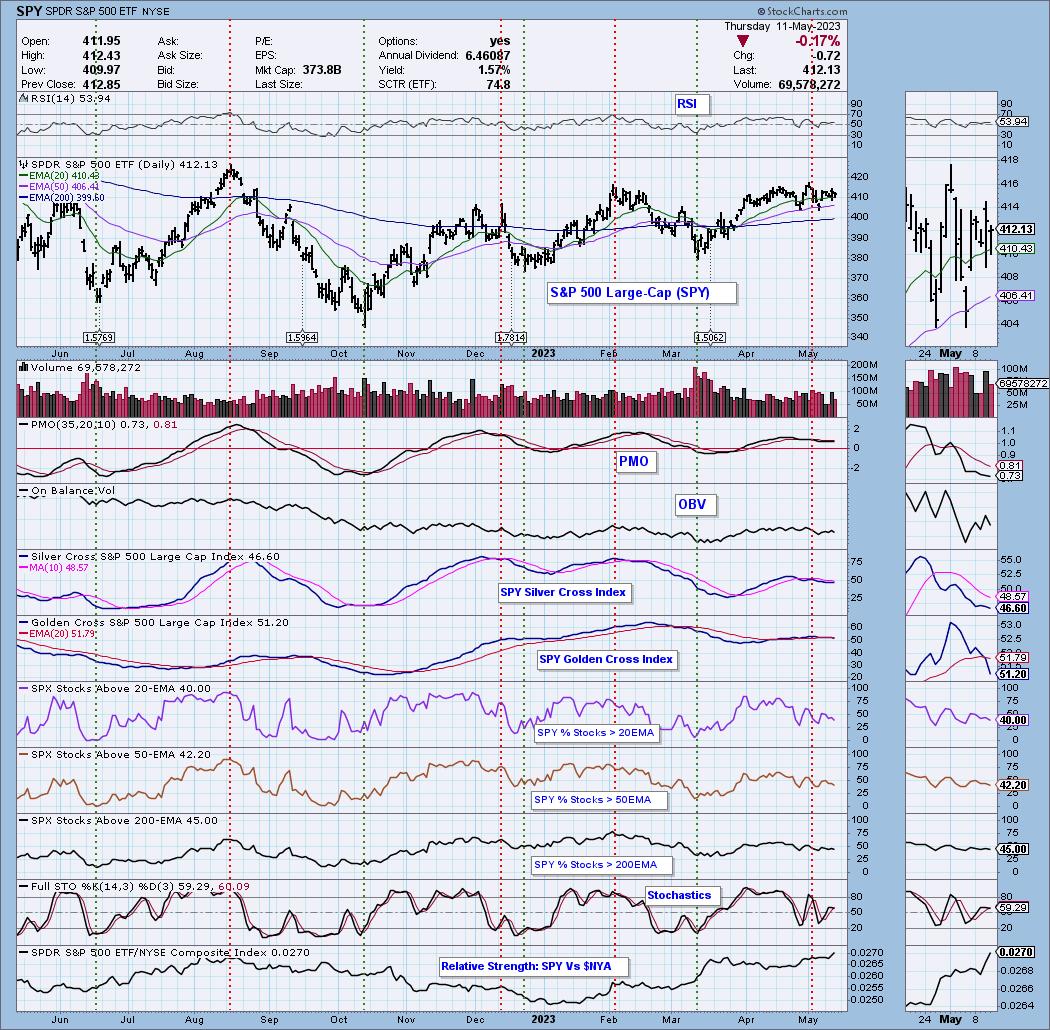
Market Environment: It is important to consider the odds for success by assessing the market tides. The following chart uses different methodologies for objectively showing the depth and trend of participation for intermediate- and long-term time frames.
- The Silver Cross Index (SCI) shows the percentage of SPX stocks on IT Trend Model BUY signals (20-EMA > 50-EMA)
- The Golden Cross Index (GCI) shows the percentage of SPX stocks on LT Trend Model BUY signals (50-EMA > 200-EMA)
Don't forget that as a "Diamonds" member, you have access to our GCI/SCI curated ChartList on DecisionPoint.com. You'll find it under "Members Only" links on the left side on the Blogs and Links Page.
Here is the current chart:
Full Disclosure: I am 18% long, 7% short.
I'm required to disclose if I currently own a stock I mention and/or may buy/short it within the next 72 hours.
"Technical Analysis is a windsock, not a crystal ball." - Carl Swenlin
(c) Copyright 2023 DecisionPoint.com
Watch the latest episode of DecisionPoint Trading Room with Carl & Erin Swenlin on Mondays 7:00p EST or on the DecisionPoint playlist on the StockCharts TV YouTube channel here!
NOTE: The stocks reported herein are from mechanical trading model scans that are based upon moving average relationships, momentum and volume. DecisionPoint analysis is then applied to get five selections from the scans. The selections given should prompt readers to do a chart review using their own analysis process. This letter is not a call for a specific action to buy, sell or short any of the stocks provided. There are NO sure things or guaranteed returns on the daily selection of "Diamonds in the Rough."
Regarding BUY/SELL Signals: The signal status reported herein is based upon mechanical trading model signals and crossovers. They define the implied bias of the price index/stock based upon moving average relationships and momentum, but they do not necessarily call for a specific action. They are information flags that should prompt chart review. Further, they do not call for continuous buying or selling during the life of the signal. For example, a BUY signal will probably (but not necessarily) return the best results if action is taken soon after the signal is generated. Additional opportunities for buying may be found as price zigzags higher, but the trader must look for optimum entry points. Conversely, exit points to preserve gains (or minimize losses) may be evident before the model mechanically closes the signal.
Helpful DecisionPoint Links:
DecisionPoint Shared ChartList and DecisionPoint Chart Gallery
Price Momentum Oscillator (PMO)
Swenlin Trading Oscillators (STO-B and STO-V)
For more links, go to DecisionPoint.com