
Welcome to another week of DP Diamonds! The market is continuing to show signs of weakness so I decided that I would make sure the stops were tighter on today's "Diamonds in the Rough". There continues to be pockets of strengths and various winners within the market currently, but we need to be careful given the market could speed up the decline that began today.
Picking stocks today wasn't that hard. I had a healthy amount of scan results, but not too many. I continue to refine the scans and the 'universe' that is scanned in preparation for the launch of our scan alert service. I'm hoping to have beta testing ready by the end of this month or into next month. If you haven't already expressed an interest in being a beta tester, feel free to send me an email. You'll get to review the service for two weeks and if you follow up with comments on the new product, you'll get a sizable discount. For those that have only recently subscribed, this service will be for the 'do-it-yourself' trader who wants quality symbols to review on their own. DP Diamonds distills those results into the ten picks for the week.
Good Luck & Good Trading,
Erin
Today's "Diamonds in the Rough": AON, HWM and MHO.
Runner-ups: SGML, LSI, GWRE, ARMK and CRWD.
** JULY VACATION **
I will be in Europe 7/14 - 7/27 so there will not be any Diamonds reports or trading rooms during that time. All subscribers with active subscriptions on 7/27 will be compensated with two weeks added to their renewal date.

RECORDING LINK (5/5/2023):
Topic: DecisionPoint Diamond Mine (5/5/2023) LIVE Trading Room
Passcode: May##5th
REGISTRATION for 5/12/2023:
When: May 12, 2023 09:00 AM Pacific Time (US and Canada)
Topic: DecisionPoint Diamond Mine (5/12/2023) LIVE Trading Room
Register in advance for this webinar HERE
After registering, you will receive a confirmation email containing information about joining the webinar.

Here is the last recording (5/8):
Welcome to DecisionPoint Diamonds, wherein I highlight ten "Diamonds in the Rough" per week. These are selected from the results of my DecisionPoint Scans which search for stocks that could benefit from the trend and condition of the market. Remember, these are not recommendations to buy or sell, but are the most interesting of the stocks that surfaced in my scans. My objective is to save you the work of the initial, tedious culling process, but you need to apply your own analysis to see if these stocks pique your interest as well. There are no guaranteed winners here!
"Predefined Scans Triggered" are taken from StockCharts.com using the "Symbol Summary" option instead of a "SharpChart" on the workbench.
Stop levels are all rounded down.
Aon Corp. (AON)
EARNINGS: 07/28/2023 (BMO)
Aon Plc engages in the provision of risk, health, and wealth solutions. It operates through Global Professional Services Firm segment. The Global Professional Services Firm segment involves in the provides advice and solutions to clients focused on risk, health and wealth through four principal products and services. The company was founded in 1982 and is headquartered in Dublin, Ireland.
Predefined Scans Triggered: New CCI Buy Signals, New 52-week Highs, Moved Above Upper Price Channel and P&F Double Top Breakout.
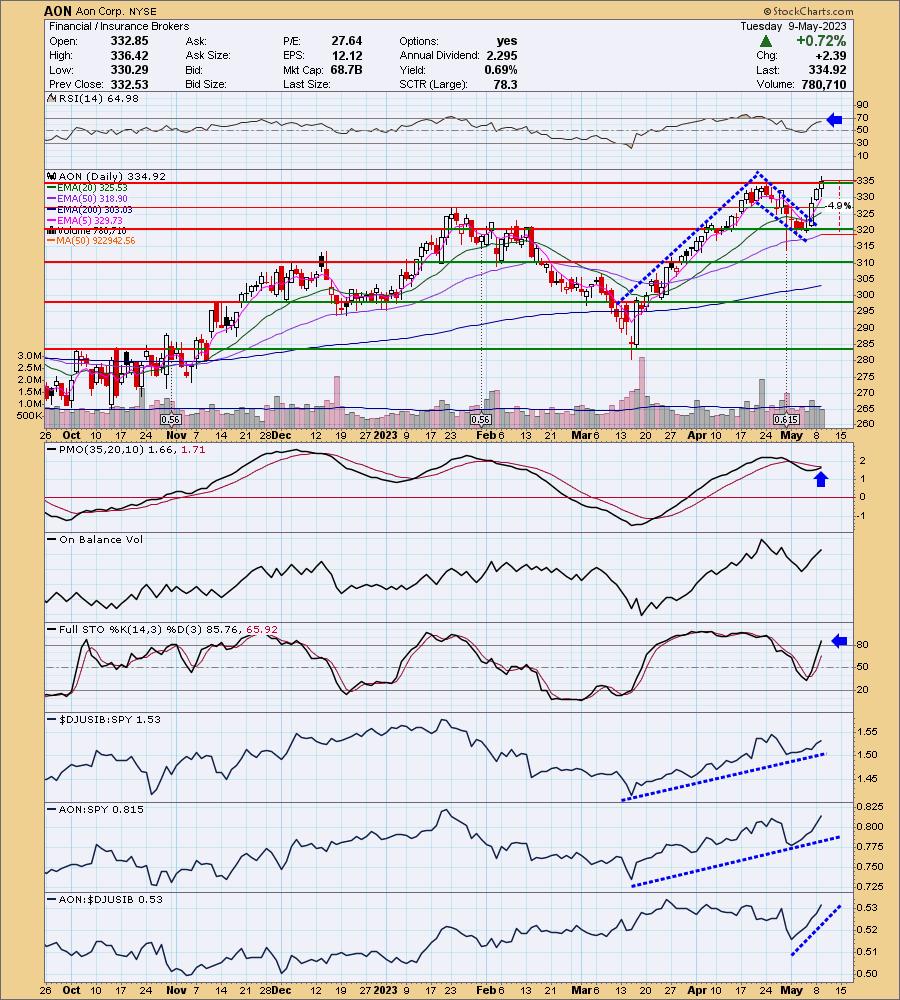
AON is unchanged in after hours trading. The large bull flag formation caught my eye on this one. Bull flag breakouts, like we see here, tell us to expect a move the height of the flagpole. This implies there is plenty more upside available to AON. Price has broken above resistance and has hit new 52-week highs. The RSI is positive and the PMO is nearing a Crossover BUY Signal. Stochastics look excellent as they are now above 80 implying internal strength. Relative strength looks very good with both the group and the stock easily outperforming the market right now. The stop is set below the 50-day EMA 4.9% or $318.50.
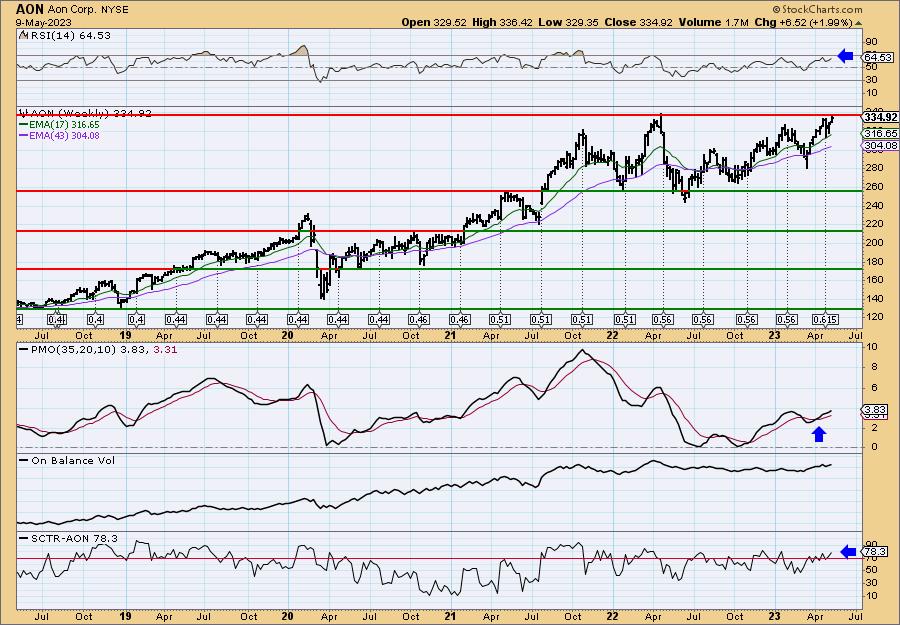
While resistance was overcome on the daily chart, longer-term resistance hasn't quite been broken at the 2022 high. The weekly RSI and weekly PMO are very bullish right now. The SCTR is even in the "hot zone"* above 70. Since it is at all-time highs, you can consider a 15% upside target near $385.15.
*If a stock is in the "hot zone" above 70, it implies that it is stronger than 70% of its universe (large-, mid-, small-caps and ETFs) primarily in the intermediate to long terms.
Howmet Aerospace Inc. (HWM)
EARNINGS: 08/03/2023 (BMO)
Howmet Aerospace, Inc. engages in provision of engineered solutions for the aerospace and transportation industries. It operates through the following segments: Engine Products, Fastening Systems, Engineered Structures, and Forged Wheels. The Engine Products segment produces investment castings, including airfoils, and seamless rolled rings primarily for aircraft engines (aerospace commercial and defense) and industrial gas turbines. The Fastening Systems segment is involved in the production of aerospace fastening systems, as well as commercial transportation fasteners. The Engineered Structures segment includes titanium ingots and mill products for aerospace and defense applications and is vertically integrated to produce titanium forgings, extrusions forming and machining services for airframe, wing, aero-engine, and landing gear components. The Forged Wheels segment provides forged aluminum wheels and related products for heavy-duty trucks, trailers, and buses globally. The company was founded in 1888 and is headquartered in Pittsburgh, PA.
Predefined Scans Triggered: Elder Bar Turned Green, Improving Chaikin Money Flow, New CCI Buy Signals, P&F Ascending Triple Top Breakout and P&F Double Top Breakout.
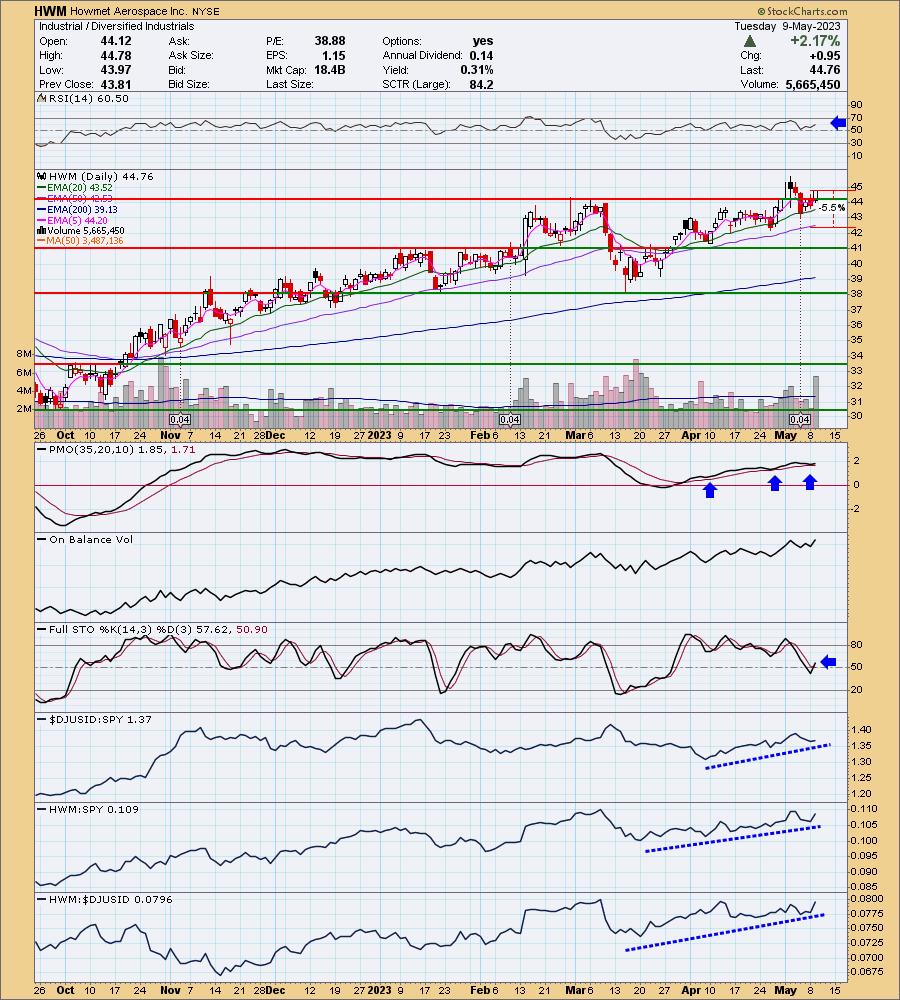
HWM is unchanged in after hours trading. After pulling back to the 20-day EMA (clearly a favorite area of support for HWM), price is again above the March high. I see three different PMO "Surges" above the signal line (PMO bottom above the signal line). The RSI is positive and Stochastics are rising in positive territory. Relative strength is solid for the group and the stock. The stop is set at 5.5% or $42.29.
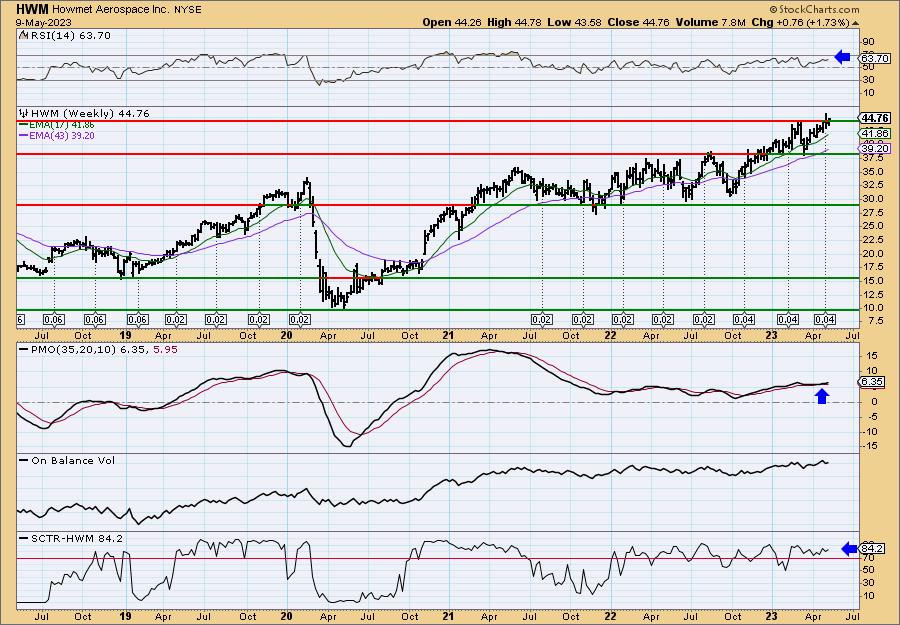
The weekly RSI is in positive territory and isn't overbought. The weekly PMO is on a Crossover BUY Signal. The SCTR is in the hot zone. Since it is at 52-week highs, consider an upside target of 15% or $51.47.
M/I Homes, Inc. (MHO)
EARNINGS: 07/26/2023 (BMO)
M/I Homes, Inc. engages in the construction and development of residential properties. It operates through the Homebuilding and Financial Services segments. The Homebuilding segment includes Northern and Southern Homebuilding which designs, markets, constructs, and sells single-family homes and attached townhomes to first-time, millennial, move-up, empty-nester, and luxury buyers. The Financial Services segment offers mortgage banking services to homebuyers. The company was founded by Irving Schottenstein and Melvin Schottenstein in 1976 and is headquartered in Columbus, OH.
Predefined Scans Triggered: Elder Bar Turned Green, New CCI Buy Signals, New 52-week Highs, Moved Above Upper Price Channel, P&F Ascending Triple Top Breakout and P&F Double Top Breakout.
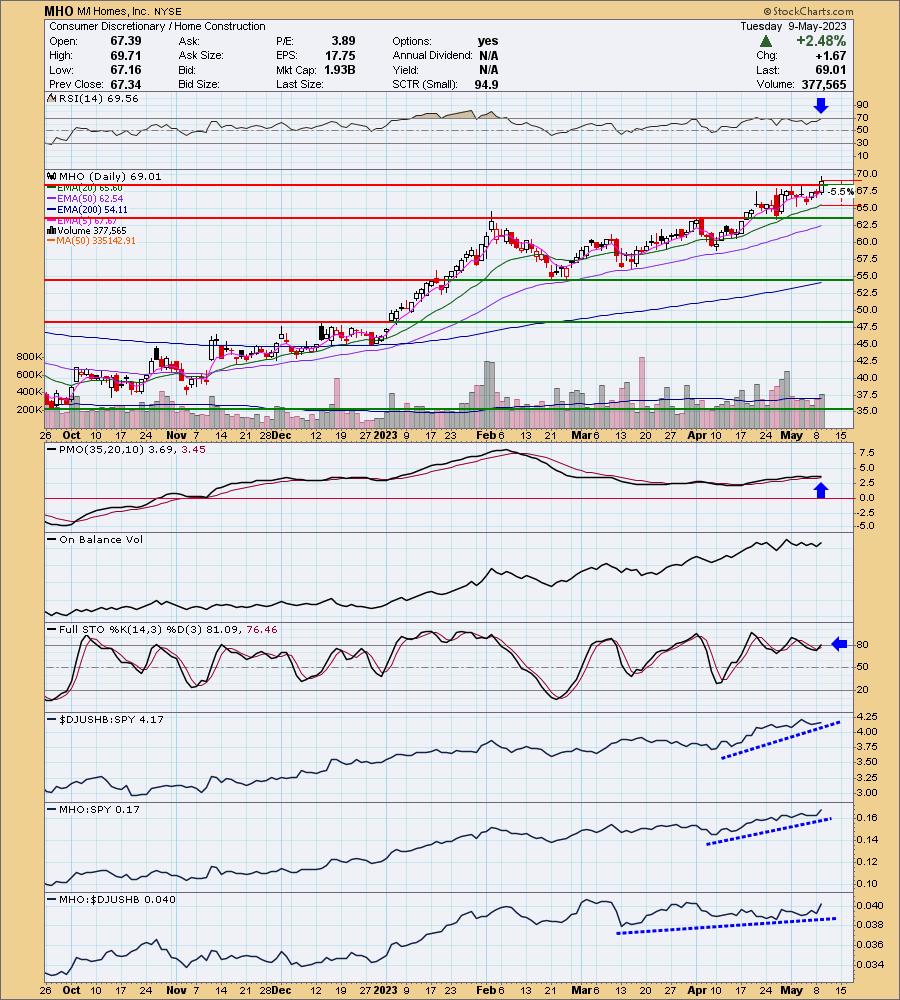
MHO is down -0.16% in after hours trading. This stock has been in a very steady uptrend which is why the PMO is so flat. It is on a PMO Crossover BUY Signal and Stochastics moved back above 80. The RSI is getting overbought, but based on January, price can remain overbought for some time. Still we should make sure the rising trend remains intact. Relative strength is rising for both the group and the stock. The stop is set at the 20-day EMA around 5.5% or $65.21.
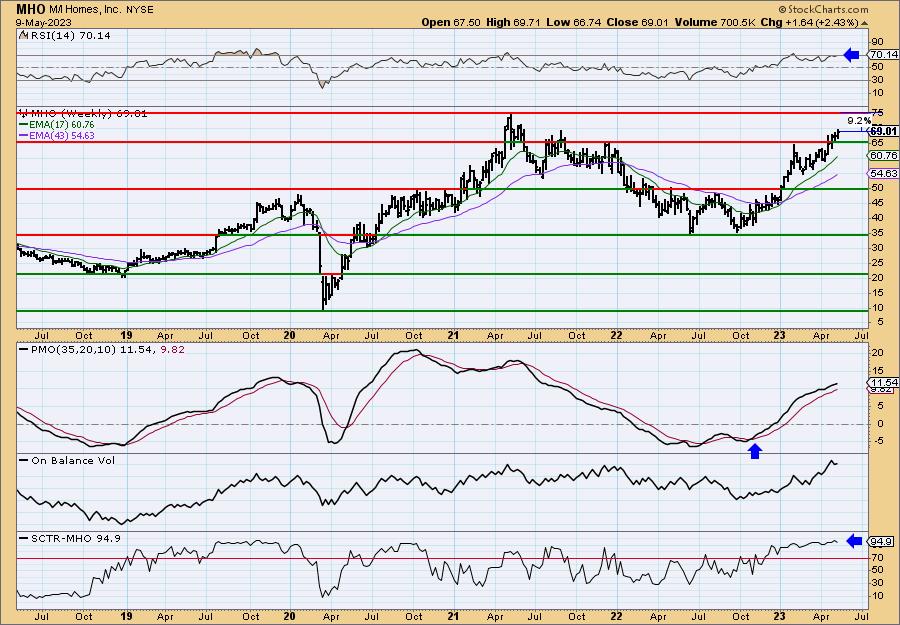
Overhead resistance is nearing at the 2021 high, but it seems safe to assume it will overcome that level given the weekly RSI is positive and not only slightly overbought. The weekly PMO rising on an oversold Crossover BUY Signal is encouraging, as is the SCTR which is top of the range.
Don't forget, on Thursdays I look at reader-requested symbols, click HERE to send me an email. I read every email I receive and try to answer them all!
Current Market Outlook:
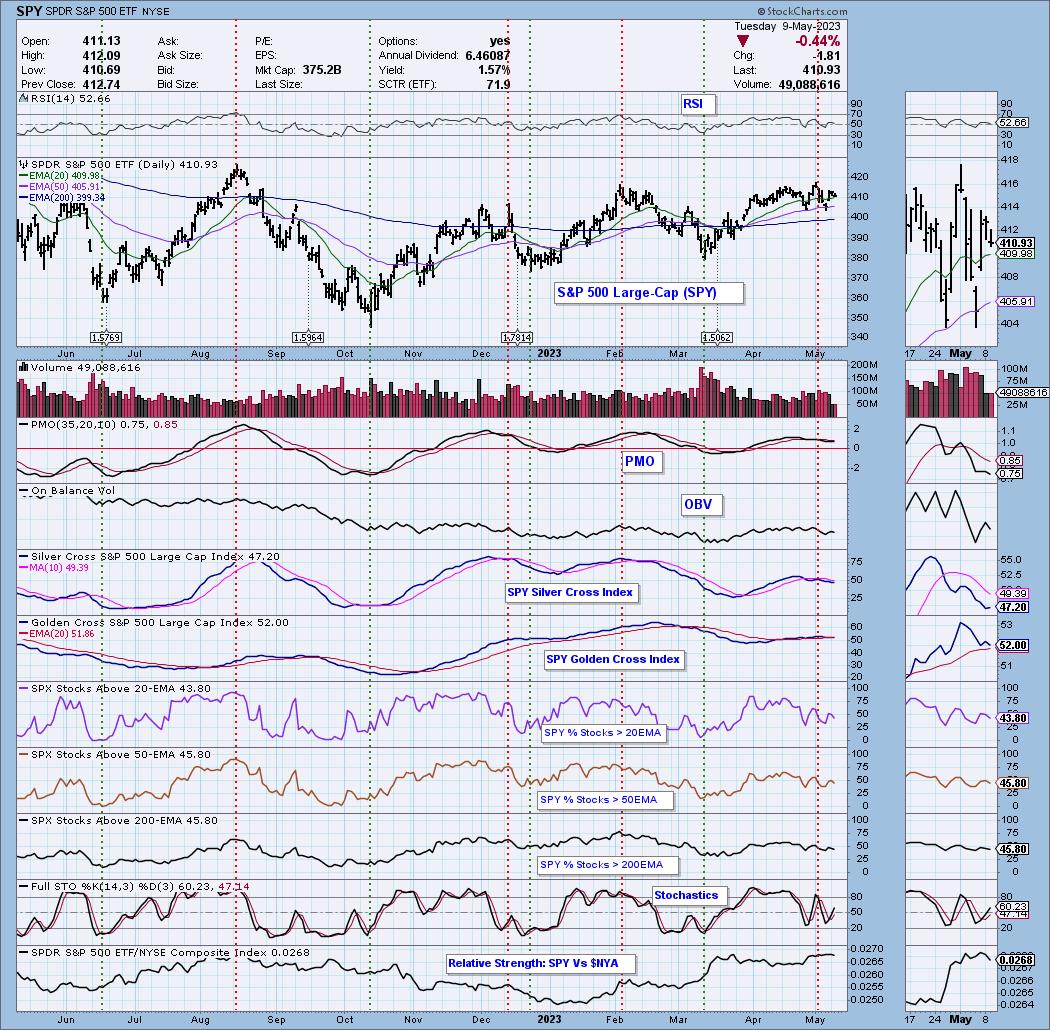
Market Environment: It is important to consider the odds for success by assessing the market tides. The following chart uses different methodologies for objectively showing the depth and trend of participation for intermediate- and long-term time frames.
- The Silver Cross Index (SCI) shows the percentage of SPX stocks on IT Trend Model BUY signals (20-EMA > 50-EMA)
- The Golden Cross Index (GCI) shows the percentage of SPX stocks on LT Trend Model BUY signals (50-EMA > 200-EMA)
Don't forget that as a "Diamonds" member, you have access to our GCI/SCI curated ChartList on DecisionPoint.com. You'll find it under "Members Only" links on the left side on the Blogs and Links Page.
Here is the current chart:
Full Disclosure: I am 18% long, 7% short.
I'm required to disclose if I currently own a stock I mention and/or may buy/short it within the next 72 hours.
"Technical Analysis is a windsock, not a crystal ball." - Carl Swenlin
(c) Copyright 2023 DecisionPoint.com
Watch the latest episode of DecisionPoint Trading Room with Carl & Erin Swenlin on Mondays 7:00p EST or on the DecisionPoint playlist on the StockCharts TV YouTube channel here!
NOTE: The stocks reported herein are from mechanical trading model scans that are based upon moving average relationships, momentum and volume. DecisionPoint analysis is then applied to get five selections from the scans. The selections given should prompt readers to do a chart review using their own analysis process. This letter is not a call for a specific action to buy, sell or short any of the stocks provided. There are NO sure things or guaranteed returns on the daily selection of "Diamonds in the Rough."
Regarding BUY/SELL Signals: The signal status reported herein is based upon mechanical trading model signals and crossovers. They define the implied bias of the price index/stock based upon moving average relationships and momentum, but they do not necessarily call for a specific action. They are information flags that should prompt chart review. Further, they do not call for continuous buying or selling during the life of the signal. For example, a BUY signal will probably (but not necessarily) return the best results if action is taken soon after the signal is generated. Additional opportunities for buying may be found as price zigzags higher, but the trader must look for optimum entry points. Conversely, exit points to preserve gains (or minimize losses) may be evident before the model mechanically closes the signal.
Helpful DecisionPoint Links:
DecisionPoint Shared ChartList and DecisionPoint Chart Gallery
Price Momentum Oscillator (PMO)
Swenlin Trading Oscillators (STO-B and STO-V)
For more links, go to DecisionPoint.com