
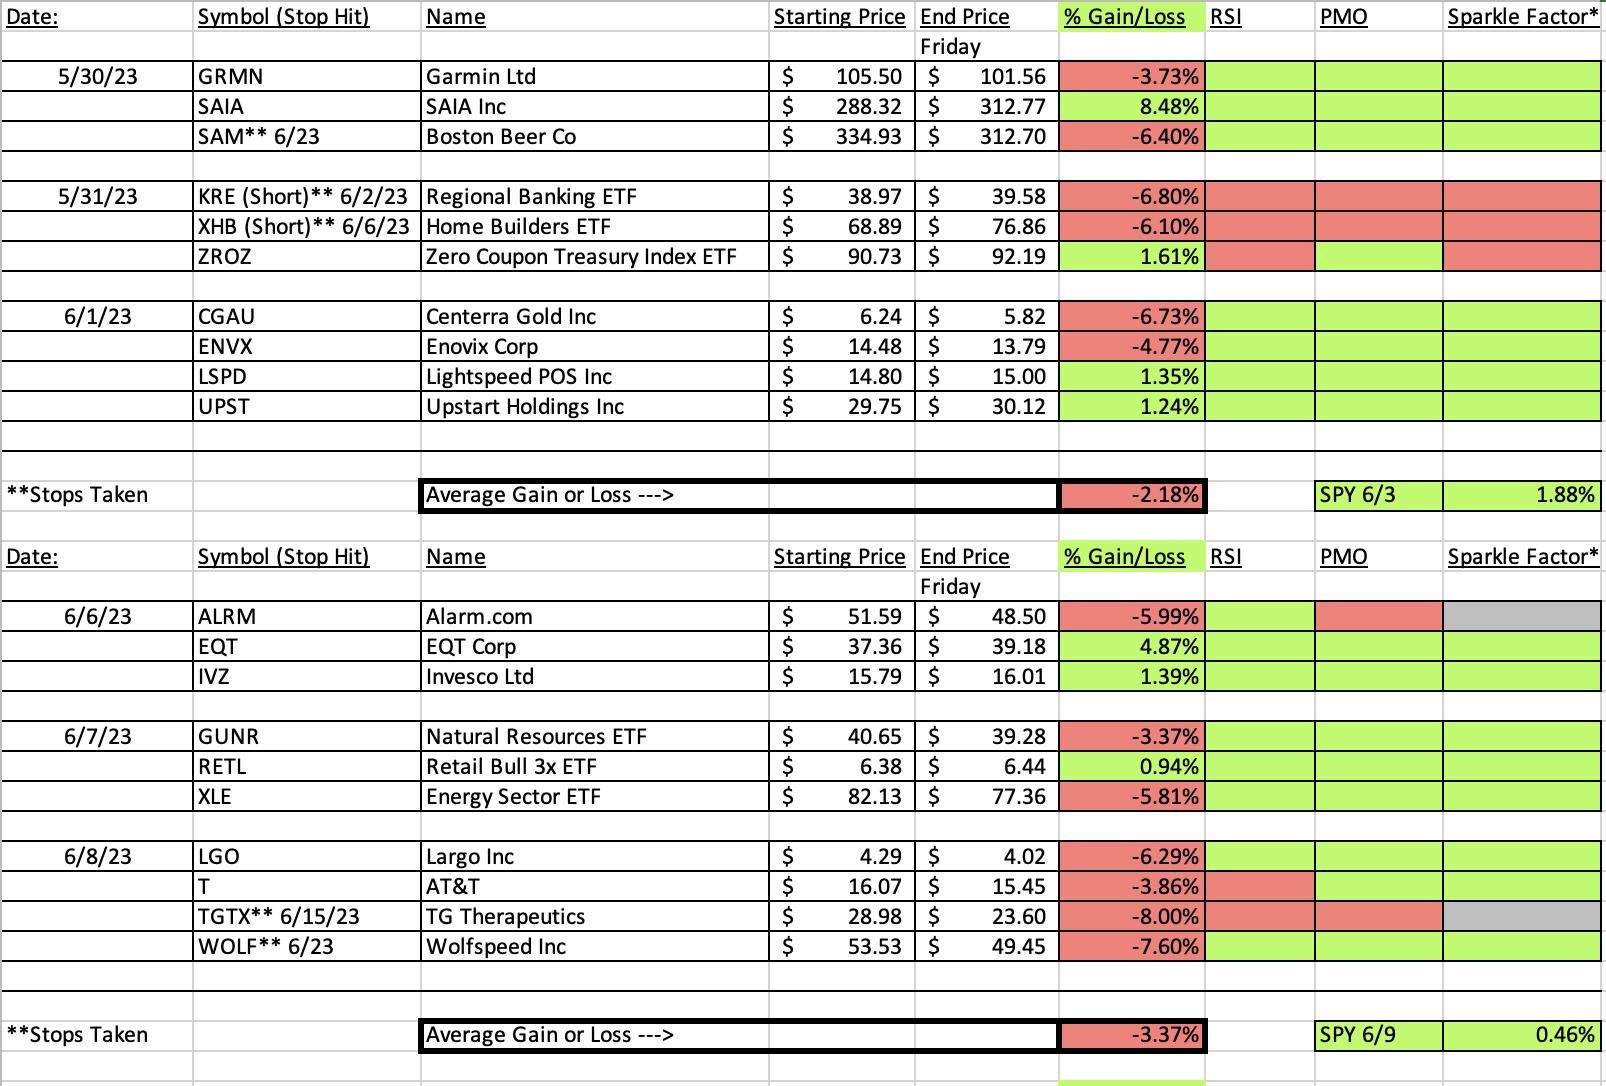
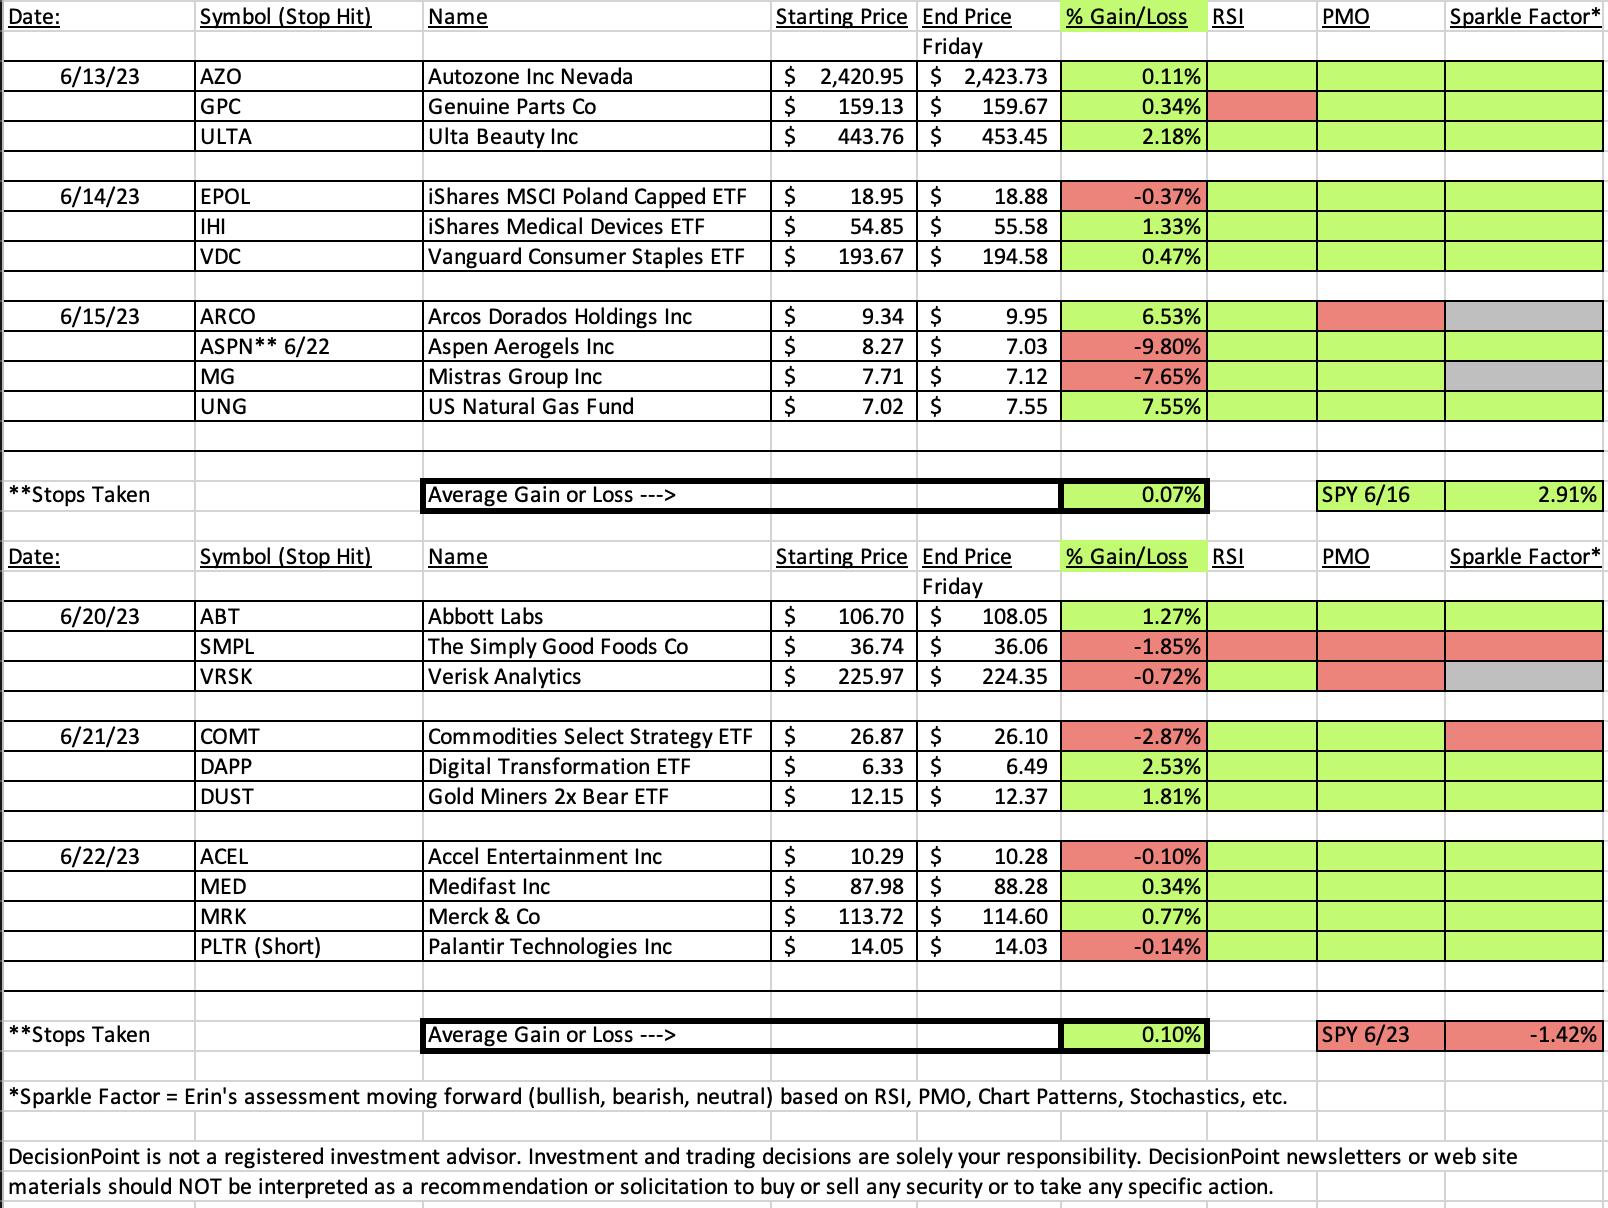
I was pleased overall by this week's performance for "Diamonds in the Rough". They finished higher on average while the SPY was down -1.42%. Nice week!
I did purchase three of these Diamond selections this week and while two of the three are down, only one looks negative enough to have my finger on the "SELL" button.
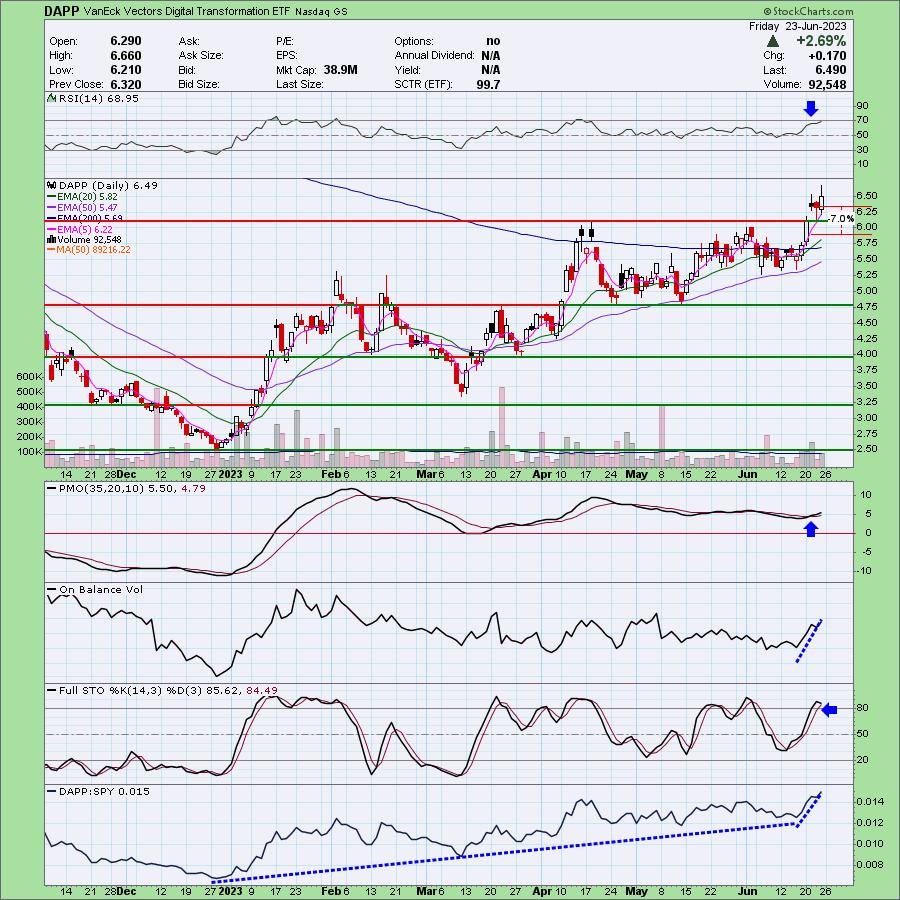
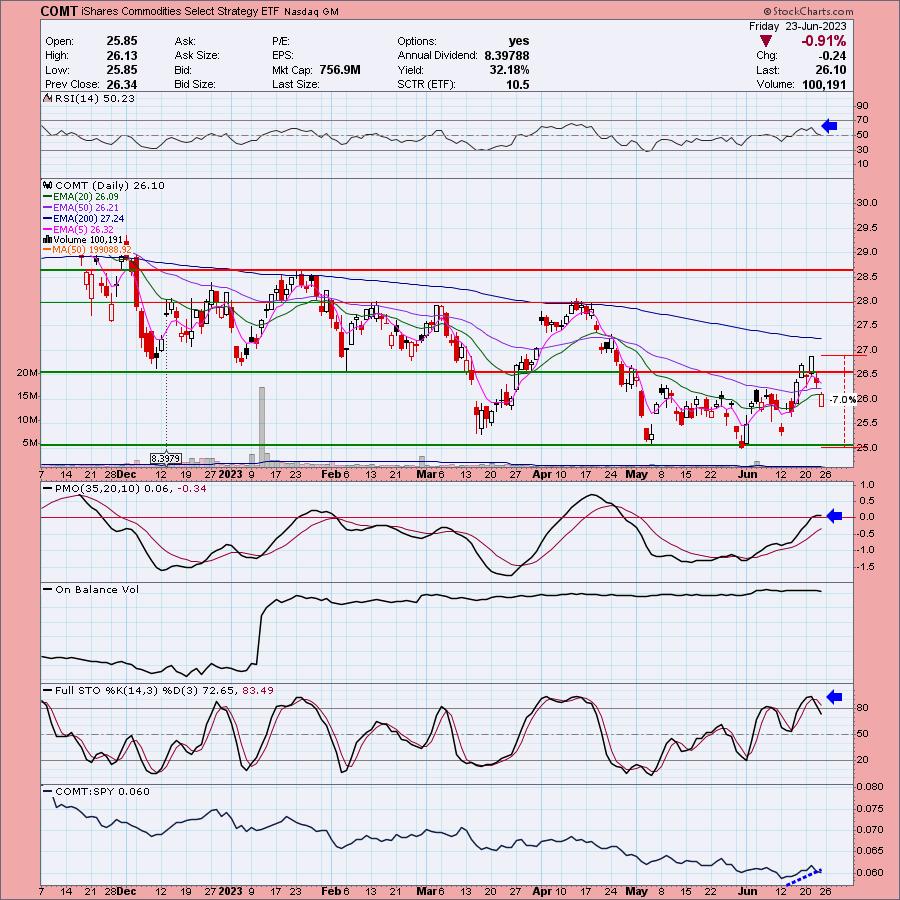
This week's "Darling" was the Digital Transformation ETF (DAPP) which was up +2.53% since being picked on Wednesday. My favorite ETF of the day, Commodities ETF (COMT), turned out to be this week's "Dud". Wheat and Corn got very extended. Additionally, I believe Crude is included in this ETF and it hasn't been a stellar performer. I've listed it with a bearish Sparkle Factor so it should be sold even though the stop isn't close to being hit.
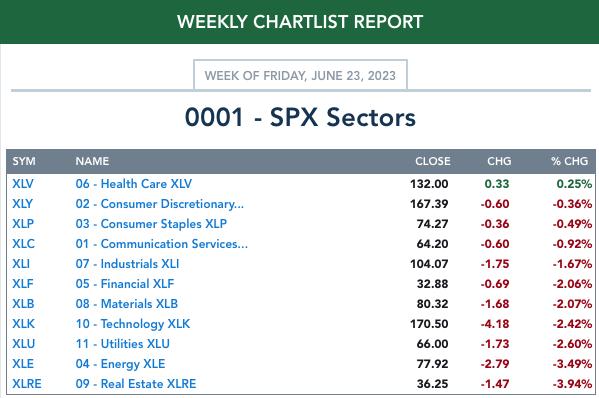
The Sector to Watch was easy this week. Only two sectors had positive PMOs, Healthcare (XLV) and Consumer Staples (XLP). Participation was stronger in Healthcare but truth be told, I don't expect great things out of any stocks next week as I believe digestion will continue. Still, it could be a good place to fish as participation looks pretty good.
Hope you have a great weekend!
Good Luck & Good Trading,
Erin

RECORDING LINK (6/23/2023):
Topic: DecisionPoint Diamond Mine (6/23/2023) LIVE Trading Room
Passcode: June*23rd
REGISTRATION for 6/30/2023:
When: Jun 30, 2023 09:00 AM Pacific Time (US and Canada)
Topic: DecisionPoint Diamond Mine (6/30/2023) LIVE Trading Room
Register in advance for this webinar HERE
After registering, you will receive a confirmation email containing information about joining the webinar.

Our latest DecisionPoint Trading Room recording (6/12/2023- no recording 6/19):
A few items about the spreadsheet: I've put on the spreadsheet whether the RSI is positive (green) or negative (red). The PMO column tells you if it is rising (green) or falling (red). Finally I've added my own "Sparkle Factor" that gives you my assessment going forward, bullish (green), bearish (red) or neutral (gray). The Sparkle Factor is basically my thoughts on whether I expect it to rise or fall. A neutral means it could really go either way so it could be added to a watch list. If you're in a stock I consider "neutral" going forward, the ball is in your court.
Darling:
VanEck Vectors Digital Transformation ETF (DAPP)
EARNINGS: N/A
DAPP tracks a market-cap-weighted index of global innovative companies that are involved in the digitalization of the worlds economy through a diverse range of digital assets. Click HERE for more information.
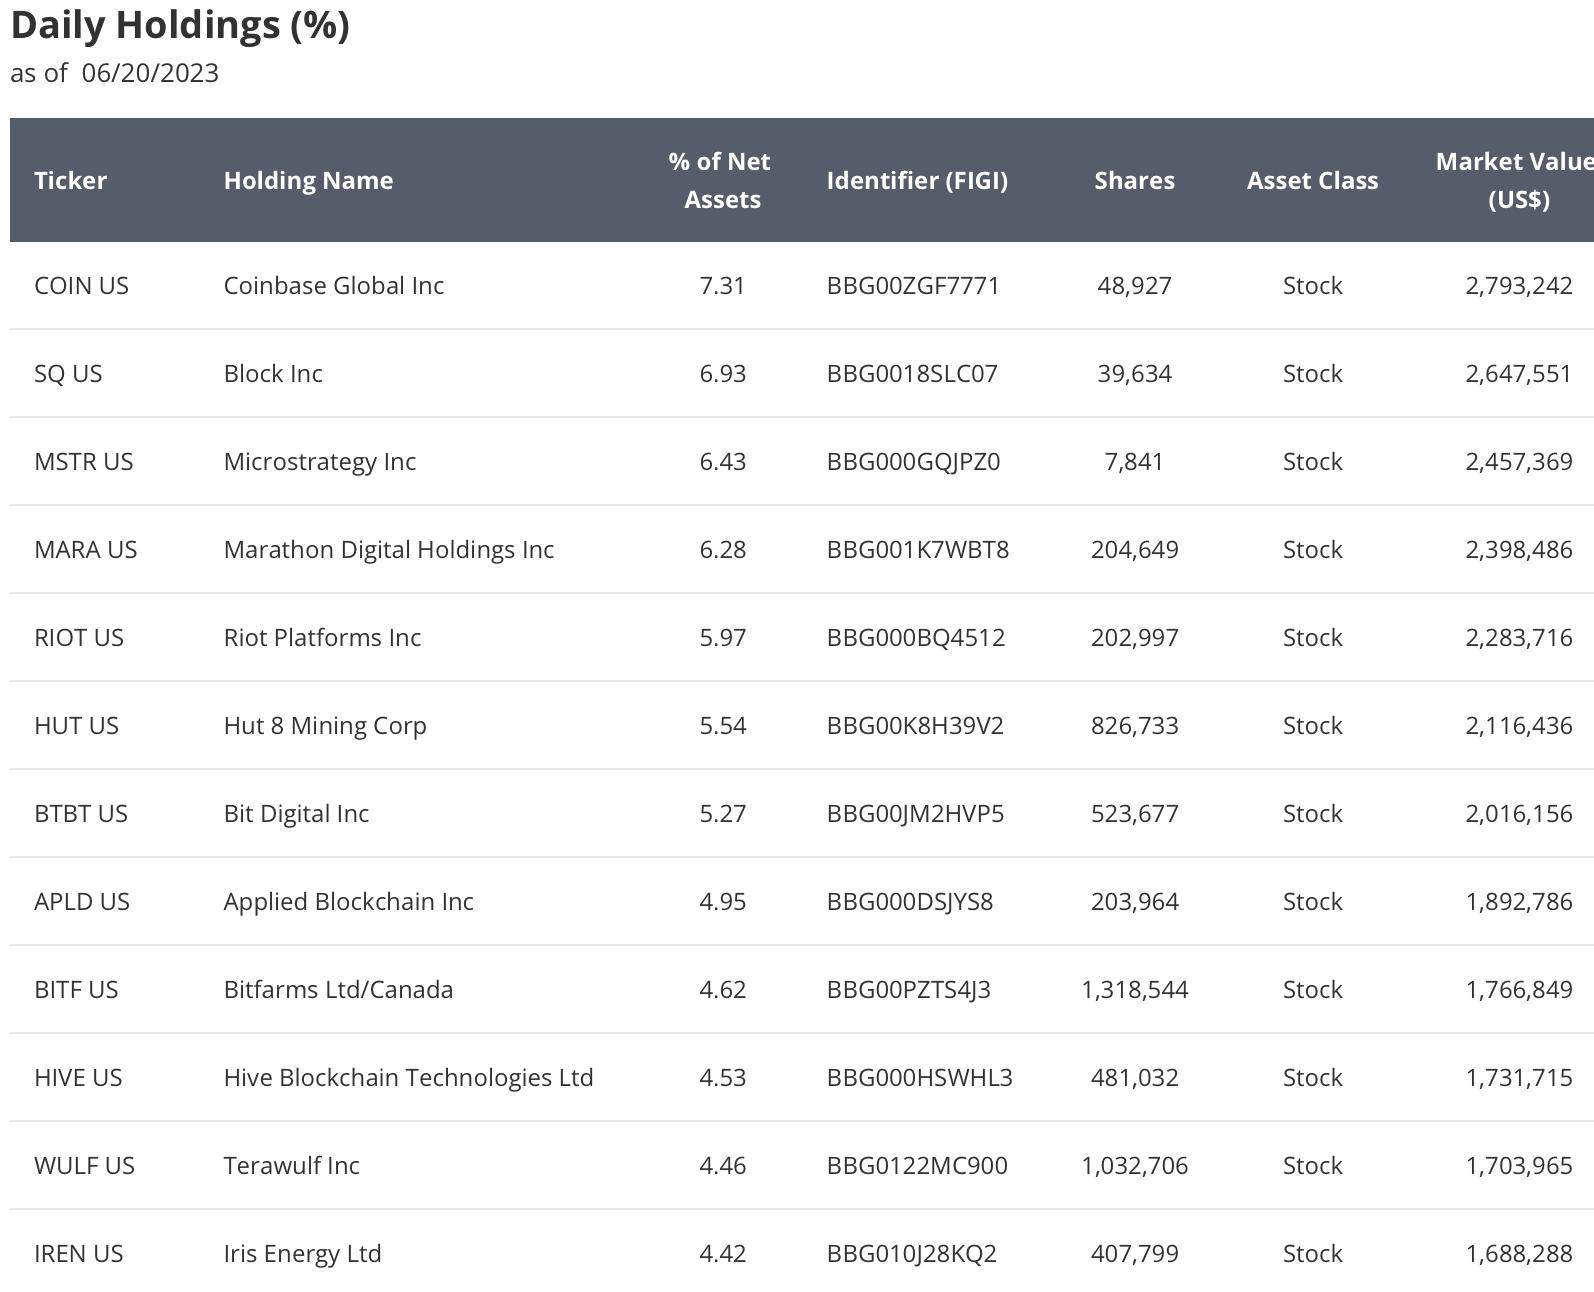
Predefined Scans Triggered: Moved Above Upper Keltner Channel, P&F Spread Triple Top Breakout, Filled Black Candles and P&F Double Top Breakout.
Below are the commentary and chart from Wednesday (6/21):
"DAPP is down -0.79% in after hours trading. I found the make-up of this ETF to be quite interesting. The rally in Bitcoin could have something to do with the current breakout, but just looking at the price chart, I know it trades differently than Bitcoin itself. Price did form a bearish filled black candlestick today so a decline tomorrow shouldn't be surprising. A pullback to the breakout point would make sense. The RSI is positive and not overbought. There is a new PMO Crossover BUY Signal in effect. Volume is coming in based on the OBV and Stochastics just moved above 80. This ETF has been outperforming the SPY for some time. It is increasing its outperformance currently. The stop is set beneath prior resistance at 7% or $5.88. This is a low-priced ETF so position size wisely."
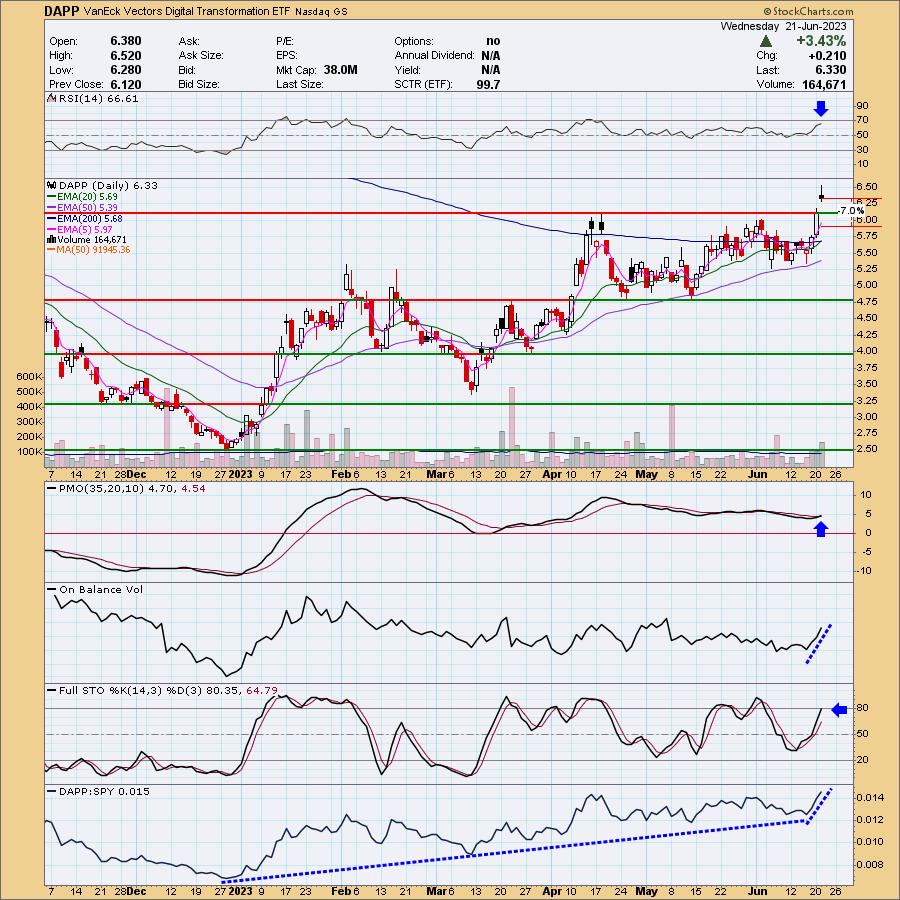
Here is today's chart:
It was down slightly the day after being picked, but it rallied strongly today and formed a bullish engulfing candlestick. The RSI is trying to get overbought, so it may consolidate a bit here, but ultimately given the PMO Crossover BUY Signal and strong outperformance, it should move higher from this new support level.
Don't forget, on Thursdays I look at reader-requested symbols, so shoot me an email at erin@decisionpoint.com. I read every email I receive and try to answer them all!
Dud:
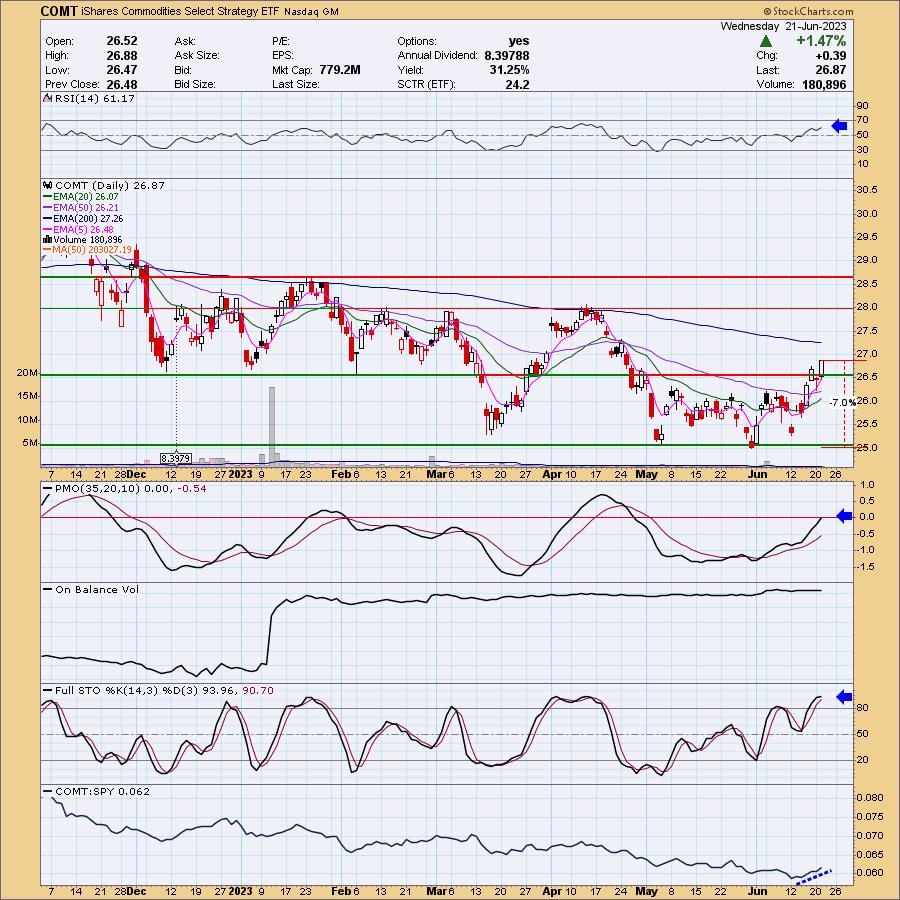
iShares Commodities Select Strategy ETF (COMT)
EARNINGS: N/A
COMT tracks a broad-market commodity index that utilizes a flexible dynamic roll strategy. Click HERE for more information.
Predefined Scans Triggered: Moved Above Upper Bollinger Band, Stocks in a New Uptrend (Aroon), Moved Above Ichimoku Cloud, Moved Above Upper Price Channel and P&F Double Bottom Breakout.
Below are the commentary and chart from Wednesday (6/21):
"COMT is down -0.11% in after hours trading. After breaking out on Monday, COMT pulled back to below the breakout point which we often see. Today it surged higher, leaving overhead resistance in the rearview mirror. The RSI is positive and the PMO is crossing the zero line on a Crossover BUY Signal. Stochastics are above 80. Relative strength is picking up for COMT against the SPY. I've set the stop below support at 7% or $24.98."
Here is today's chart:
After such a great breakout, the chart fell apart. It isn't terrible, but everything tells me this one will test support at the bottom of the current trading range. Stochastics give us the biggest hint as they are falling fast and have dropped below the 80. The RSI should hit negative territory soon. The PMO is already trying to top. This is still watch list material as a bounce off the bottom of the trading range would imply and nice ride back up.
THIS WEEK's Sector Performance:
DecisionPoint Sector Scoreboard (Mechanical Trend Model Signals):
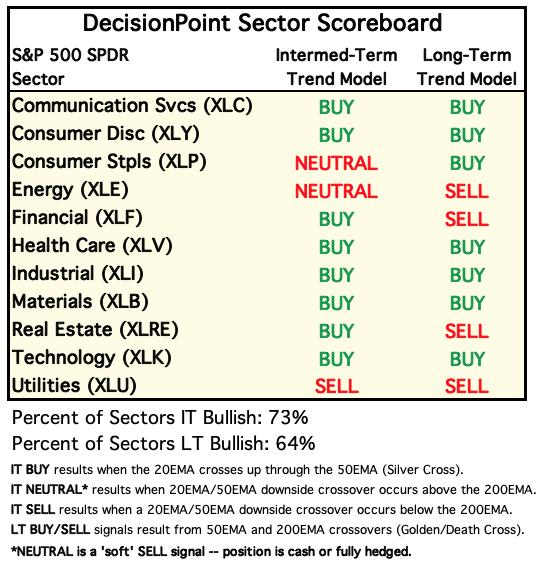
Click Here to view Carl's annotated Under the Hood ChartList!
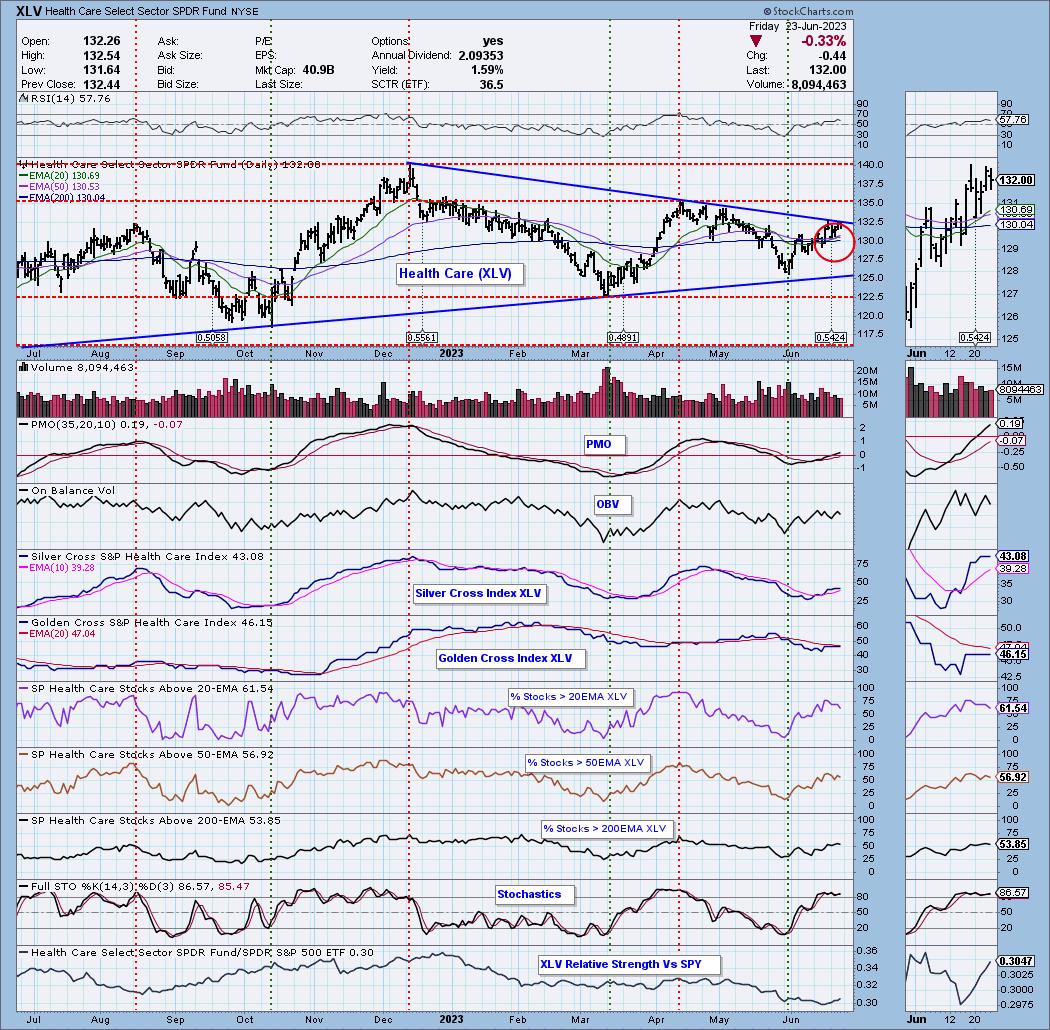
Sector to Watch: Healthcare (XLV)
The PMO is what drew me to this sector. It isn't perfect right now, but it is setup better than the others to outperform. I would've liked to have seen a breakout by now from the symmetrical triangle. We did see a "Silver Cross" of the 20/50-day EMAs this week which is encouraging. The RSI is positive and Stochastics have established residency above 80. The main problem I see is that we are losing stocks above their 20-day EMA and this has depressed the Silver Cross Index. I see the market digesting this rally further next week. Healthcare is a defensive area of the market along with Consumer Staples. If we are going to see some action, I would look toward these two sectors. Just remember, these two sectors could outperform the market and still move lower in price.
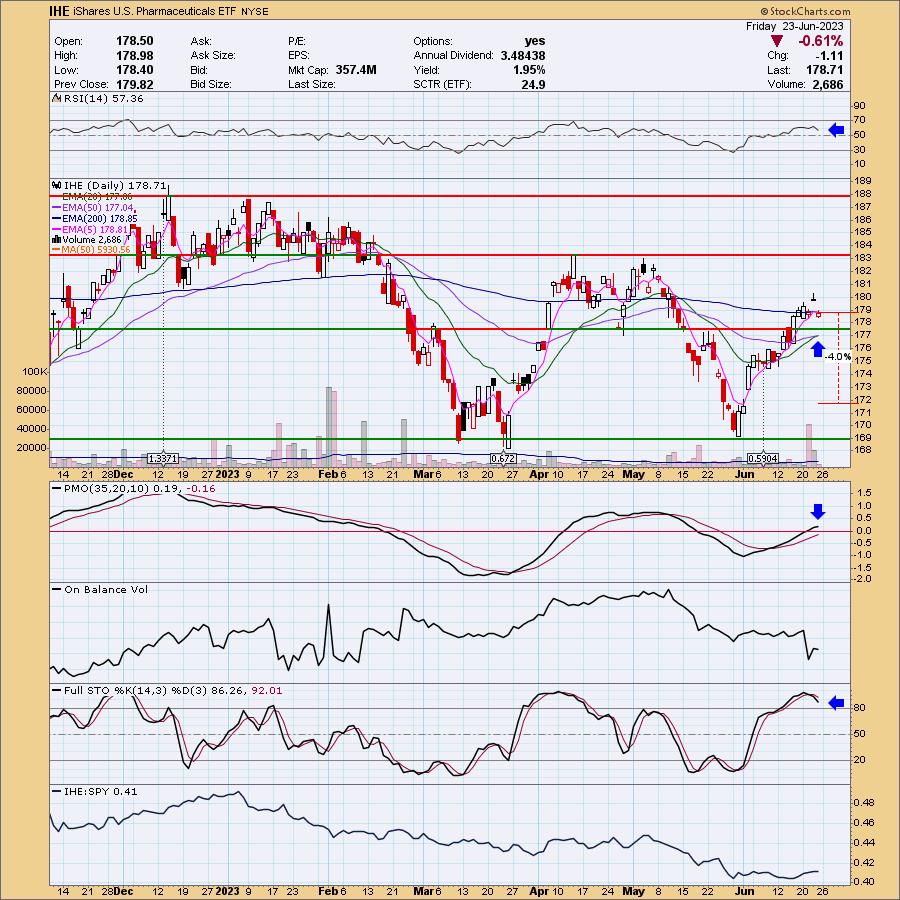
Industry Group to Watch: Pharmaceuticals (IHE)
I opted to go with the Pharmaceuticals industry group. I was happy to be able to present an ETF that follows this industry group. The group was down on the day but formed a bullish hollow red candlestick suggesting it is ready to reverse. We have a new Silver Cross of the 20/50-day EMAs and the RSI is positive. The PMO is rising, although it did decelerate a little bit on today's decline. Stochastics have topped ominously, but remain above 80. The rising price trend is intact, but if you choose to buy this ETF, I wouldn't give it much rope. In all honesty, a drop below the 50-day EMA alongside a topping PMO would have me out fairly quickly.
Go to our Under the Hood ChartList on DecisionPoint.com to get an in-depth view of all the sectors. On StockCharts.com you can find the Industry Summary.
Good Luck & Good Trading!
- Erin
erin@decisionpoint.com
Full Disclosure: I'm 40% long, 0% short.
Watch the latest episode of the DecisionPoint Trading Room with Carl & Erin Swenlin on Mondays 3:00p EST!
Technical Analysis is a windsock, not a crystal ball. --Carl Swenlin
NOTE: The stocks reported herein are from mechanical trading model scans that are based upon moving average relationships, momentum and volume. DecisionPoint analysis is then applied to get selections from the scans. The selections given should prompt readers to do a chart review using their own analysis process. This letter is not a call for a specific action to buy, sell or short any of the stocks provided. There are NO sure things or guaranteed returns on the selection of "diamonds in the rough."
Helpful DecisionPoint Links:
DecisionPoint Shared ChartList and DecisionPoint Chart Gallery
Price Momentum Oscillator (PMO)
Swenlin Trading Oscillators (STO-B and STO-V)
(c) Copyright 2023 DecisionPoint.com