
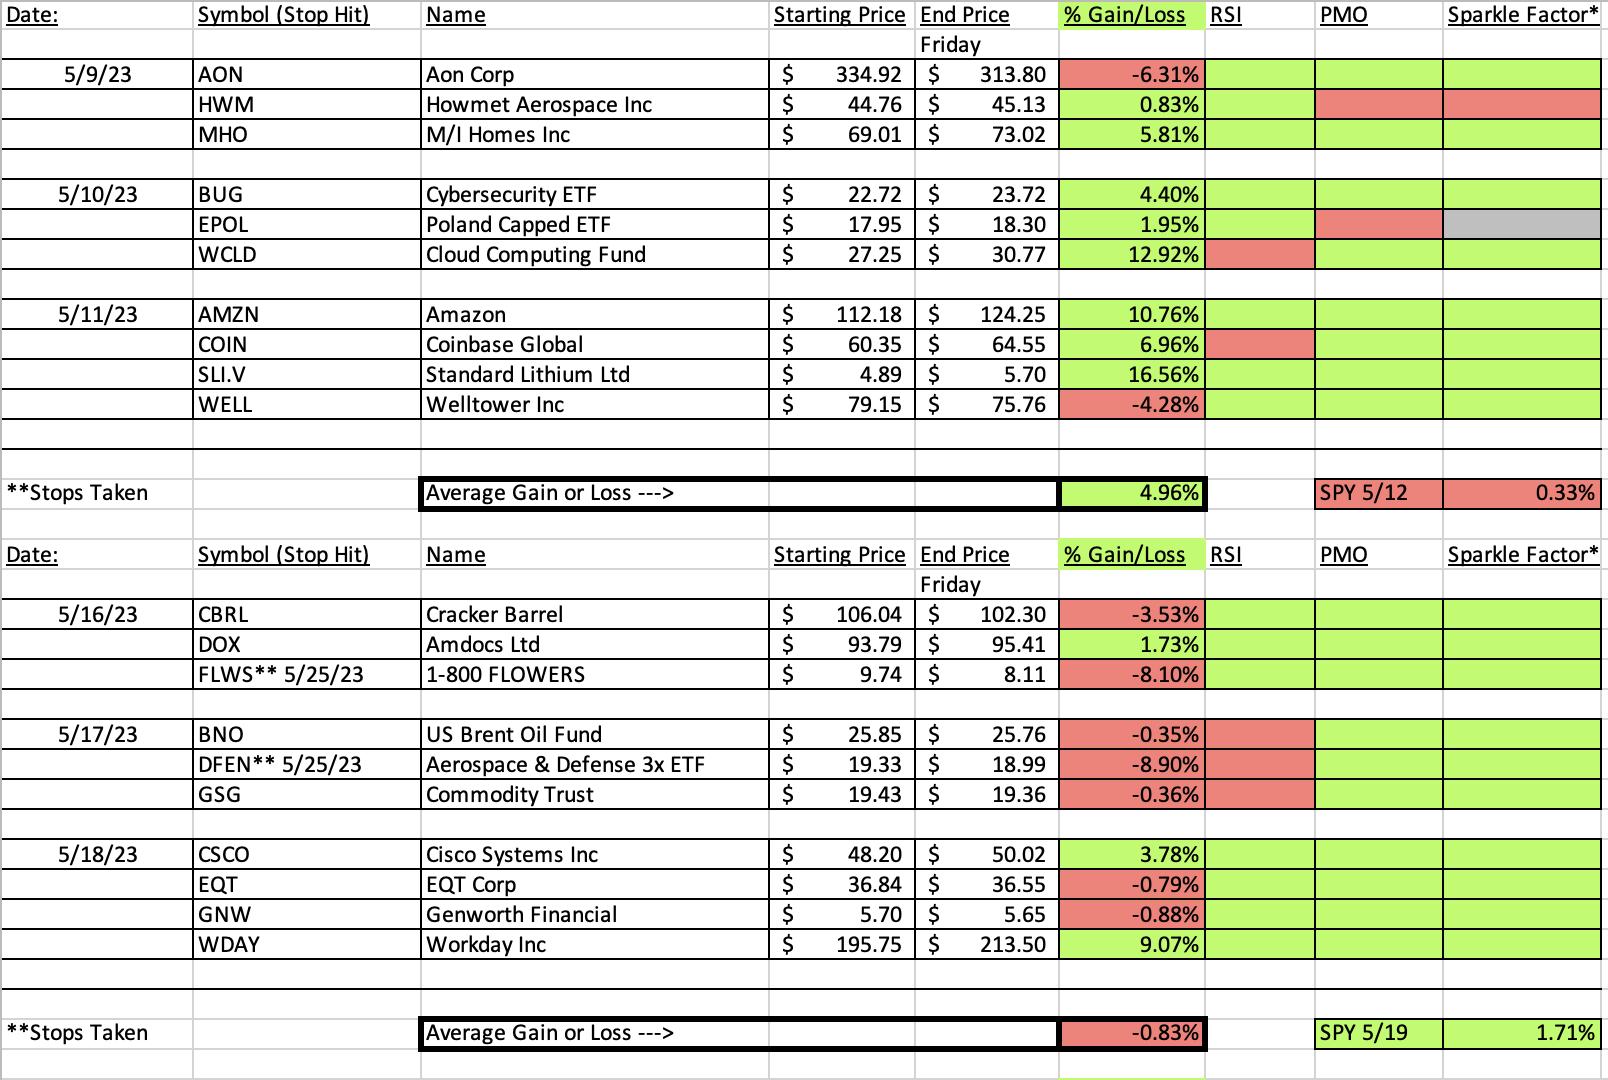
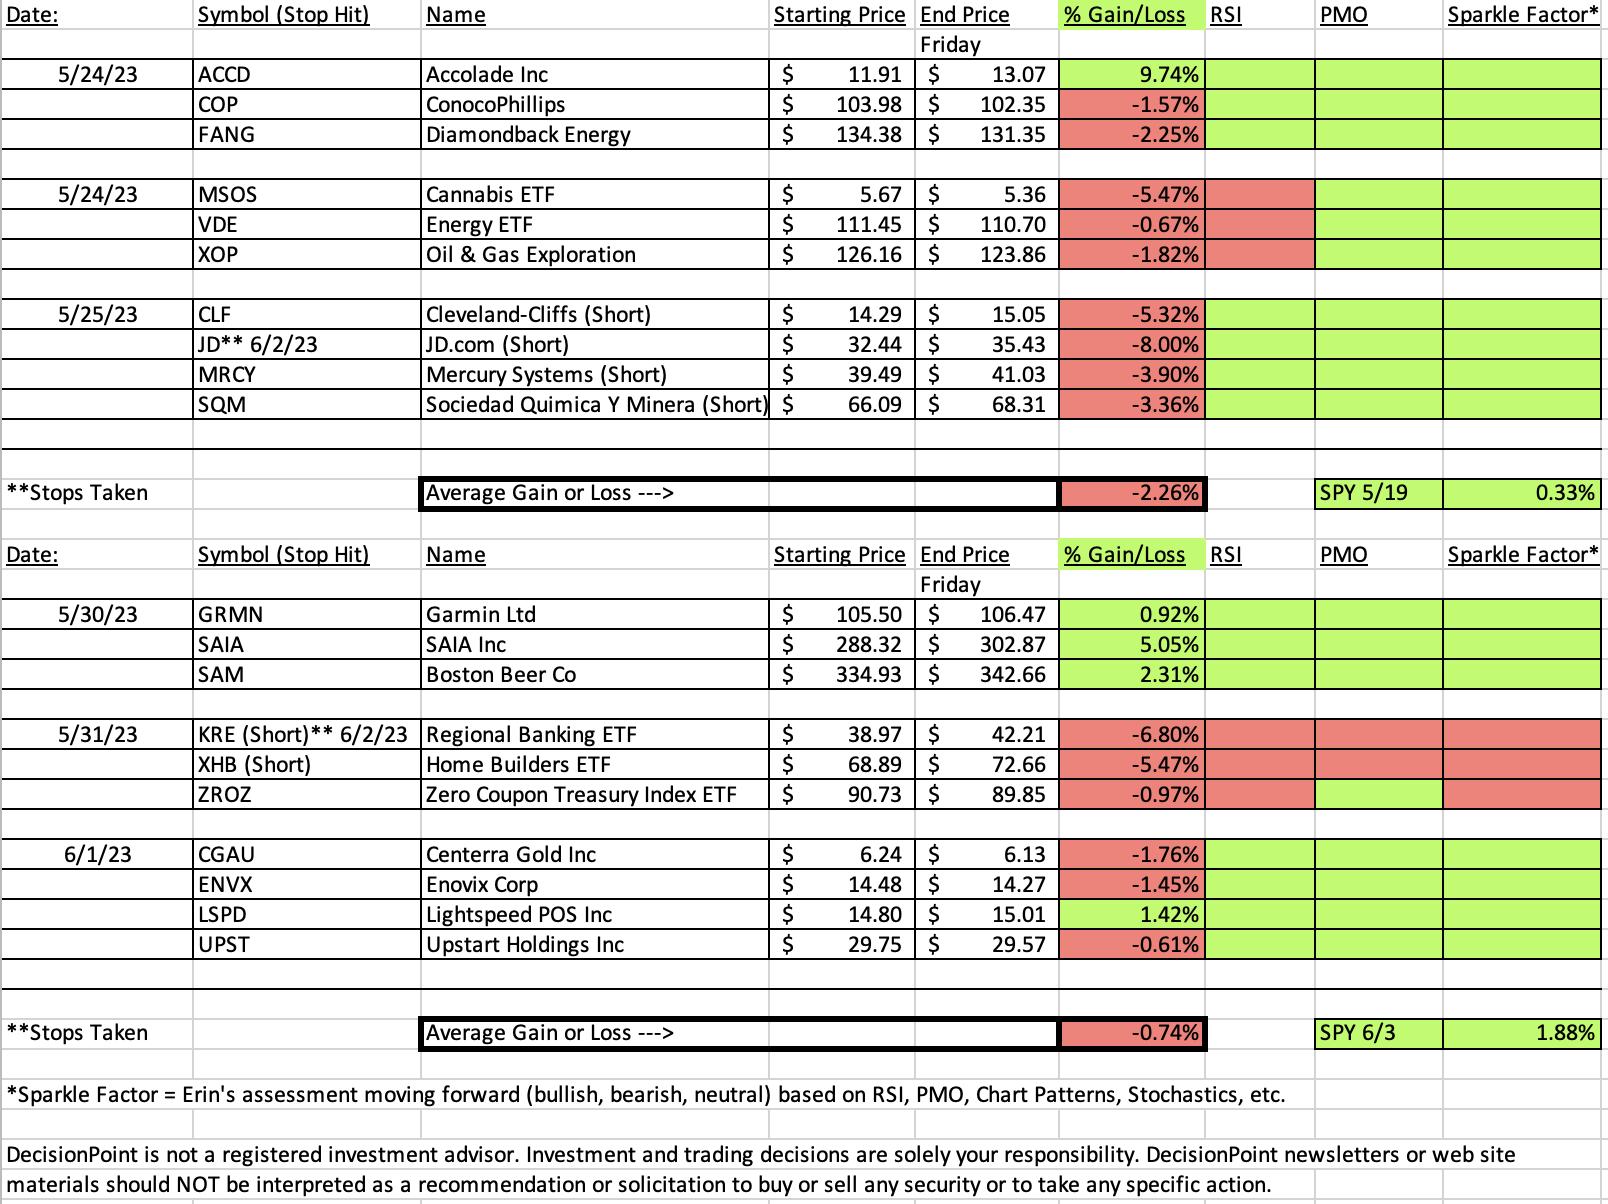
The market had its way with the bears last week so the two short positions I selected were hit hard. One of the prior week's shorts was stopped out, along with one this week. On the bright side, longs are working given the strong rally in the SP500.
I will be writing a free article today on SPY versus equally-weighted RSP. If you look at RSP you can see what we've been looking for on the SPY, but mega-caps held court and kept the SPY propelling upward. Today was a different day, however. Today RSP was up 52% more than the SPY. Today's rally was broad and could mark a turning point. Shorts should come off the table if we're correct so consider the shorts that are currently on the "Diamond in the Rough" spreadsheet as "off".
This week's "Darling" was SAIA Inc (SAIA) which finished up 5.05% since being picked on Tuesday. The "Dud" was the short on the Regional Banking ETF (KRE) which triggered its stop on today's rally.
I decided to stick with the Diamond Mine Sector to Watch and Industry Group to Watch. I'll discuss later.
I forgot to send out the recording for the Diamond Mine this morning, I'm very sorry. You'll find the recording link below.
Hope you have a great weekend!
Good Luck & Good Trading,
Erin

RECORDING LINK (6/2/2023):
Topic: DecisionPoint Diamond Mine (6/2/2023) LIVE Trading Room
Recording Link HERE
Passcode: June#2nd
REGISTRATION for 6/9/2023:
When: Jun 9, 2023 09:00 AM Pacific Time (US and Canada)
Topic: DecisionPoint Diamond Mine (6/9/2023) LIVE Trading Room
Register in advance for this webinar: HERE
After registering, you will receive a confirmation email containing information about joining the webinar.

Our latest DecisionPoint Trading Room recording (5/22/2023):
A few items about the spreadsheet: I've put on the spreadsheet whether the RSI is positive (green) or negative (red). The PMO column tells you if it is rising (green) or falling (red). Finally I've added my own "Sparkle Factor" that gives you my assessment going forward, bullish (green), bearish (red) or neutral (gray). The Sparkle Factor is basically my thoughts on whether I expect it to rise or fall. A neutral means it could really go either way so it could be added to a watch list. If you're in a stock I consider "neutral" going forward, the ball is in your court.
Darling:
SAIA Inc. (SAIA)
EARNINGS: 07/27/2023 (BMO)
Saia, Inc. operates as a transportation holding company. The firm through its wholly-owned subsidiaries provides regional and interregional less-than-truckload (LTL) services through a single integrated organization. The firm also offers other value-added services, including non-asset truckload, expedited and logistics services across North America. The company was founded by Louis Saia, Sr. in 1924 and is headquartered in Johns Creek, GA.
Predefined Scans Triggered: P&F Double Top Breakout and P&F Bearish Signal Reversal.
Below are the commentary and chart from Tuesday:
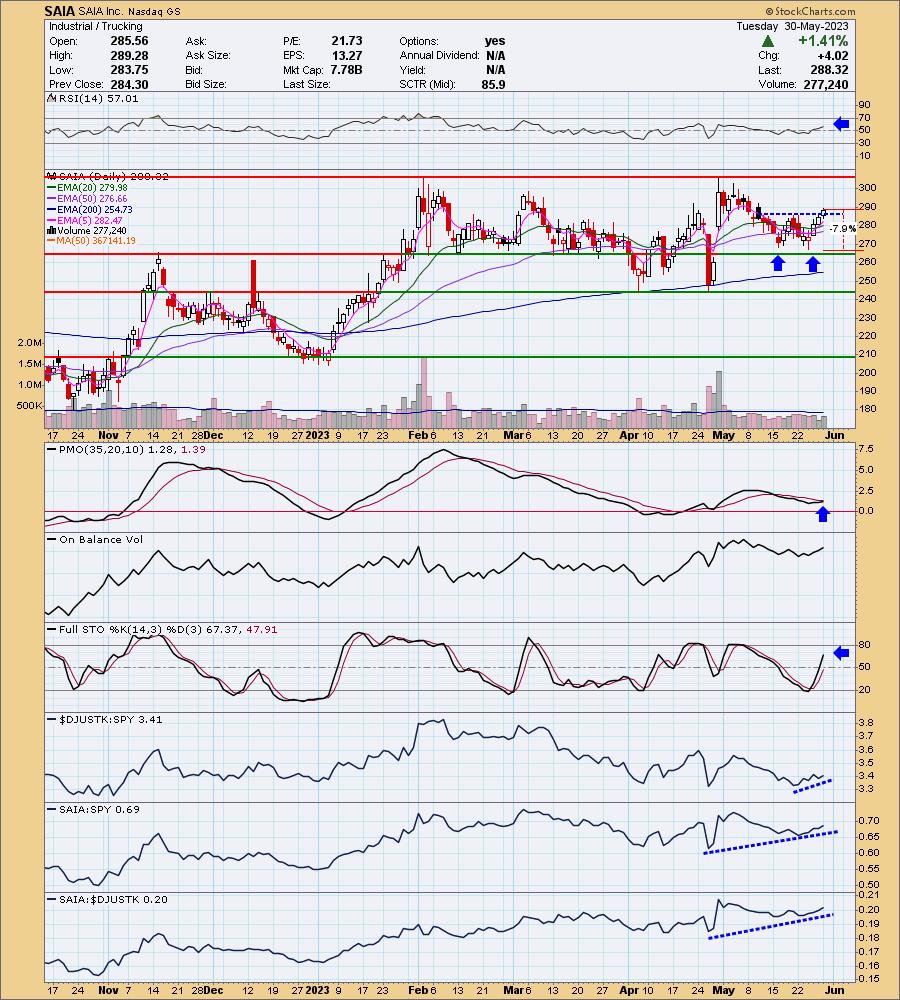
"SAIA is unchanged in after hours trading. This has a nice little double-bottom that was confirmed with today's breakout above the confirmation line. It has been range bound for some time, but this is a nice set up with indicators configured bullishly. The RSI is in positive territory and rising. The PMO is nearing a Crossover BUY Signal. Stochastics are rising strongly in positive territory. The group is starting to see some outperformance. This stock appears to be one of the strongest in the group based on its relative strength. While I'm not enamored of the Trucking group, this one should see some upside. The stop is a bit deep but needs to be set below the double-bottom pattern at 7.9% or $265.54."
Here is today's chart:
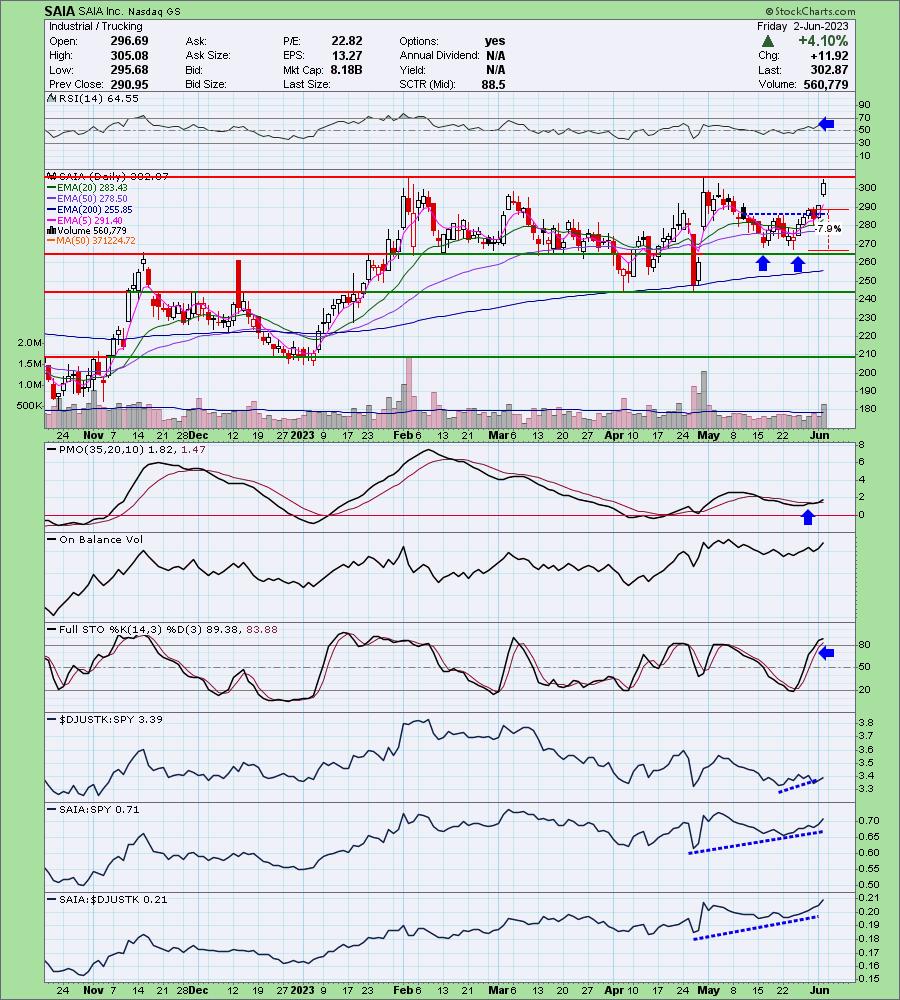
The bullish double-bottom met its upside target in no time with today's hefty rally. Given the strength of the indicators right now, I doubt that it will have any problem busting out. It's been a strong out-performer and I suspect it will continue to outperform both the group and the SPY.
Don't forget, on Thursdays I look at reader-requested symbols, so shoot me an email at erin@decisionpoint.com. I read every email I receive and try to answer them all!
Dud:
SPDR S&P Regional Banking ETF (KRE)
EARNINGS: N/A
KRE tracks an equal-weighted index of US regional banking stocks. Click HERE for more information.
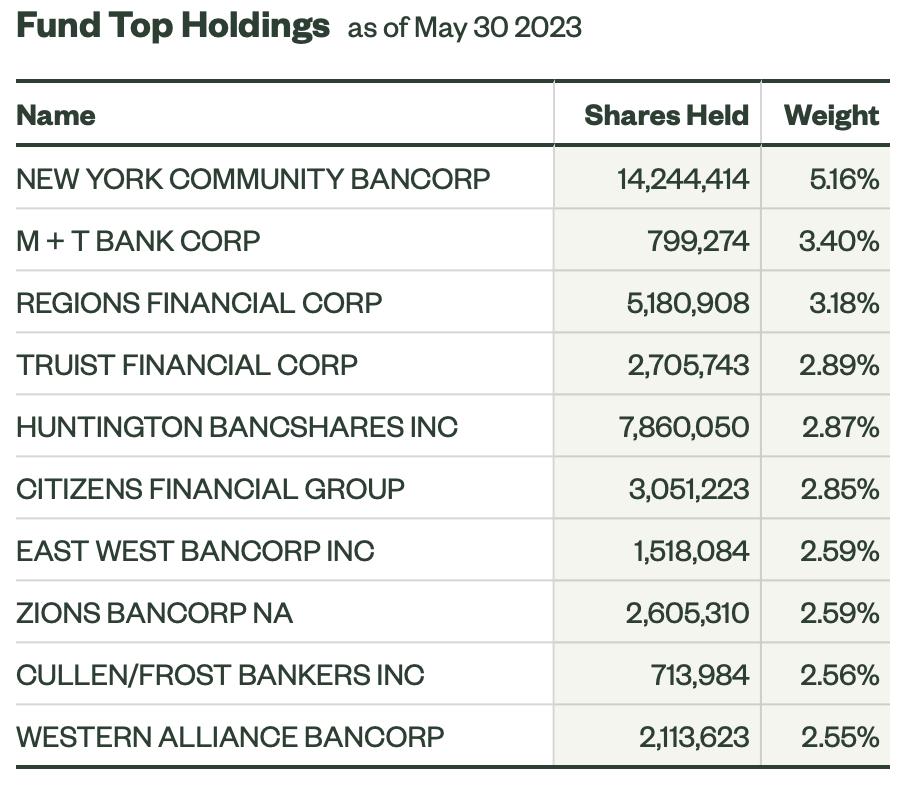
Predefined Scans Triggered: Elder Bar Turned Red, Parabolic SAR Sell Signals and P&F High Pole.
Below are the commentary and chart from Wednesday:
"KRE is down -0.31% in after hours trading. KRE made an attempt at a comeback, but it hit overhead resistance and was turned away. The chart has definitely gone south since. The RSI is now negative and the PMO has topped well below the zero line which is especially bearish. The OBV is confirming the downtrend and Stochastics are dropping. Even relative strength has been poor. This looks good for a short with a 6.8% upside stop around $41.62."
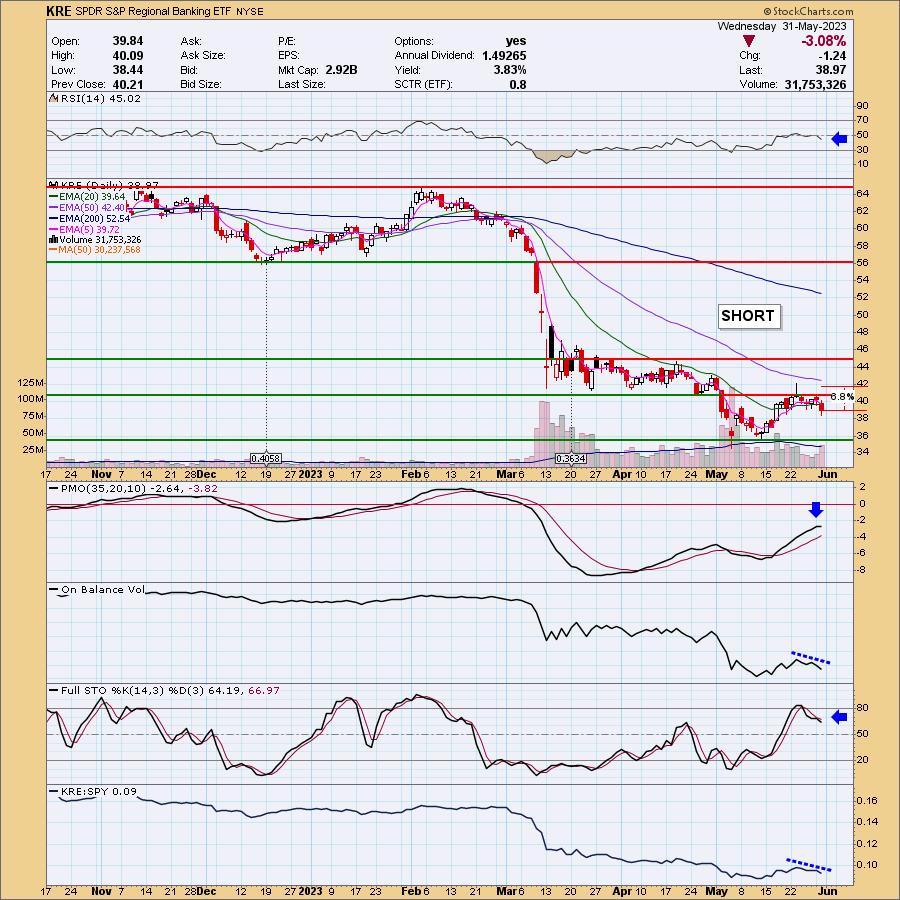
Here is today's chart:
The market rally took the wind out of the sails of all of our shorts which I'm am now listing as "closed". This group has been entirely beat down and will offer some interesting upside. I just believe there are better choices given this group still has problems. The indicators were very negative as noted in the above chart, but two days of rally, particularly today's 6%+ has shifted them all positive.
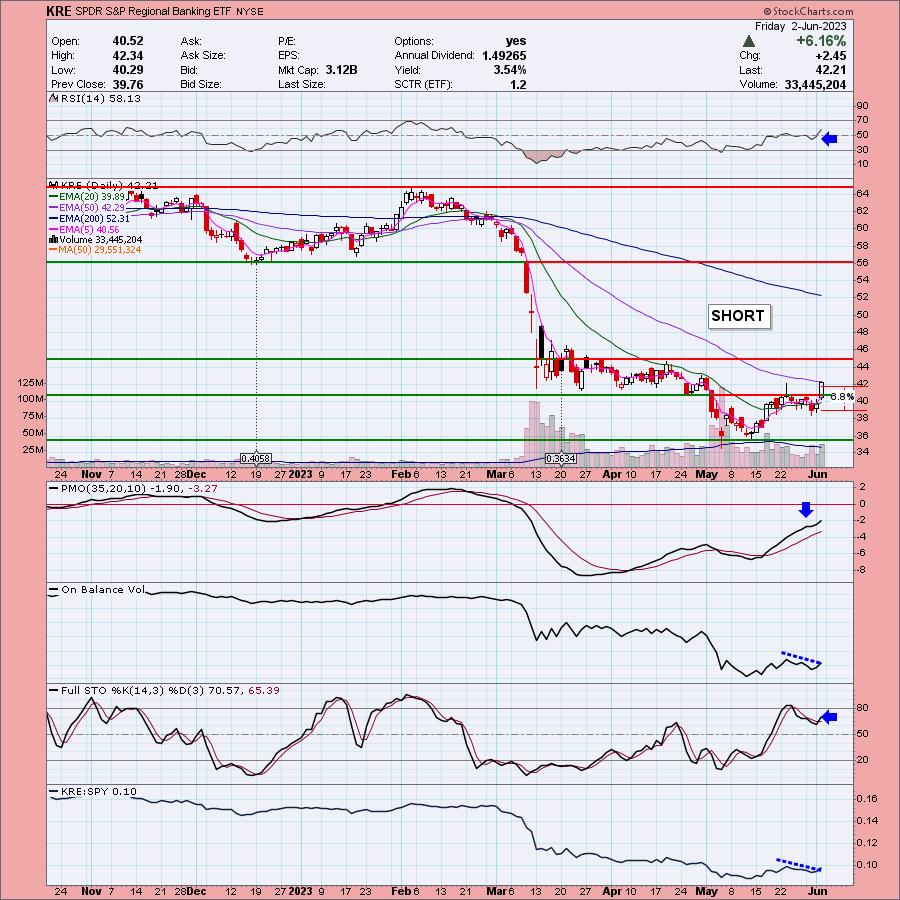
THIS WEEK's Sector Performance:
DecisionPoint Sector Scoreboard (Mechanical Trend Model Signals):
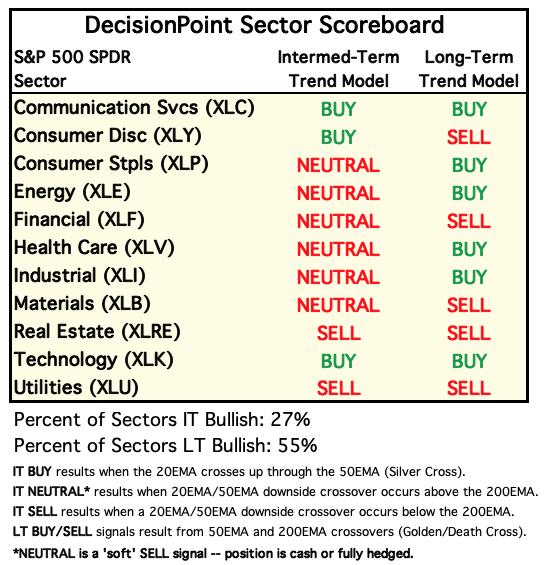
Click Here to view Carl's annotated Under the Hood ChartList!
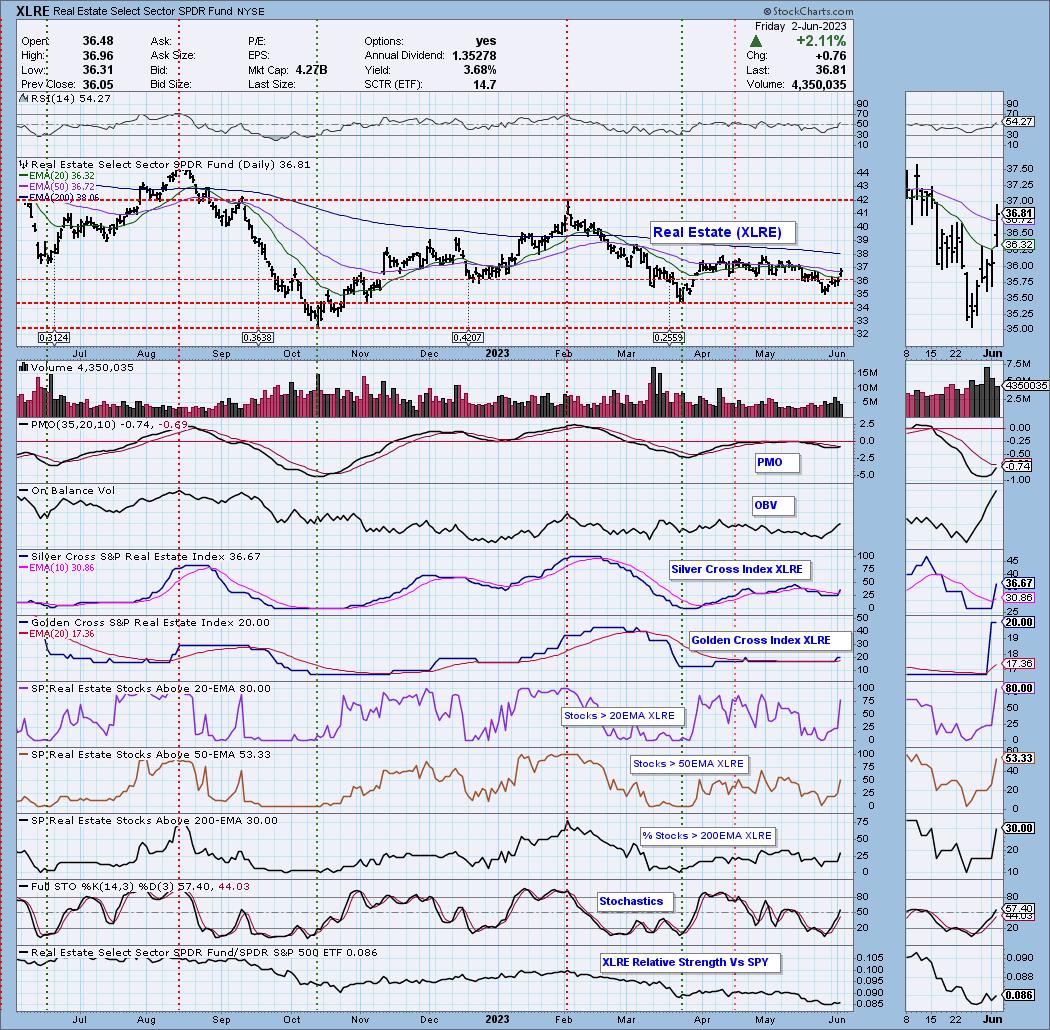
Sector to Watch: Real Estate (XLRE)
Honestly there were plenty of good charts among the sectors after today's strong rally, but ultimately I like Real Estate moving into next week. The PMO is nearing a positive crossover and the RSI just moved into positive territory. The OBV shows strong volume coming in on this rally. Today the Silver Cross Index saw a Bull Shift positive crossover the signal line. The Golden Cross Index is above its signal line and participation expanded greatly on today's rally. Stochastics are back in positive territory. I believe this sector will do well next week, but many of the sectors will.
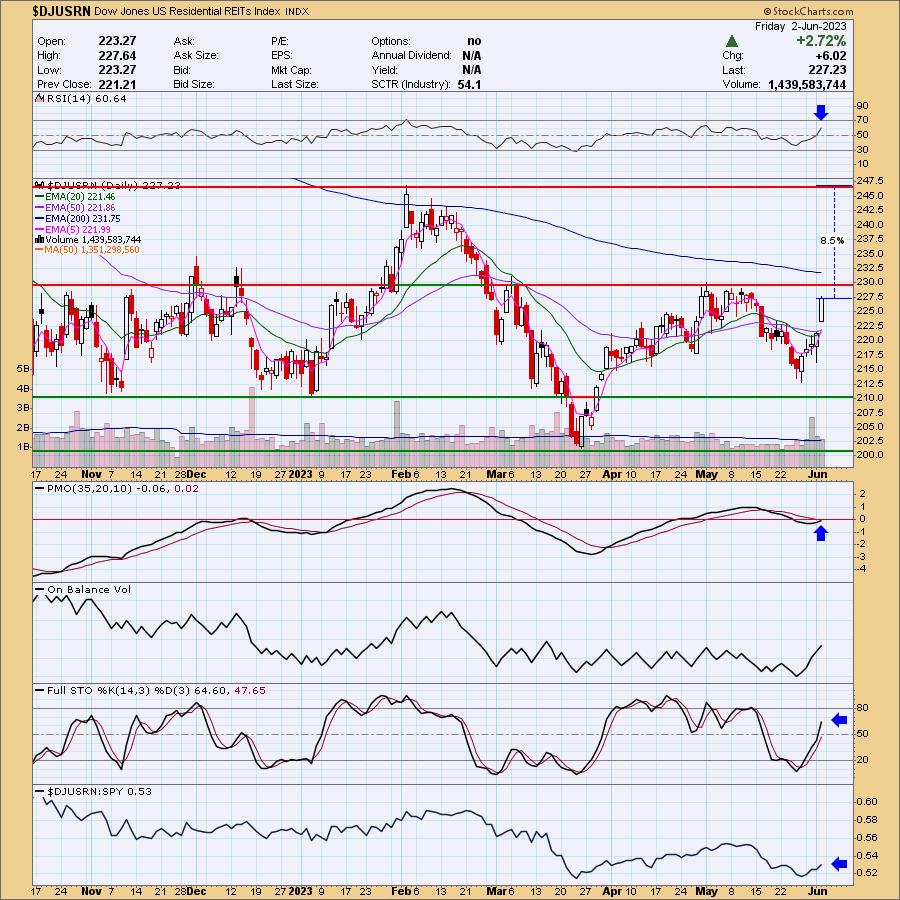
Industry Group to Watch: Residential REITs ($DJUSRN)
I don't have an ETF for this industry group but I do have two symbols that look good from the group, ESS and IRT. Take a look at those very bullish setups. The group has more to choose from but those two stocks are outperforming in a big way. If this group gets past short-term resistance, it could easily put in gains over 8% in the near term.
Go to our Sector ChartList on DecisionPoint.com to get an in-depth view of all the sectors. On StockCharts.com you can find the Industry Summary.
Good Luck & Good Trading!
- Erin
erin@decisionpoint.com
Full Disclosure: I'm 10% long, 7% short. It will be a busy Monday as I shift out of shorts into longs. A stock in this morning's trading room is on my radar: ABNB.
Watch the latest episode of the DecisionPoint Trading Room with Carl & Erin Swenlin on Mondays 3:00p EST!
Technical Analysis is a windsock, not a crystal ball. --Carl Swenlin
NOTE: The stocks reported herein are from mechanical trading model scans that are based upon moving average relationships, momentum and volume. DecisionPoint analysis is then applied to get selections from the scans. The selections given should prompt readers to do a chart review using their own analysis process. This letter is not a call for a specific action to buy, sell or short any of the stocks provided. There are NO sure things or guaranteed returns on the selection of "diamonds in the rough."
Helpful DecisionPoint Links:
DecisionPoint Shared ChartList and DecisionPoint Chart Gallery
Price Momentum Oscillator (PMO)
Swenlin Trading Oscillators (STO-B and STO-V)
(c) Copyright 2023 DecisionPoint.com