
I'll be on Making Money with Charles Payne next Friday 2p ET. Keep an eye out!
I had two mailbag questions that I thought I would address today. Both are excellent and are questions I've received before.
RSI – what does RSI mean these days. Should we be redefining what overbought means?
Answer: Of course the actual initials stand for Relative Strength Index, but I realize that is not the question. A little background on the RSI: It takes the prior two week trading range and plots where price currently lies within. Typically overbought territory is 70+, but I do know some technicians who use 80+. When price gets overbought (70/80+) it can signal a near-term decline ahead. However, if you have a strong stock, it can stay overbought for weeks. I don't think we need to redefine it, we need to understand that in a bull market, overbought conditions can persist. I prefer not to engage in an overbought stock, but I will hold one if the other technicals are positive.
How do you manage your own internal psychology? For example ; I owned SYM but sold it clearly too early. How do you handle all the things that don't go right?
Answer: Selective memory loss. I take the stock completely off my radar and refocus on new opportunities. Watching that chart has no value unless it's a pet stock that you tend to move in and out of. I found this strategy to work best. You'll be amazed how quickly those symbols fade when you're in something new and exciting. For the record I sold it too early too, but made a profit. I just haven't revisited the chart to add insult to injury.
I had more requests than usual so bear with me if I don't get back to you on your selections that were not chosen today. I found all of them to be viable in most cases, but I had to select only four. A few were on the overbought side after incredible rallies today so they were excluded.
Good Luck & Good Trading,
Erin
Today's "Diamonds in the Rough": ARCO, ASPN, MG and UNG.
Other requests: AMD, U, YINN, PTON, CPS, TXG, EWQ, LEN, TGLS and SNOW.
** JULY VACATION **
I will be in Europe 7/14 - 7/28 so there will not be any Diamonds reports or trading rooms during that time. All subscribers with active subscriptions on 7/28 will be compensated with two weeks added to their renewal date.

RECORDING LINK (6/9/2023):
Topic: DecisionPoint Diamond Mine (6/9/2023) LIVE Trading Room
Recording Link
Passcode: June#8th (Sorry about mixing up the date in the password)
REGISTRATION for 6/16/2023:
When: Jun 16, 2023 09:00 AM Pacific Time (US and Canada)
Topic: DecisionPoint Diamond Mine (6/16/23) LIVE Trading Room
Register in advance for this webinar HERE
After registering, you will receive a confirmation email containing information about joining the webinar.

Here is the last recording (6/12):
Welcome to DecisionPoint Diamonds, wherein I highlight ten "Diamonds in the Rough" per week. These are selected from the results of my DecisionPoint Scans which search for stocks that could benefit from the trend and condition of the market. Remember, these are not recommendations to buy or sell, but are the most interesting of the stocks that surfaced in my scans. My objective is to save you the work of the initial, tedious culling process, but you need to apply your own analysis to see if these stocks pique your interest as well. There are no guaranteed winners here!
"Predefined Scans Triggered" are taken from StockCharts.com using the "Symbol Summary" option instead of a "SharpChart" on the workbench.
Stop levels are all rounded down.
Arcos Dorados Holdings Inc. (ARCO)
EARNINGS: 08/09/2023 (BMO)
Arcos Dorados Holdings, Inc. engages in the operation of restaurants. The firm operates and franchises McDonald's restaurants in the food services industry through its subsidiaries. It operates through the following geographical segments: Brazil, Caribbean Division, North Latin America division (NOLAD), and South Latin America division (SLAD). The Caribbean Division segment is composed of Aruba, Curacao, Colombia, French Guyana, Guadeloupe, Martinique, Puerto Rico, Trinidad and Tobago, the U.S. Virgin Islands of St. Croix, and St. Thomas and Venezuela. The SLAD segment consists of Argentina, Chile, Ecuador, Peru, and Uruguay. The NOLAD segment refers to Costa Rica, Mexico, and Panama. The company was founded on August 3, 2007 and is headquartered in Montevideo, Uruguay.
Predefined Scans Triggered: Moved Above Upper Keltner Channel, New 52-week Highs, Moved Above Upper Bollinger Band, Moved Above Upper Price Channel, P&F Ascending Triple Top Breakout and P&F Double Top Breakout.
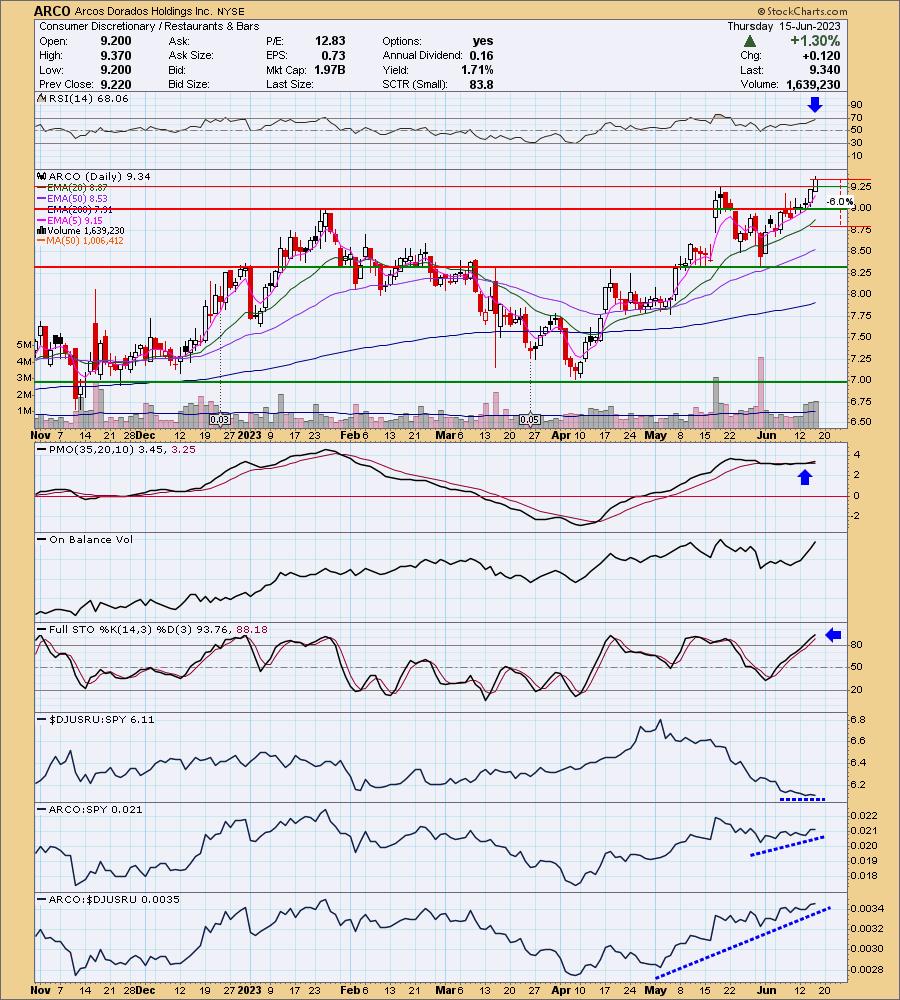
ARCO is up +1.71% in after hours trading. It is about to challenge its 2017 high and given the bullish daily and weekly charts, we should see that level exceeded. Today's breakout put it at new 52-week highs. The RSI is positive and not yet overbought and better is the PMO BUY Signal. I'd like to see the PMO put more margin between it and its signal line to prevent a whipsaw SELL. Volume is coming in these past five trading days. Stochastics are above 80 and rising even higher. Relative strength for the group is settling in, but ARCO doesn't seem to need the group's help as it is outperforming the SPY on its own. It certainly is a leader in this industry group. The stop can be set at 6% or $8.77.
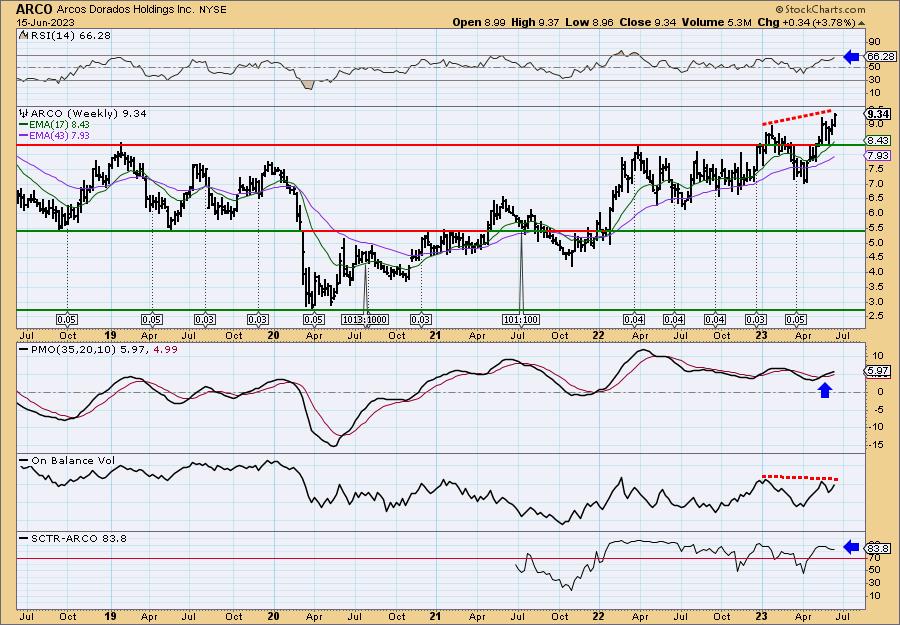
I only see one problem on the weekly chart and that is a negative OBV divergence. I don't think it is enough to label this a short-term investment only. This chart has longer-term bullish implications. The weekly RSI is positive, rising and not overbought. The weekly PMO is on a Crossover BUY Signal. The StockCharts Technical Rank (SCTR) is well within the "hot zone" above 70*. Since it is at 52-week highs, consider an upside target of about 16% or $10.83.
*If a stock is in the "hot zone" above 70, it implies that it is stronger than 70% of its universe (large-, mid-, small-caps and ETFs) primarily in the intermediate to long terms.
Aspen Aerogels, Inc. (ASPN)
EARNINGS: 08/02/2023 (AMC)
Aspen Aerogels, Inc. engages in designing, developing, and manufacturing aerogel insulation used primarily in the energy infrastructure and building materials markets. Its products include Cryogel, Pyrogel, and Spaceloft. The company was founded by Hamed S. Borhanian, Patrick J. Piper, and Kang P. Lee in May 2001 and is headquartered in Northborough, MA.
Predefined Scans Triggered: Elder Bar Turned Green, Moved Above Upper Bollinger Band and Moved Above Upper Price Channel.
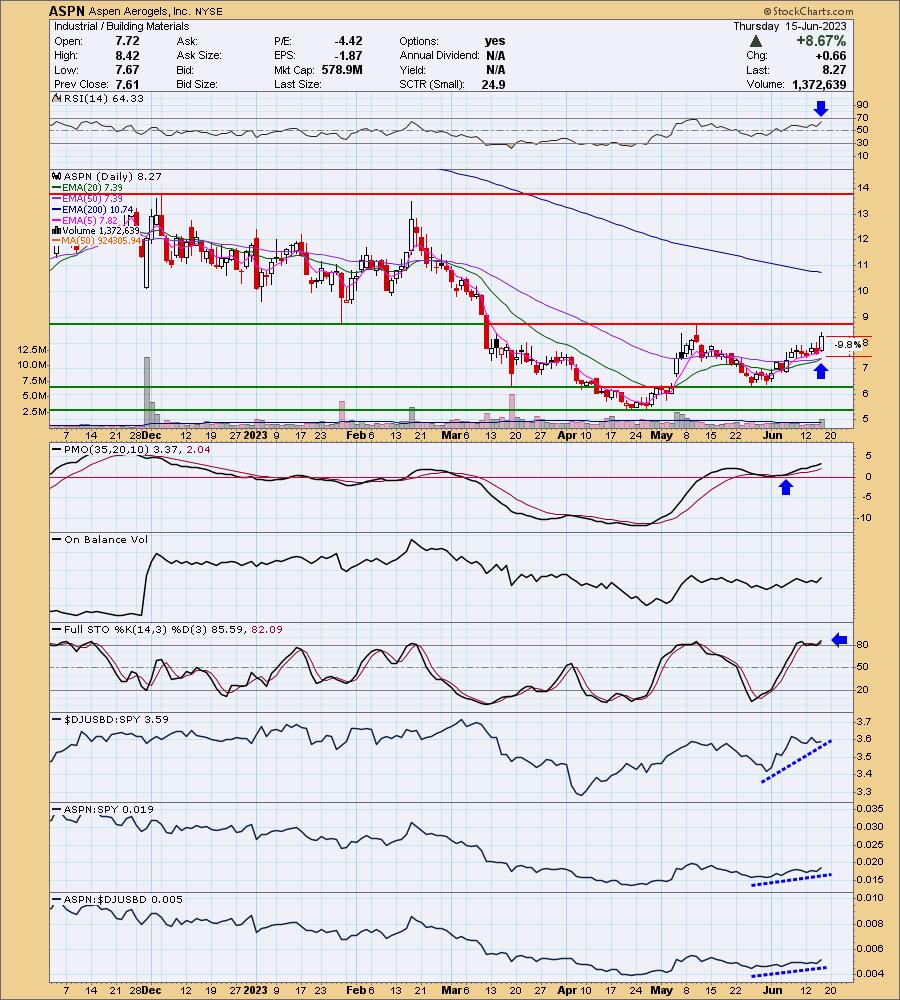
ASPN is up +2.54% in after hours trading. My only problem with this chart is that overhead resistance is so close. It was also a giant rally today that will eventually need to be digested. Based on after hours trading, it doesn't look like resistance will be much of problem. The RSI is positive and rising. There was nearly a PMO Surge above the signal line in late May, but instead it whipsawed back and forth out of and then back into a BUY Signal. It is still a great looking PMO that isn't overbought. Stochastics have stayed above 80 and are rising again. The group overall has been outperforming in June, but cooled a little in mid-June. ASPN is slowly outperforming the group and consequently the SPY. The stop is set deeply based on today's 8.5%+ rally. I've set it at 9.8% or $7.45.
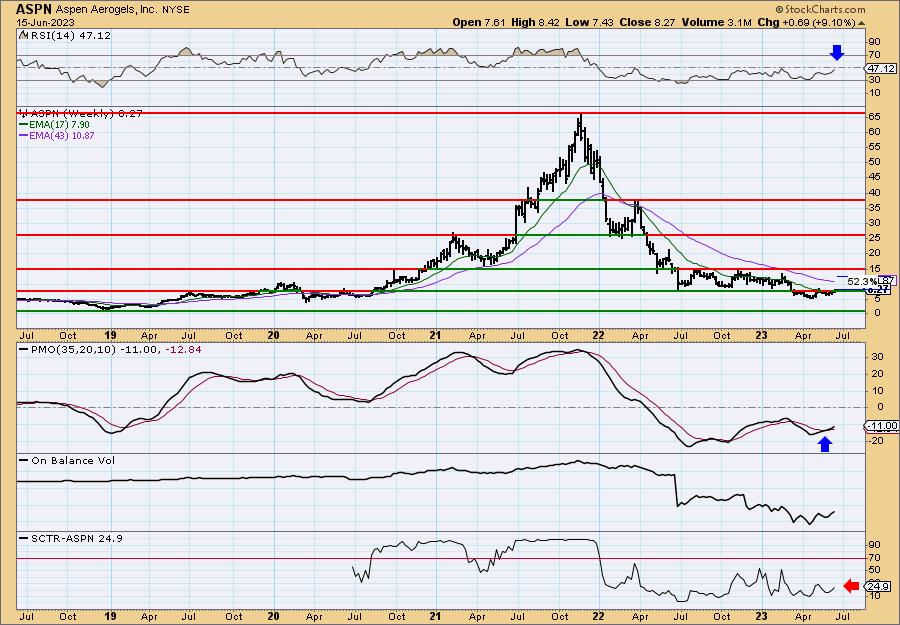
If price gets above resistance, the next trading range is wide based on this stock's low price. I've listed upside potential at over 52% but it could be even more. The weekly RSI is negative but nearing positive territory. The weekly PMO just saw a Crossover BUY Signal. The SCTR isn't great. I think this one has the potential to be an intermediate-term investment.
Mistras Group Inc. (MG)
EARNINGS: 08/02/2023 (AMC)
MISTRAS Group, Inc. engages in the provision of technology-enabled asset protection solutions. The firm serves the oil and gas, aerospace, power, infrastructure, and manufacturing markets. It operates through the following segments: Services, International Offers Services, and Products and Systems. The Services segment provides asset protection solutions primarily in North America, consisting primarily of non-destructive testing, inspection, mechanical, and engineering services. The International Offers Services segment offers services, products, and systems to markets within Europe, the Middle East, Africa, Asia except, China and South Korea, which are served by the Products and Systems segment, and South America. The Products and Systems segment designs, manufactures, sells, installs, and services the company's asset protection products and systems, including equipment and instrumentation, mainly in the United States. The company was founded by Sotirios J. Vahaviolos in 1978 and is headquartered in Princeton Junction, NJ.
Predefined Scans Triggered: New CCI Buy Signals, Moved Above Upper Bollinger Band and Moved Above Upper Price Channel.
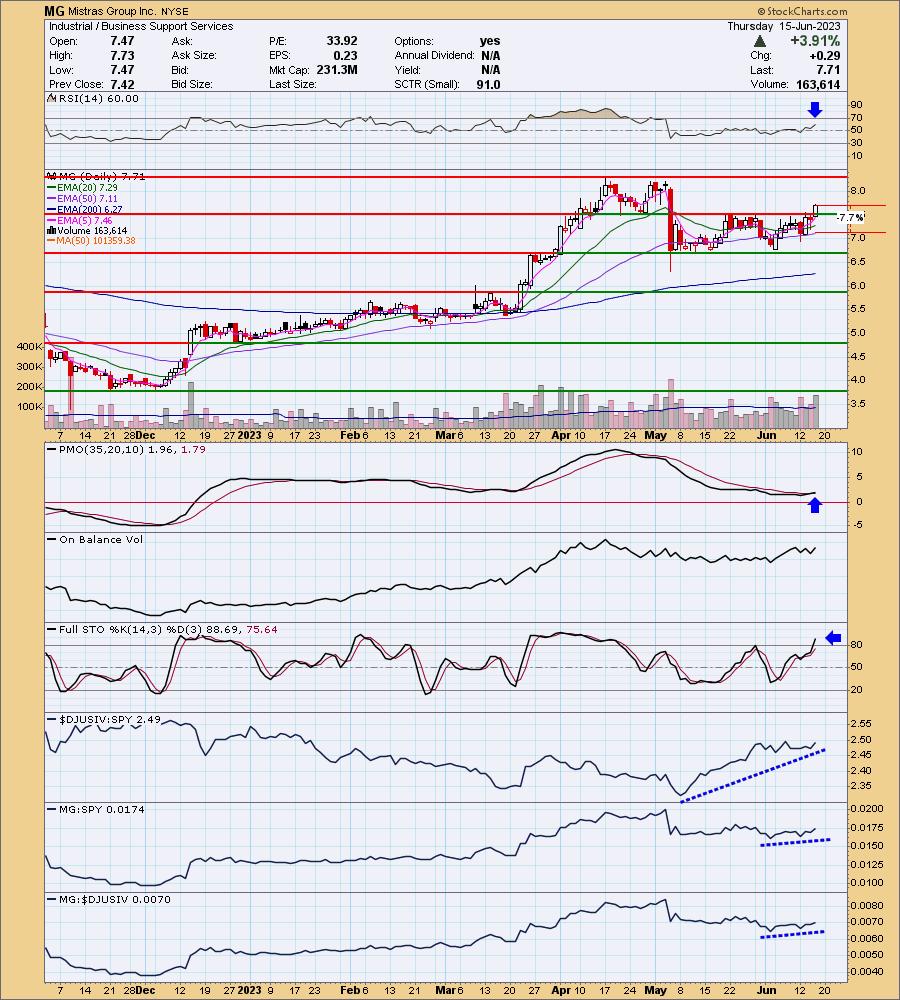
MG is unchanged in after hours trading. Overhead resistance was overcome in the short term, next up are the April/May highs. The RSI is positive and rising. The PMO is on a new Crossover BUY Signal. Stochastics have moved above 80. The group is on fire and while MG isn't a major player, it is beginning to rise to the occasion. The stop is set at 7.7% at the 50-day EMA or $7.11.
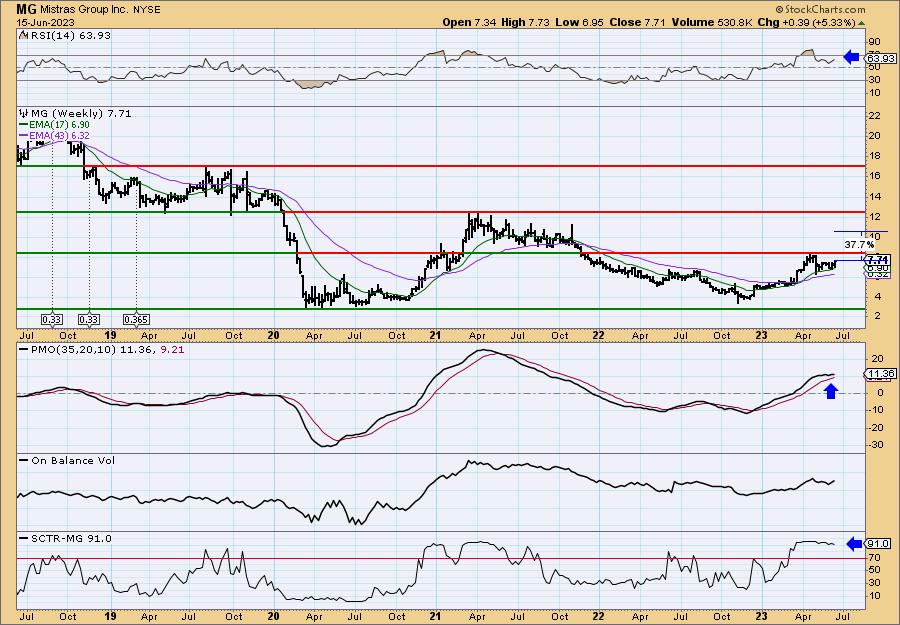
The weekly chart is favorable enough to consider this an intermediate-term investment, but I'd really like to see overhead resistance broken. The weekly PMO has surged above the signal line and the weekly RSI is positive, rising and not overbought. The SCTR is in the hot zone above 70. Upside potential should it overcome resistance could be more than I've listed. I opted to make the target about halfway up the next trading range.
United States Natural Gas Fund (UNG)
EARNINGS: N/A
UNG holds near-month futures contracts in natural gas, as well as swap contracts.
Predefined Scans Triggered: P&F Descending Triple Bottom Breakdown, Parabolic SAR Buy Signals, Entered Ichimoku Cloud and P&F Double Bottom Breakout.
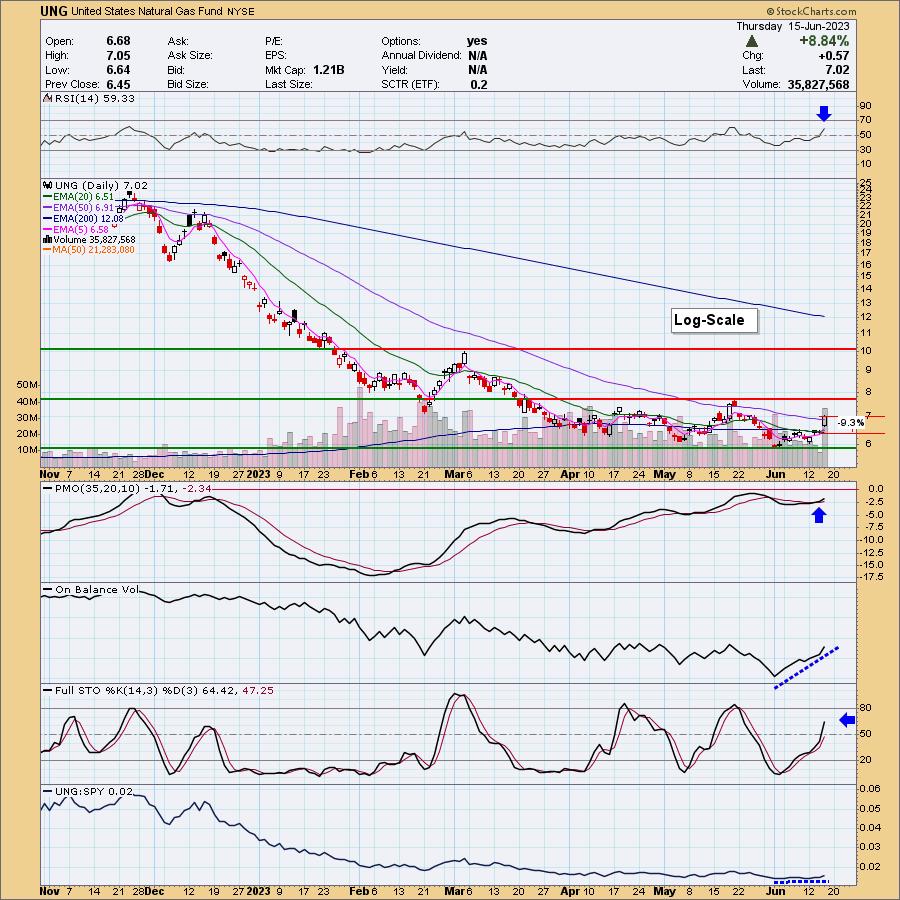
UNG is down -0.14% in after hours trading. The chart actually looks quite bullish right now. Notice that the last low was higher than the previous low. This is the first time we've seen this in months. It also forms the second bottom in a small double-bottom pattern. The upside target was already met with today's rally, but that is the minimum upside target. There is a relatively new PMO Crossover BUY Signal and volume is coming in strong. Stochastics are rising strongly and relative strength has finally stopped declining. The stop is deeply set due to today's big rally at 9.3% or $6.36.
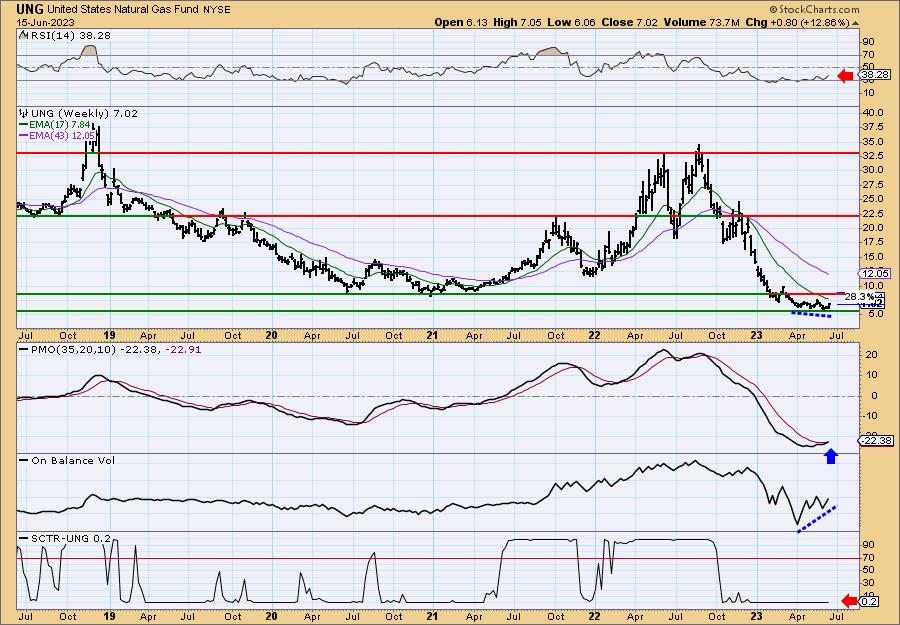
We are finally seeing some positive action out of the weekly PMO. It looks like it will trigger a Crossover BUY Signal when the weekly chart goes final tomorrow after the close. There is a positive OBV divergence with price lows. The SCTR is horrible and the weekly RSI is negative so this rally may fizzle when resistance is met at the 2020 lows.
Don't forget, on Thursdays I look at reader-requested symbols, click HERE to send me an email. I read every email I receive and try to answer them all!
Current Market Outlook:
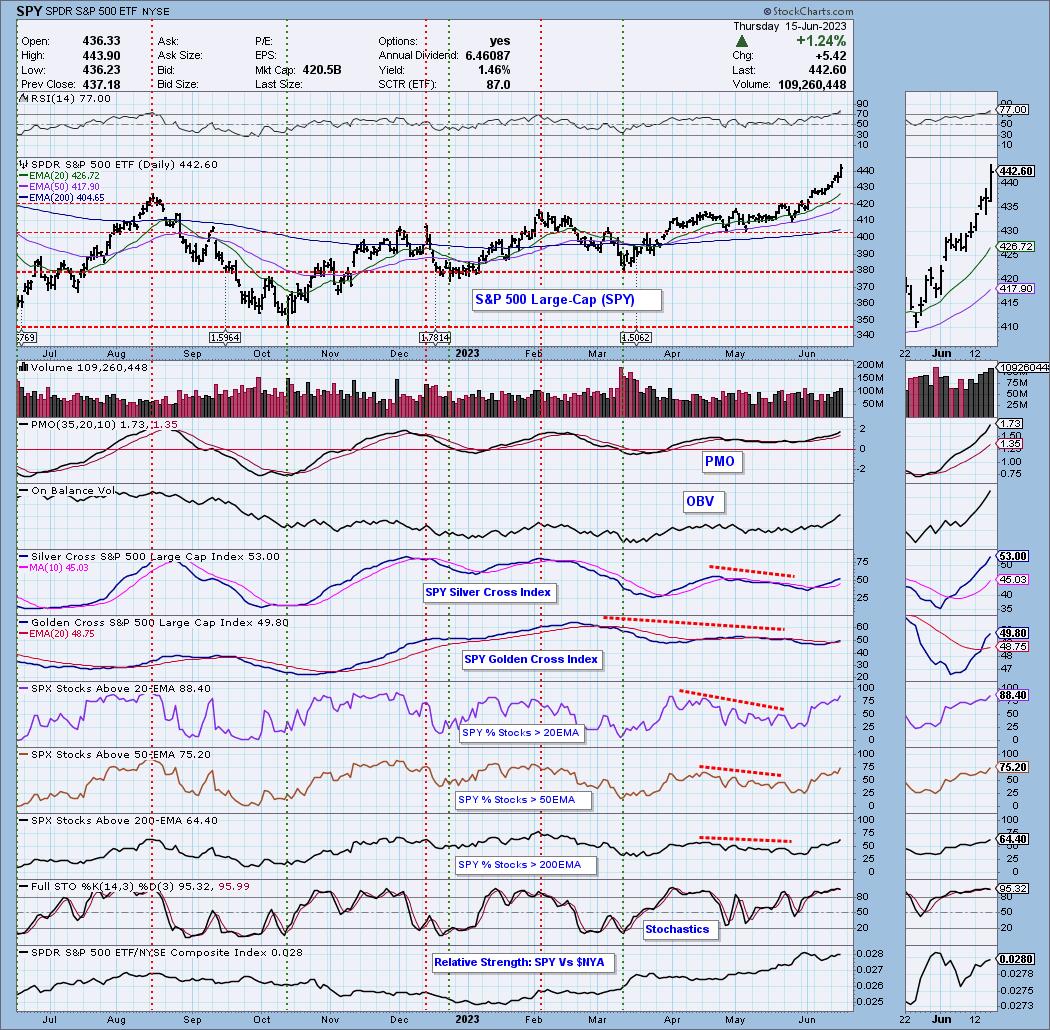
Market Environment: It is important to consider the odds for success by assessing the market tides. The following chart uses different methodologies for objectively showing the depth and trend of participation for intermediate- and long-term time frames.
- The Silver Cross Index (SCI) shows the percentage of SPX stocks on IT Trend Model BUY signals (20-EMA > 50-EMA)
- The Golden Cross Index (GCI) shows the percentage of SPX stocks on LT Trend Model BUY signals (50-EMA > 200-EMA)
Don't forget that as a "Diamonds" member, you have access to our GCI/SCI curated ChartList on DecisionPoint.com. You'll find it under "Members Only" links on the left side on the Blogs and Links Page.
Here is the current chart:
Full Disclosure: I am 40% long, 0% short.
I'm required to disclose if I currently own a stock I mention and/or may buy/short it within the next 72 hours.
"Technical Analysis is a windsock, not a crystal ball." - Carl Swenlin
(c) Copyright 2023 DecisionPoint.com
Watch the latest episode of DecisionPoint Trading Room with Carl & Erin Swenlin on Mondays 7:00p EST or on the DecisionPoint playlist on the StockCharts TV YouTube channel here!
NOTE: The stocks reported herein are from mechanical trading model scans that are based upon moving average relationships, momentum and volume. DecisionPoint analysis is then applied to get five selections from the scans. The selections given should prompt readers to do a chart review using their own analysis process. This letter is not a call for a specific action to buy, sell or short any of the stocks provided. There are NO sure things or guaranteed returns on the daily selection of "Diamonds in the Rough."
Regarding BUY/SELL Signals: The signal status reported herein is based upon mechanical trading model signals and crossovers. They define the implied bias of the price index/stock based upon moving average relationships and momentum, but they do not necessarily call for a specific action. They are information flags that should prompt chart review. Further, they do not call for continuous buying or selling during the life of the signal. For example, a BUY signal will probably (but not necessarily) return the best results if action is taken soon after the signal is generated. Additional opportunities for buying may be found as price zigzags higher, but the trader must look for optimum entry points. Conversely, exit points to preserve gains (or minimize losses) may be evident before the model mechanically closes the signal.
Helpful DecisionPoint Links:
Price Momentum Oscillator (PMO)
Swenlin Trading Oscillators (STO-B and STO-V)
For more links, go to DecisionPoint.com