
I had a handful of Reader Requests today, likely the scarcity is due to the weakness in the market. I did find four that I liked. One came up on one of my scans today so that was an easy add. One I had listed as a runner-up this week. One looks interesting on a pullback and the last one is from the Steel industry group which is heating up.
I wanted to mention that I do put stops on all of the "Diamonds in the Rough" but that doesn't mean you have to wait for the stop to be hit to get out. Typically the PMO is going to give you a heads up before support is lost or before a decline picks up speed. I mention this because the market is very weak and there is higher risk associated with all of your long positions right now.
When the market turns as it has it is time to build watch lists and limit exposure. ALL of your positions should be managed in the short term. I have pared back exposure today to 10% long and increased my short positions to 8%.
Good Luck & Good Trading,
Erin
Today's "Diamonds in the Rough": BRBR, HXL, MTDR and TMST.
Other requests: CCOI, RSI, WOR, WT, RBLX and PEN.

RECORDING LINK (8/11/2023):
Topic: DecisionPoint Diamond Mine (8/4/2023) LIVE Trading Room
Passcode: August#11th
REGISTRATION for 8/18/2023:
When: Aug 18, 2023 09:00 AM Pacific Time (US and Canada)
Topic: DecisionPoint Diamond Mine (8/18/2023) LIVE Trading Room
Register in advance for this webinar HERE.
After registering, you will receive a confirmation email containing information about joining the webinar.

Here is the last recording from 8/14:
Welcome to DecisionPoint Diamonds, wherein I highlight ten "Diamonds in the Rough" per week. These are selected from the results of my DecisionPoint Scans which search for stocks that could benefit from the trend and condition of the market. Remember, these are not recommendations to buy or sell, but are the most interesting of the stocks that surfaced in my scans. My objective is to save you the work of the initial, tedious culling process, but you need to apply your own analysis to see if these stocks pique your interest as well. There are no guaranteed winners here!
"Predefined Scans Triggered" are taken from StockCharts.com using the "Symbol Summary" option instead of a "SharpChart" on the workbench.
Stop levels are all rounded down.
Bellring Brands Inc (BRBR)
EARNINGS: 11/16/2023 (AMC)
BellRing Brands, Inc. is a holding company, which engages in the provision of ready-to-drink (RTD) protein shakes, other RTD beverages, powders, and nutrition bars. It offers products under the brands of Premier Protein and Dymatize, which are distributed across a network of channels including club, food, drug, mass, e-Commerce, specialty, and convenience. The company was founded on March 20, 2019 and is headquartered in St. Louis, MO.
Predefined Scans Triggered: P&F Double Top Breakout.
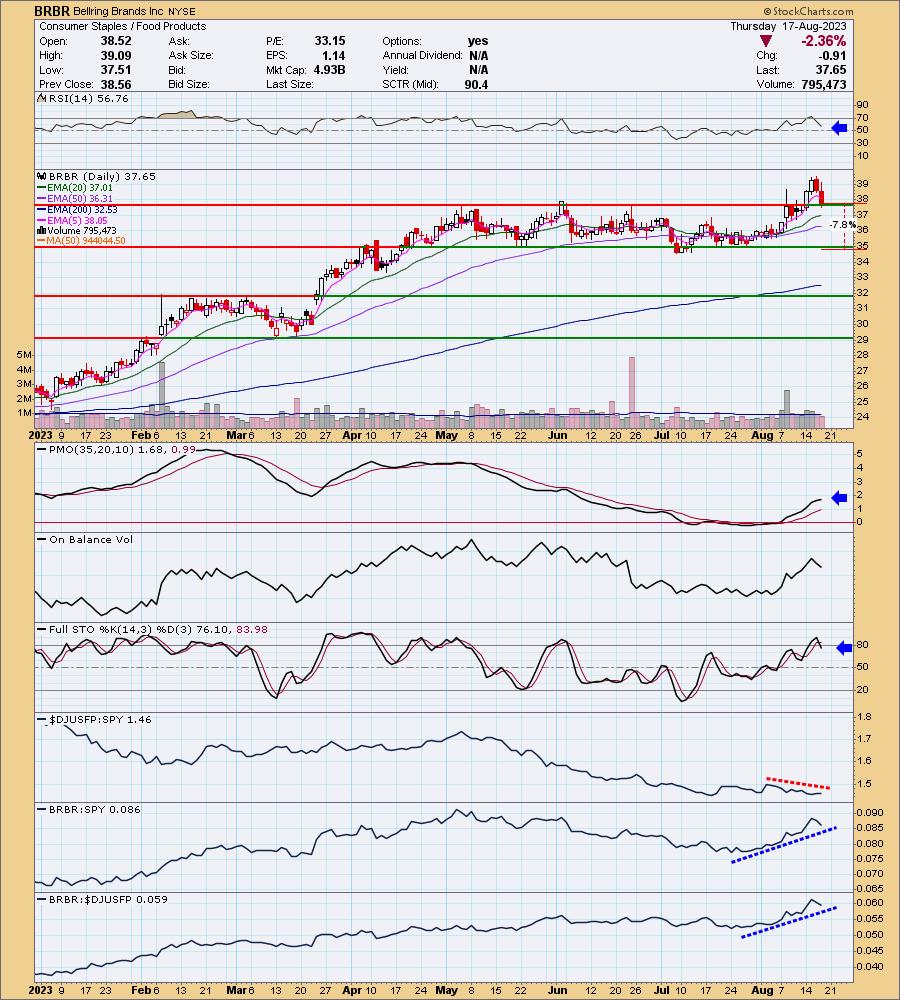
BRBR is down -0.42% in after hours trading. I have low conviction about this pick, but I'm looking at this as an add on a pullback. I do think if after hours trading continues with a decline tomorrow, I'd like this less as currently it is holding support on this pullback. The technicals are fairly good. The RSI while declining, is in positive territory and the PMO is still rising despite the strong decline of the last two days. Stochastics are slightly troubling as they've dropped below 80, but that is definitely due to the pullback. This comes from a defensive sector and industry group so we could see the rally resume if we get some pick up in Consumer Staples (XLP). The group is currently underperforming the market. It has been outperforming the SPY and the group so upside potential is there. The stop is set deeply at 7.8% or $34.71, but I don't think you'd need to wait for it to drop that far before it turns bearish on the PMO.
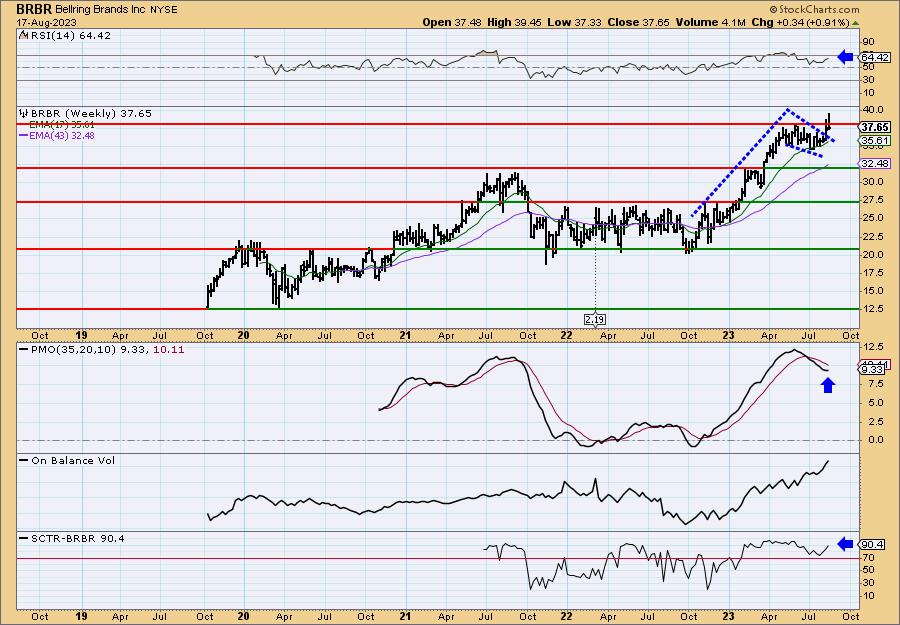
The weekly chart does show promise so a resumption of the rally is certainly possible. There is a large bull flag on the the chart and price did confirm it with a breakout. It hit all-time highs and maybe that is part of the reason it is pulling back. The weekly RSI is positive and the weekly PMO is turning up. The StockCharts Technical Rank (SCTR) is well within the hot zone*.
*If a stock/ETF is in the "hot zone" above 70, it implies that it is stronger than 70% of its universe (large-, mid-, small-caps and ETFs) primarily in the intermediate to long terms.
Hexcel Corp. (HXL)
EARNINGS: 10/23/2023 (AMC)
Hexcel Corp. engages in the development, manufacture, and marketing of lightweight structural materials. It operates through the Composite Materials and Engineered Products segments. The Composite Materials segment includes carbon fiber, specialty reinforcements, resins, prepregs and other fiber-reinforced matrix materials, and honeycomb core product lines and pultruded profiles. The Engineered Products segment refers to the lightweight high strength composite structures, engineered core and honeycomb products with added functionality, and additive manufacturing. The company was founded by Roger C. Steele and Roscoe T. Hughes in 1946 and is headquartered in Stamford, CT.
Predefined Scans Triggered: Elder Bar Turned Green and Filled Black Candlesticks.
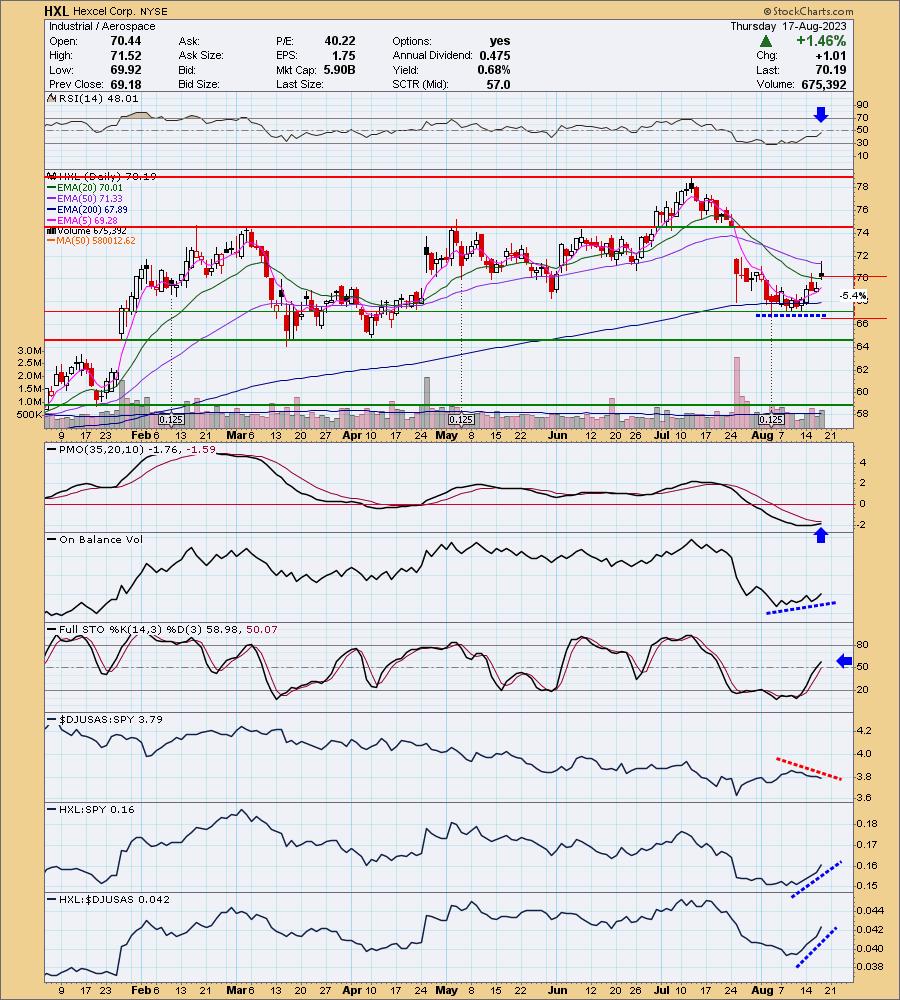
HXL is unchanged in after hours trading. This was listed as a "runner-up" in Tuesday's report. I was sad to see a bearish filled black candlestick, but a decline could offer a better entry. The chart is shaping up nicely as the RSI is rising and should get to positive territory soon. The PMO is lining up for a nice clean crossover. The OBV is showing a positive divergence with price lows. Stochastics are rising nicely. The industry group is not performing well and that could be a drag on HXL. However, it is strongly outperforming the group and the SPY. The stop can be set thinly below support at 5.4% or $66.39.
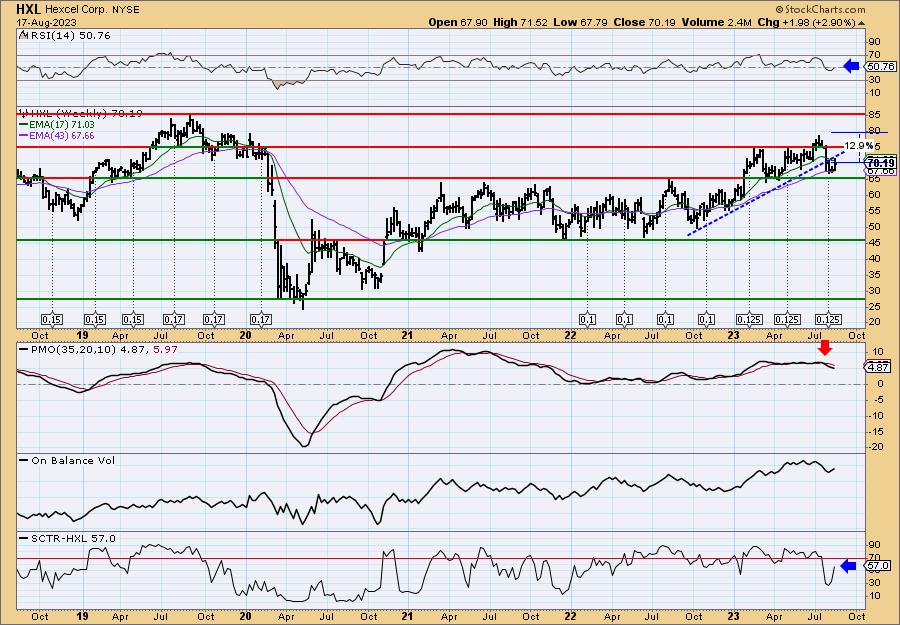
I'm not a huge fan of the weekly chart, but it isn't terrible. The problem I have is that price broke a long-term rising trend and hasn't gotten back there. The weekly RSI is positive and rising, but the weekly PMO is on a Crossover SELL Signal and is in decline. The SCTR looks good as it rises vertically. It should reach the hot zone soon. I've marked upside potential conservatively given current market conditions.
Matador Resources Co. (MTDR)
EARNINGS: 10/24/2023 (AMC)
Matador Resources Co. is a holding company, which engages in the exploration, development, production, and acquisition of oil and natural gas resources. It operates through the following segments: Exploration and Production, Midstream, and Corporate. The Exploration and Production segment focuses on the exploration, development, production, and acquisition of oil and liquids-rich portion of the Wolfcamp and Bone Spring. The Midstream segment conducts natural gas processing, oil transportation services, oil, natural gas and produced water gathering services, and produced water disposal services to third parties. The company was founded by Joseph William Foran and Scott E. King in July 2003 and is headquartered in Dallas, TX.
Predefined Scans Triggered: Elder Bar Turned Green, P&F Ascending Triple Top Breakout and P&F Double Top Breakout.
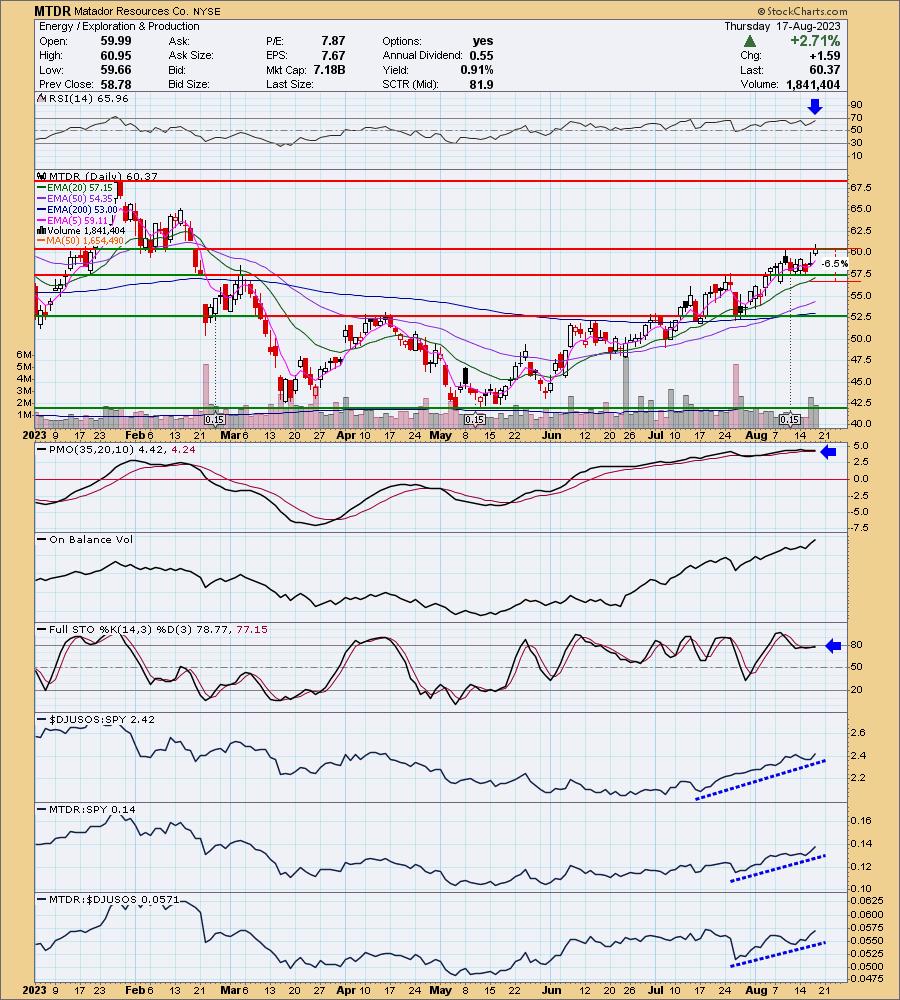
MTDR is up +0.02% in after hours trading. This one came up in my Surge Scan results today so I decided to include it. I'm not enthusiastic about Crude Oil right now, but this chart is very strong. Price broke slightly above the prior August top today and is in a solid rising trend right now. The RSI is positive and not overbought. The PMO has surged above the signal line and isn't that overbought given it hit -7.5 back in March. That means the upside for the PMO is +7.5. Stochastics are below 80 but rising slightly. We have healthy relative strength for the group so far and this one is definitely a leader within the group based on relative strength to the group and consequently the SPY. I've set the stop below support and the 20-day EMA at 6.5% or $56.44.
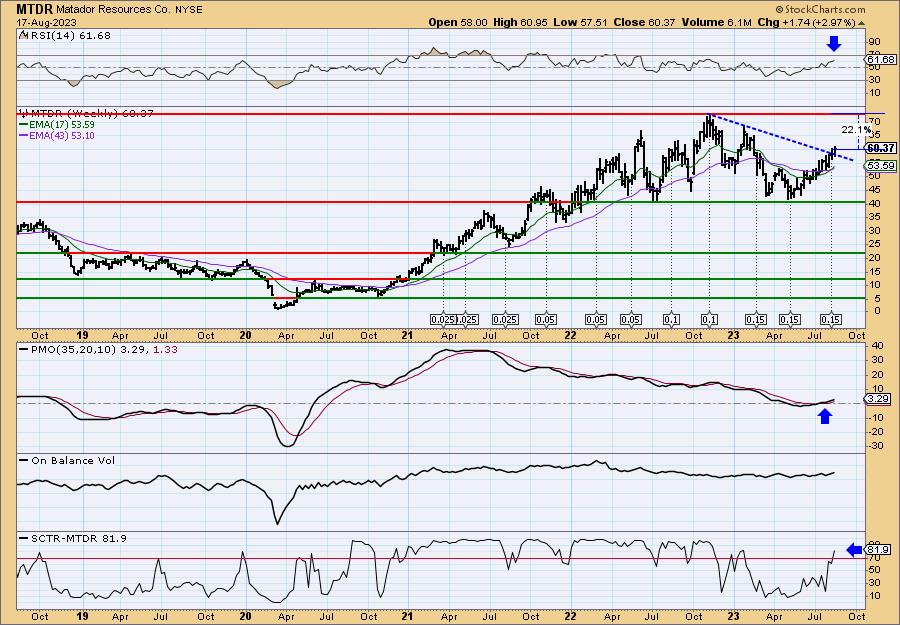
I definitely like the weekly chart and while this normally could be considered an intermediate-term investment, given market conditions, you need to consider all positions as short-term. Price has broken from a declining trend. The weekly RSI is positive and not overbought. The weekly PMO is on a Crossover BUY Signal and is rising. The SCTR is in the hot zone. Upside potential is over 20%.
Timken Steel Corp. (TMST)
EARNINGS: 11/02/2023 (AMC)
TimkenSteel Corp. engages in the manufacture of alloy, carbon and micro-alloy steel products. The firm's products includes special bar quality steel, seamless mechanical tubing, gears, grades of steel, jumbo bloom vertical caster, TimkenSteel ultrapremium technology, and TimkenSteel endurance steels. Its services include thermal treatment, value added components, technical support and testing, supply chain, and TimkenSteel portal. The company was founded on October 24, 2013 and is headquartered in Canton, OH.
Predefined Scans Triggered: Elder Bar Turned Green and Parabolic SAR Buy Signals.
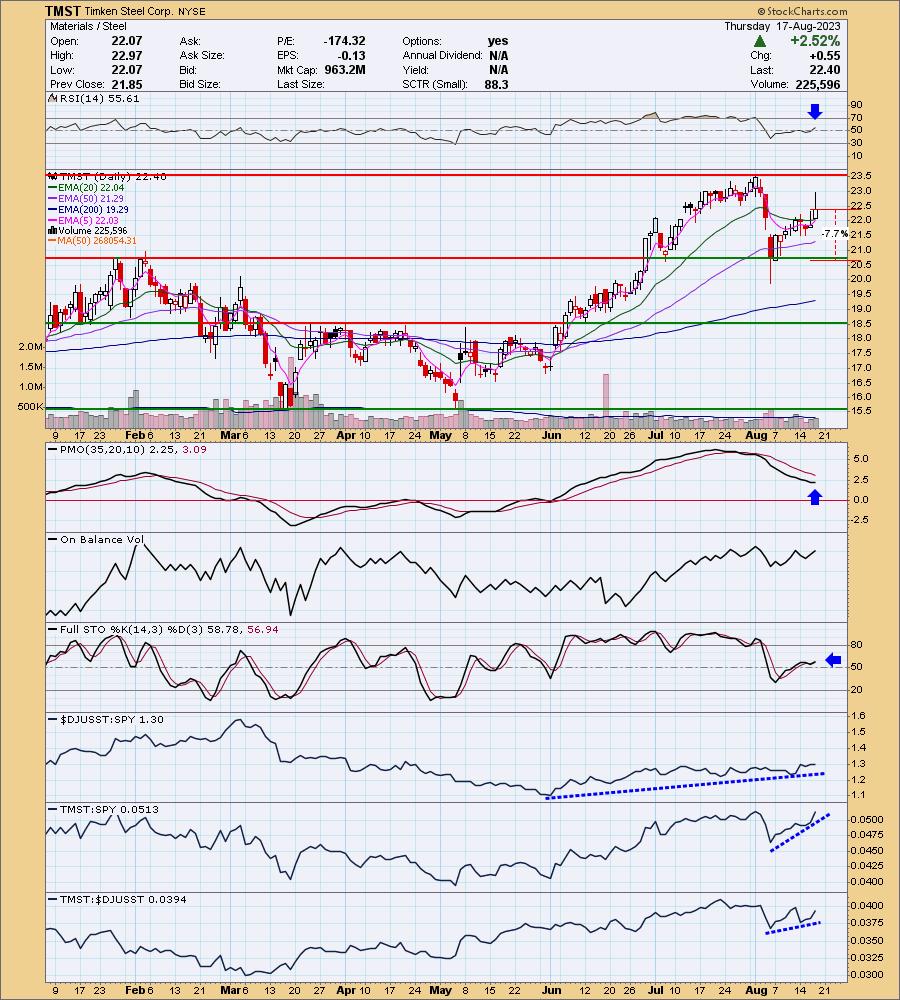
TMST is down -0.36% in after hours trading. The other Steel request was WOR. I liked that chart, but the PMO hadn't turned up yet. Still, it's worth a look. Price was hit hard on earnings (they beat, but missed on revenue slightly based on the Symbol Summary on StockCharts), but it has battled back since. The RSI is positive and rising. The PMO is turning back up. OBV bottoms are confirming the short-term rising trend. Stochastics are rising in positive territory. The group has been quietly improving relative strength this summer. This one tends to beat the group and is relatively strong against the SPY. The stop is set below support at 7.7% or $20.67.
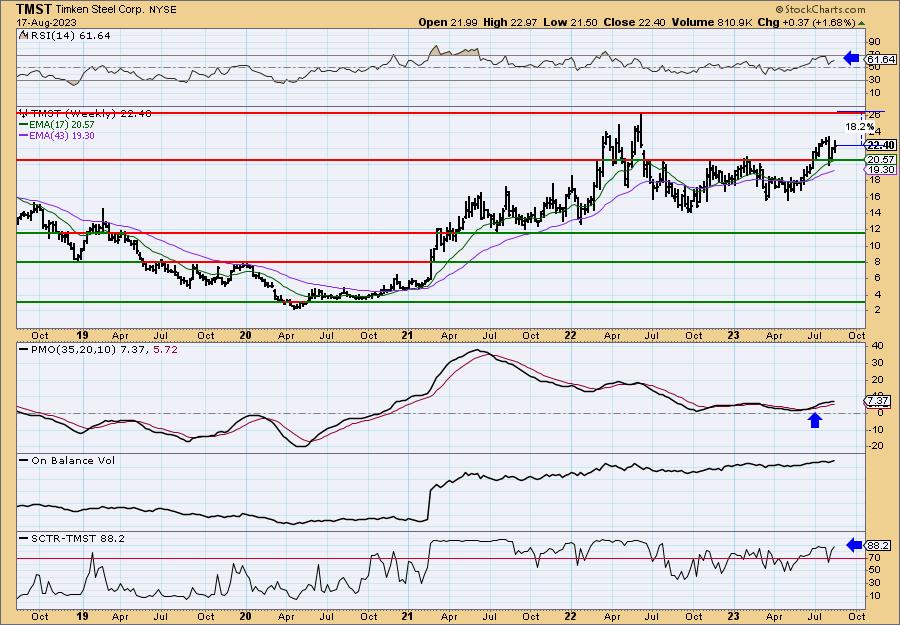
Price bounced on long-term support and the 17-week EMA. The weekly RSI is positive and rising. There is a weekly PMO Crossover BUY Signal and it is rising. The SCTR is well within the hot zone. Upside potential if it can reach the 2022 high is over 18%.
Don't forget, on Thursdays I look at reader-requested symbols, click HERE to send me an email. I read every email I receive and try to answer them all!
Current Market Outlook:
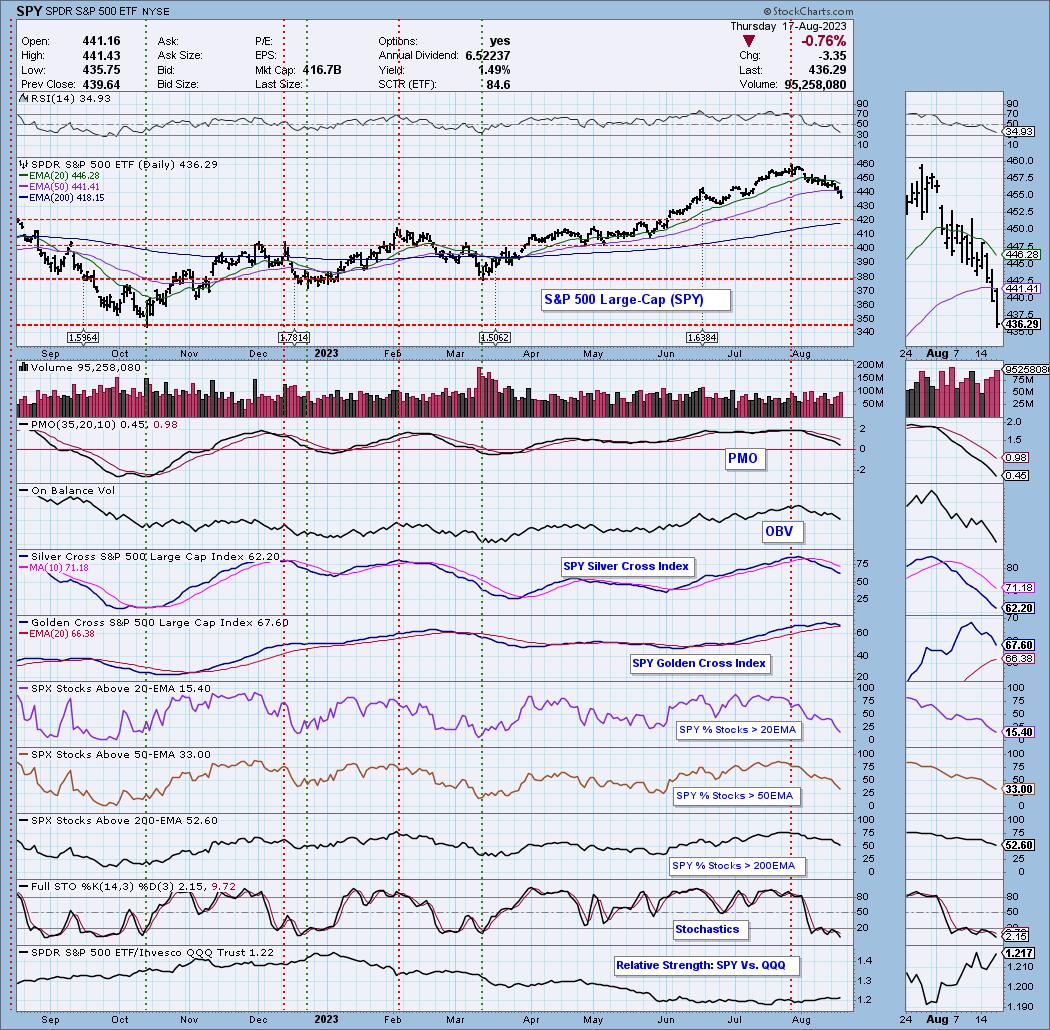
Market Environment: It is important to consider the odds for success by assessing the market tides. The following chart uses different methodologies for objectively showing the depth and trend of participation for intermediate- and long-term time frames.
- The Silver Cross Index (SCI) shows the percentage of SPX stocks on IT Trend Model BUY signals (20-EMA > 50-EMA)
- The Golden Cross Index (GCI) shows the percentage of SPX stocks on LT Trend Model BUY signals (50-EMA > 200-EMA)
Don't forget that as a "Diamonds" member, you have access to our GCI/SCI curated ChartList on DecisionPoint.com. You'll find it under "Members Only" links on the left side on the Blogs and Links Page.
Here is the current chart:
Full Disclosure: I am 10% long, 8% short.
I'm required to disclose if I currently own a stock I mention and/or may buy/short it within the next 72 hours.
"Technical Analysis is a windsock, not a crystal ball." - Carl Swenlin
(c) Copyright 2023 DecisionPoint.com
Watch the latest episode of DecisionPoint Trading Room with Carl & Erin Swenlin on Mondays 7:00p EST or on the DecisionPoint playlist on the StockCharts TV YouTube channel here!
NOTE: The stocks reported herein are from mechanical trading model scans that are based upon moving average relationships, momentum and volume. DecisionPoint analysis is then applied to get five selections from the scans. The selections given should prompt readers to do a chart review using their own analysis process. This letter is not a call for a specific action to buy, sell or short any of the stocks provided. There are NO sure things or guaranteed returns on the daily selection of "Diamonds in the Rough."
Regarding BUY/SELL Signals: The signal status reported herein is based upon mechanical trading model signals and crossovers. They define the implied bias of the price index/stock based upon moving average relationships and momentum, but they do not necessarily call for a specific action. They are information flags that should prompt chart review. Further, they do not call for continuous buying or selling during the life of the signal. For example, a BUY signal will probably (but not necessarily) return the best results if action is taken soon after the signal is generated. Additional opportunities for buying may be found as price zigzags higher, but the trader must look for optimum entry points. Conversely, exit points to preserve gains (or minimize losses) may be evident before the model mechanically closes the signal.
Helpful DecisionPoint Links:
Price Momentum Oscillator (PMO)
Swenlin Trading Oscillators (STO-B and STO-V)
For more links, go to DecisionPoint.com