
Thank you for sending in your requests! It's a tough market and finding good stocks/ETFs can be difficult right now. I would say that overall everyone did a great job at picking.
One subscriber sent in two requests and then took them back. Well, I liked one of those ETFs and will present it anyway as a hedge given it is an inverse ETF.
We had a heavy dose of Biotechs from one subscriber and I liked two of those. And, the final request came from the powerful Energy sector which is enjoying quite a rally.
Tomorrow is the Diamond Mine trading room! Don't forget to register below and remember if you can't attend live, the recording links are always in every Diamond Report.
Good Luck & Good Trading,
Erin
Today's "Diamonds in the Rough": CRL, NBIX, NVDS and VLO.

RECORDING LINK (8/4/2023):
Topic: DecisionPoint Diamond Mine (8/4/2023) LIVE Trading Room
Passcode: August#4th
REGISTRATION for 8/11/2023:
When: Aug 11, 2023 09:00 AM Pacific Time (US and Canada)
Topic: DecisionPoint Diamond Mine (8/11/2023) LIVE Trading Room
Register in advance for this webinar HERE
After registering, you will receive a confirmation email containing information about joining the webinar.

Here is the last recording from 8/7:
Welcome to DecisionPoint Diamonds, wherein I highlight ten "Diamonds in the Rough" per week. These are selected from the results of my DecisionPoint Scans which search for stocks that could benefit from the trend and condition of the market. Remember, these are not recommendations to buy or sell, but are the most interesting of the stocks that surfaced in my scans. My objective is to save you the work of the initial, tedious culling process, but you need to apply your own analysis to see if these stocks pique your interest as well. There are no guaranteed winners here!
"Predefined Scans Triggered" are taken from StockCharts.com using the "Symbol Summary" option instead of a "SharpChart" on the workbench.
Stop levels are all rounded down.
Charles River Laboratorie (CRL)
EARNINGS: 08/09/2023 (BMO) ** Reported Yesterday **
Charles River Laboratories International, Inc. is an early-stage contract research company, which provides research models required in the research and development of new drugs, devices, and therapies. It operates through the following segments: Research Models and Services (RMS), Discovery and Safety Assessment (DSA), and Manufacturing Solutions. The Research Models and Services segment consists of the commercial production and sale of research models, research products, and the provision of services related to the maintenance and monitoring of research models and the management of the clients' research operations. The Discovery and Safety Assessment segment offers integrated drug discovery services directed at the identification, screening, and selection of a lead compound for drug development and offers safety assessment services, including bioanalysis, drug metabolism, pharmacokinetics, toxicology, and pathology. The Manufacturing Support segment consists of Microbial Solutions, which provides in vitro (non-animal) lot-release testing products, microbial detection products, and species identification services, Biologics Solutions, which performs specialized testing of biologics as well as contract development and manufacturing, and Avian Vaccine Services, which supplies specific-pathogen-free chicken eggs and chickens. The company was founded by Henry L. Foster in 1947 and is headquartered in Wilmington, MA.
Predefined Scans Triggered: P&F Ascending Triple Top Breakout and P&F Double Top Breakout.
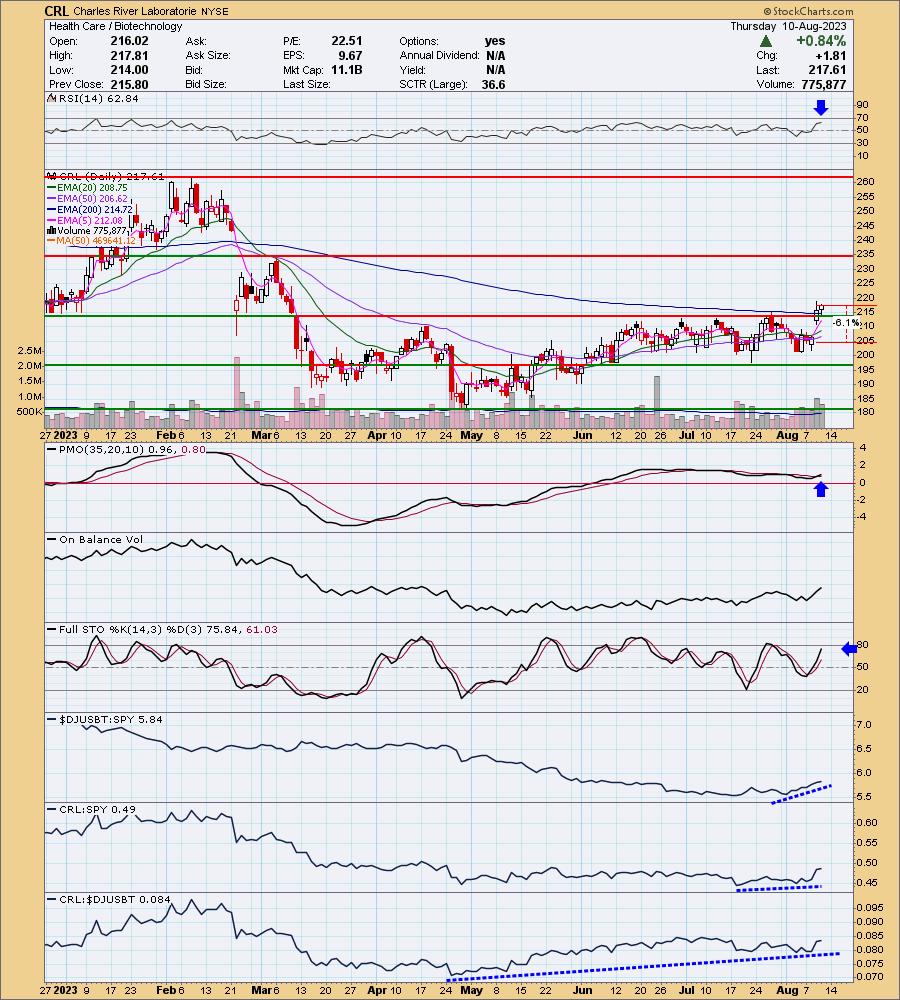
CRL is unchanged in after hours trading. I like the breakaway gap on earnings yesterday and it was very encouraging to see follow-through on yesterday's rally. This breakout takes price out of an intermediate-term trading range. The RSI is positive and not yet overbought. The PMO is on a new Crossover BUY Signal. Stochastics are rising and should reach above 80 soon. I like relative strength, particularly the group's newfound strength. The Diamond Scans were prescient when they began returning Biotechs in the results last week. I've set the stop below key moving averages at 6.1% or $204.33.
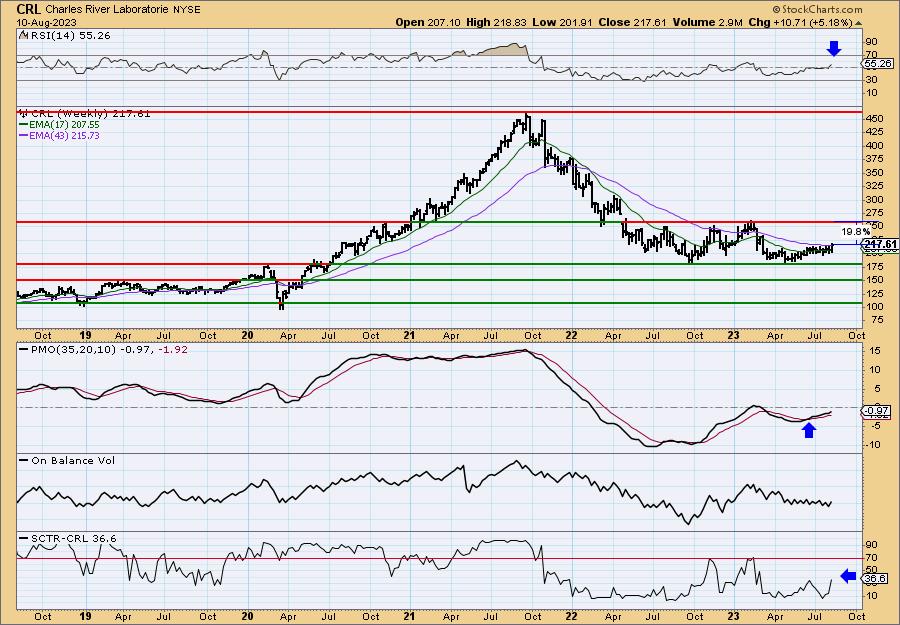
The weekly chart is suggesting this one could become an intermediate-term investment. I'd like to see the StockCharts Technical Rank (SCTR) get into the hot zone* above 70 before I'd be comfortable calling this intermediate-term. Everything else looks great with the weekly RSI in positive territory and not overbought, and the weekly PMO rising on a Crossover BUY Signal and nearing the zero line.
*If a stock/ETF is in the "hot zone" above 70, it implies that it is stronger than 70% of its universe (large-, mid-, small-caps and ETFs) primarily in the intermediate to long terms.
Neurocrine Biosciences, Inc. (NBIX)
EARNINGS: 11/01/2023 (BMO)
Neurocrine Biosciences, Inc. is a neuroscience-focused, biopharmaceutical company. It discovers, develops, and intends to commercialize drugs for the treatment of neurological and endocrine related diseases and disorders. The company was founded by Kevin C. Gorman and Wylie W. Vale in January 1992 and is headquartered in San Diego, CA.
Predefined Scans Triggered: Elder Bar Turned Green, New CCI Buy Signals, Parabolic SAR Buy Signals, P&F Double Top Breakout, P&F Triple Top Breakout and P&F Quadruple Top Breakout.
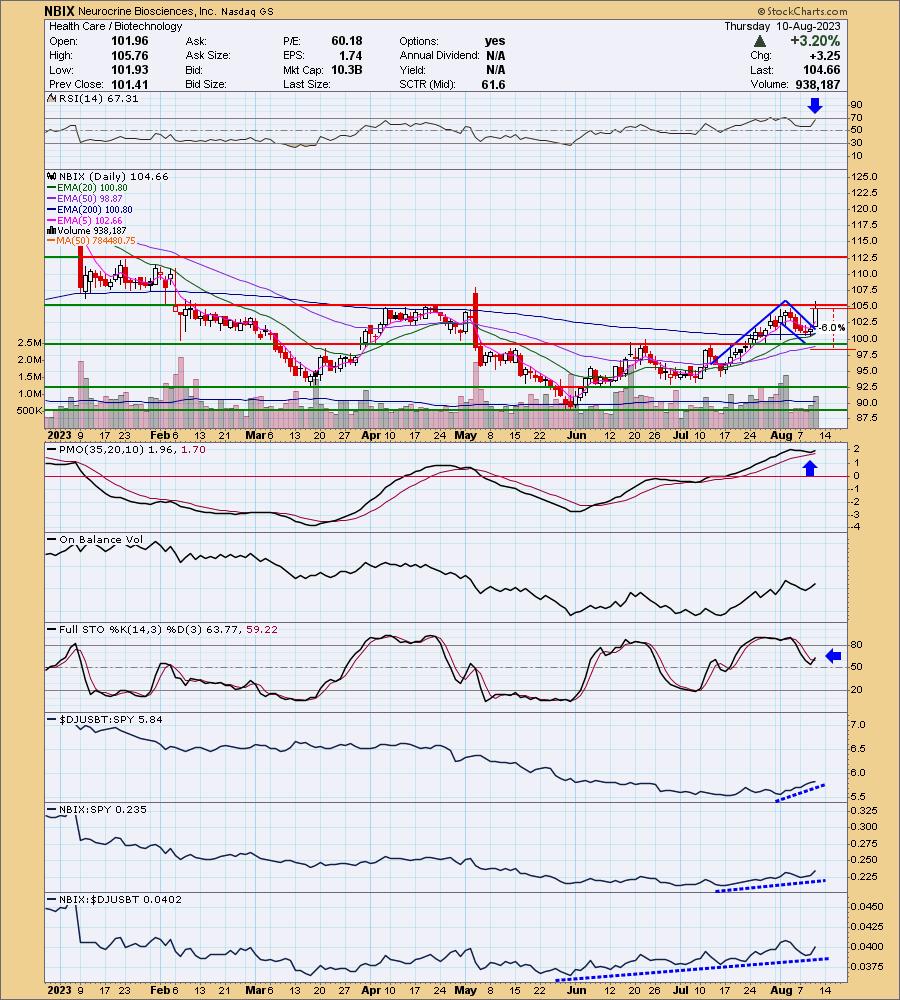
NBIX is up +0.32% in after hours trading. This one really stood out. Not only did it see a nice rally today, it confirmed a near perfect bull flag formation. It is at difficult overhead resistance right now, but given the PMO Surge above the signal line I would look for this one to breakout. The RSI is positive and rising. Stochastics have turned up in positive territory. Relative strength is excellent for NBIX against both the SPY and the group itself. I set the stop below support at the 50-day EMA and June top at 6% or $98.38.
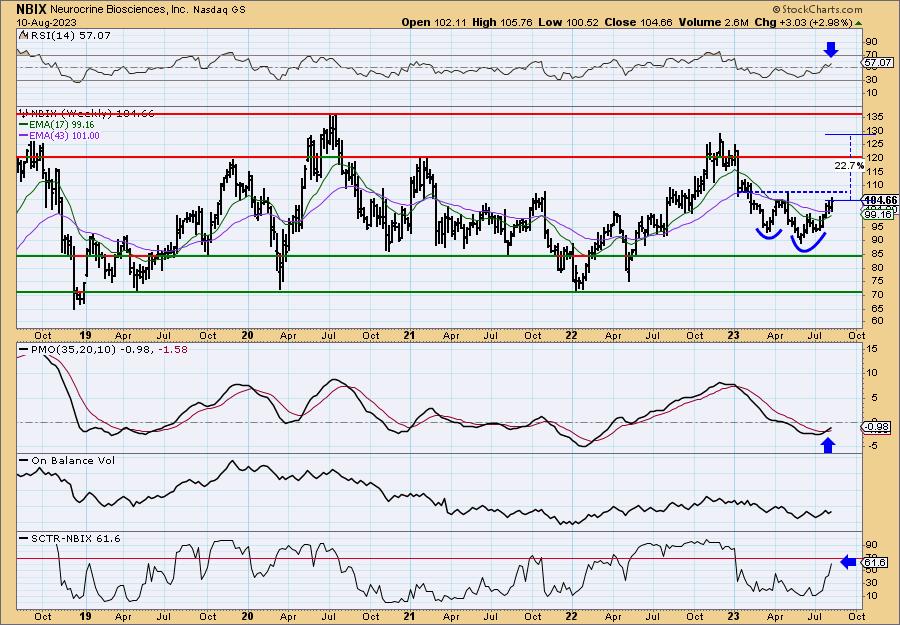
The weekly chart suggests this could be considered an intermediate-term investment, but I would like to see both the SCTR in the hot zone and the bullish double-bottom formation confirmed with a breakout above the confirmation line. If the pattern is confirmed, that would imply a move to test the 2022 top. The weekly RSI is positive and the weekly PMO is on a new Crossover BUY Signal.
AXS 1.25X NVDA Bear Daily ETF (NVDS)
EARNINGS: N/A
NVDS provides inverse (-1.25x) exposure, less fees and expenses, to the daily price movement for shares of Nvidia stock.
Predefined Scans Triggered: Filled black Candles, P&F Double Bottom Breakout and P&F Long Tail Down.
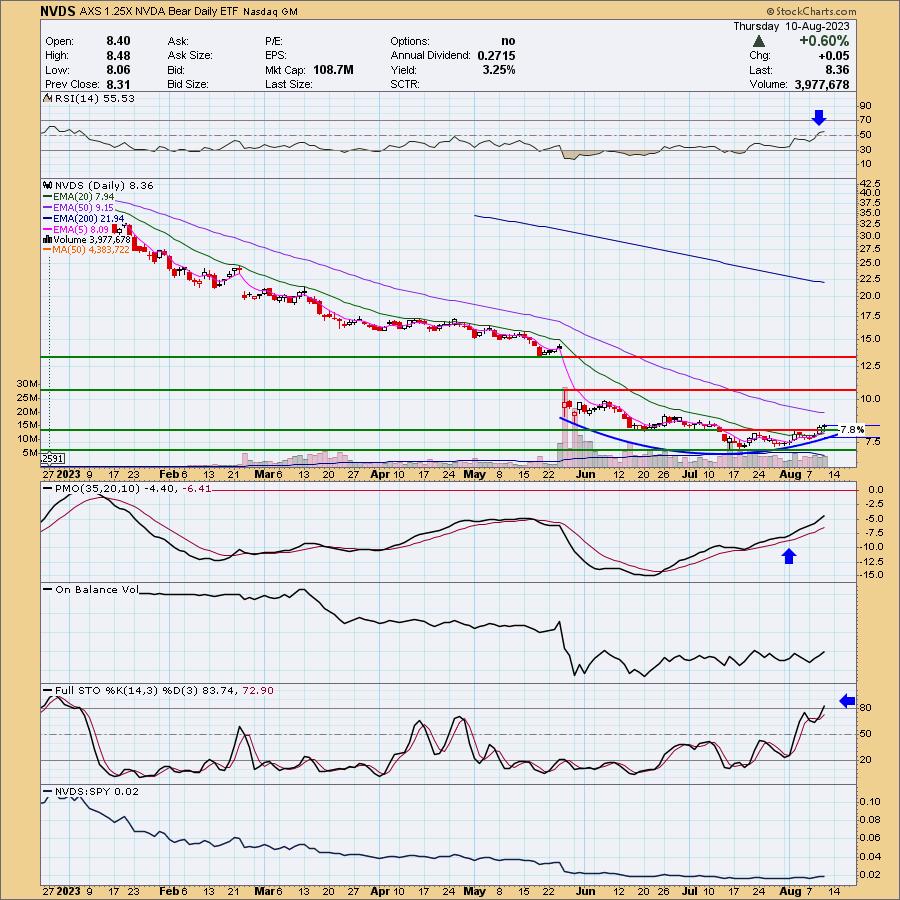
NVDS is unchanged in after hours trading. I'm bearish on tech and particularly bearish on the mega-caps. NVDIA (NVDA) was run way up on AI speculation and it became way too overbought. I am looking for NVDA to pull back further and this is one way to play that without using put options or shorting NVDA directly. It offers leveraged exposure as well. I see a cup formation with a rising trend going on now. The indicators are quite favorable with the RSI in positive territory and the PMO rising out of oversold territory. Stochastics are now above 80. This is a hedge or short-term trade. I've set the stop a little deeply because this is leveraged 1.25x. It is set at 7.8% or $7.70.
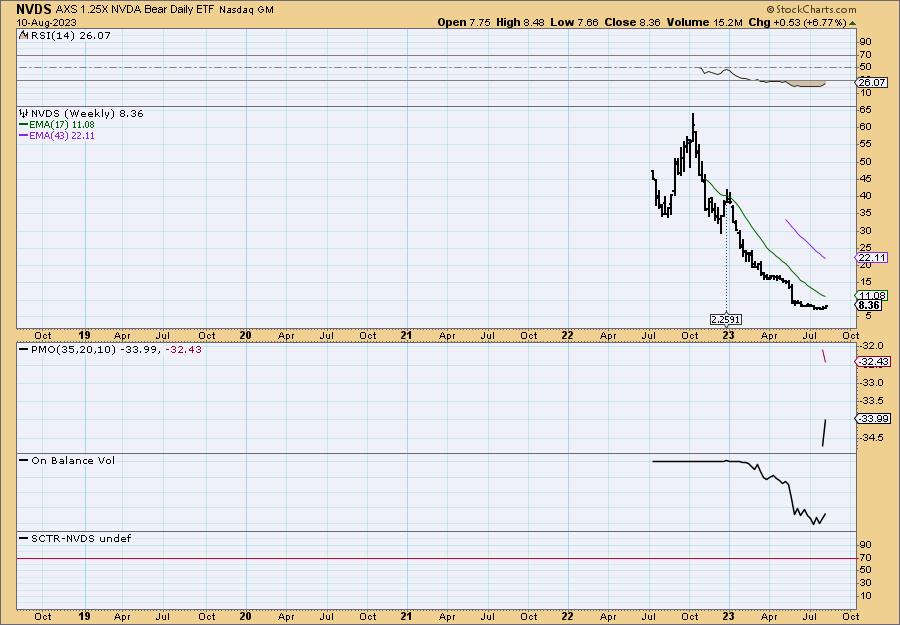
There isn't anything to really talk about on the weekly chart given how new this ETF is. I will say that the RSI is very oversold and that could work to its advantage. Upside target is tough to call as it will be highly dependent on what NVDA itself looks like. I would look for a 15% gain to $9.61.
Valero Energy Corp (VLO)
EARNINGS: 10/26/2023 (BMO)
Valero Energy Corp. engages in the manufacture and marketing of transportation fuels and other petrochemical products. It operates through the following business segments: Refining, Ethanol and Renewable Diesel. The Refining segment consists of refining operations, associated marketing activities, and logistics assets that support its refining operations. The Ethanol segment includes its ethanol operations, associated marketing activities, and logistics assets that support its ethanol operations. The Renewable Diesel covers the operations of Diamond Green Diesel Holdings LLC. The company was founded in 1980 and is headquartered in San Antonio, TX.
Predefined Scans Triggered: Ichimoku Cloud Turned Green, P&F Ascending Triple Top Breakout and P&F Double Top Breakout.
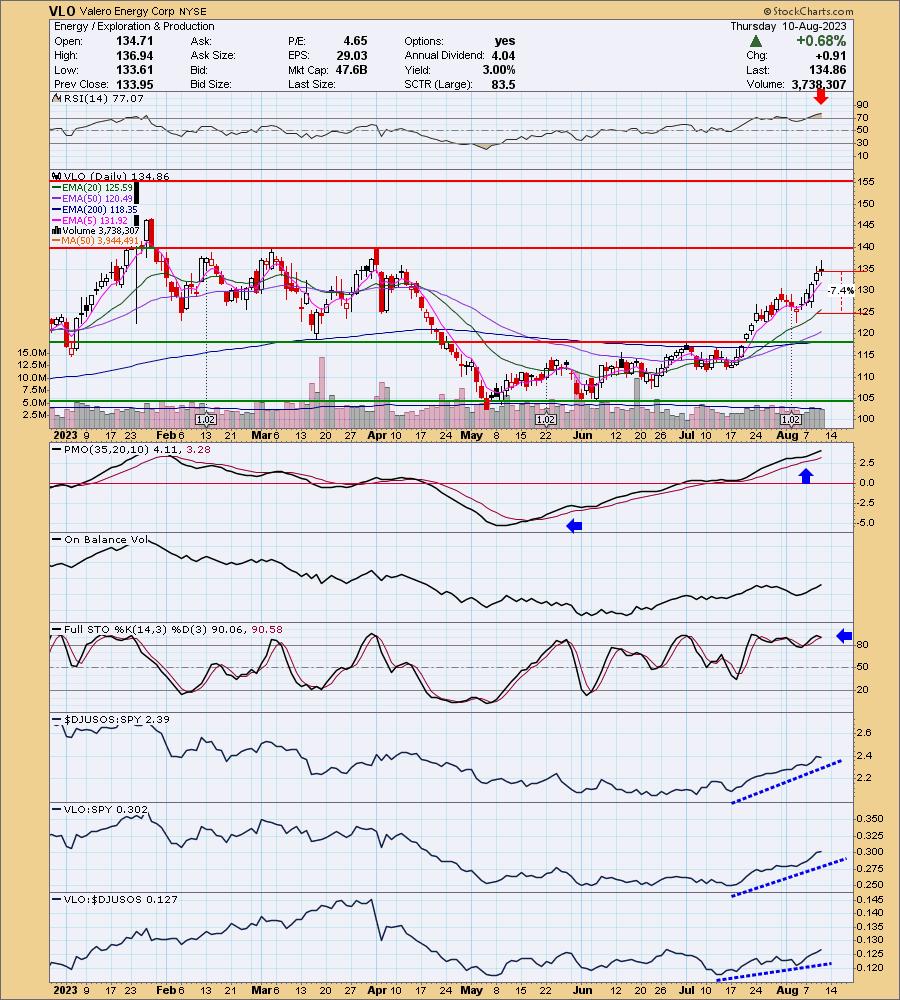
VLO is up +0.02% in after hours trading. I like this one for a hold. While I think you could buy it, I think it could use some consolidation below overhead resistance to move the RSI out of overbought territory. I do think it will move higher from there on a breakout. The PMO isn't that overbought given it reached -5.0. It is rising nicely. Stochastics are oscillating above 80 suggesting internal strength. Relative strength tells us that VLO is a leader within the group and the group is already performing well against the SPY. The stop is set below the 20-day EMA and prior closing low. It is set at 7.4% or $124.88.
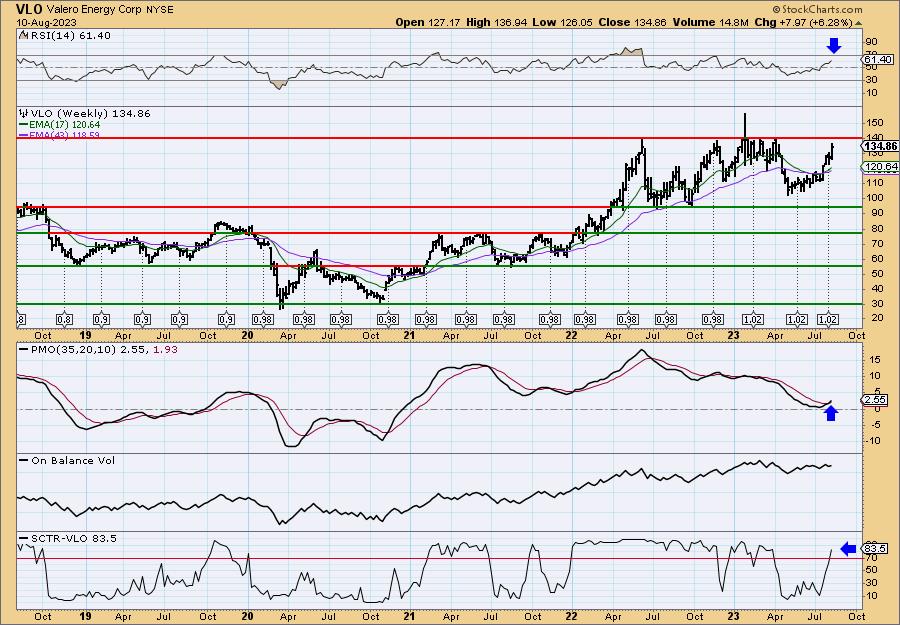
I very much like the weekly chart, but it reminds us that overhead resistance is nearby and it is very strong. The indicators certainly suggest an upcoming breakout to new all-time highs. This could be an intermediate-term investment, but I'd like to see resistance overcome before naming it that. The weekly RSI is positive and rising. The weekly PMO is on a new Crossover BUY Signal. The SCTR is in the hot zone.
Don't forget, on Thursdays I look at reader-requested symbols, click HERE to send me an email. I read every email I receive and try to answer them all!
Current Market Outlook:
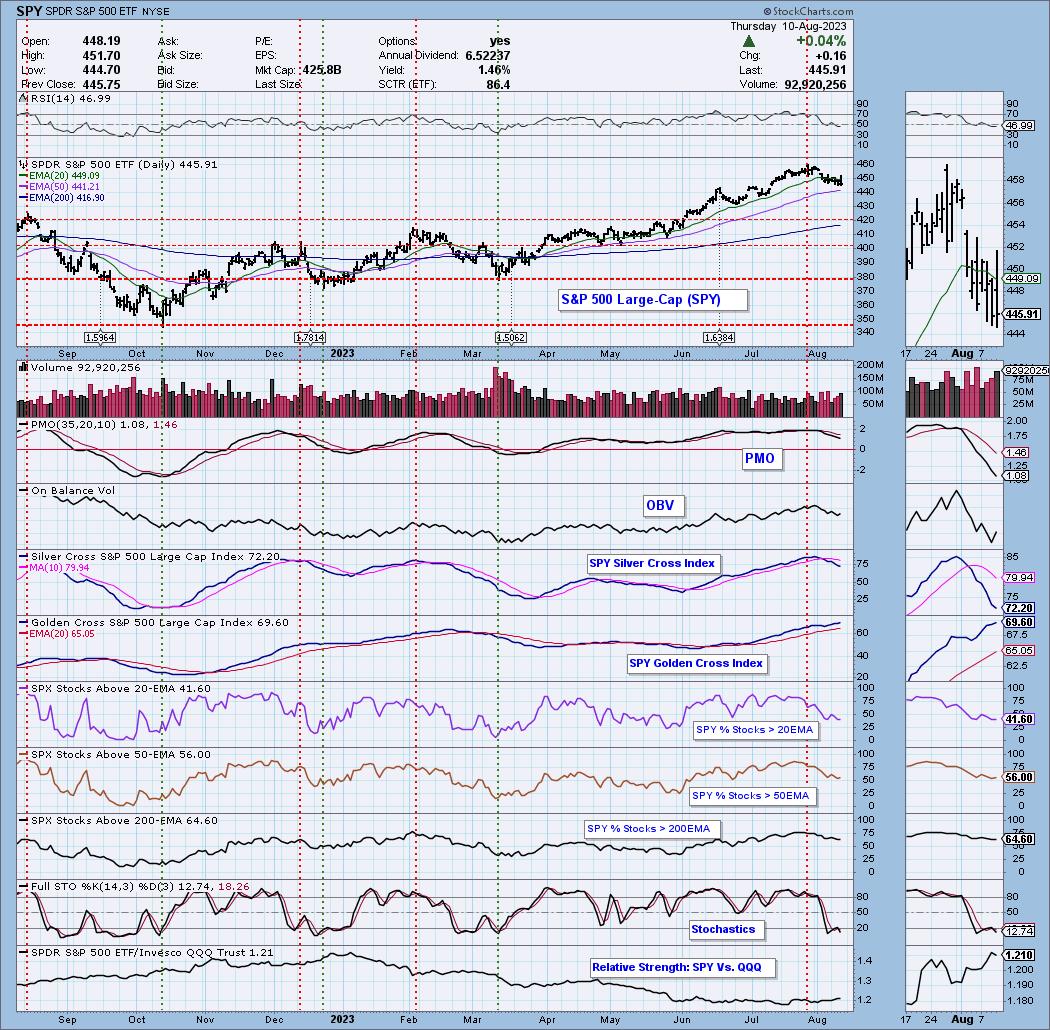
Market Environment: It is important to consider the odds for success by assessing the market tides. The following chart uses different methodologies for objectively showing the depth and trend of participation for intermediate- and long-term time frames.
- The Silver Cross Index (SCI) shows the percentage of SPX stocks on IT Trend Model BUY signals (20-EMA > 50-EMA)
- The Golden Cross Index (GCI) shows the percentage of SPX stocks on LT Trend Model BUY signals (50-EMA > 200-EMA)
Don't forget that as a "Diamonds" member, you have access to our GCI/SCI curated ChartList on DecisionPoint.com. You'll find it under "Members Only" links on the left side on the Blogs and Links Page.
Here is the current chart:
Full Disclosure: I am 20% long, 4% short. Contemplating a Biotech position, not necessarily one of these.
I'm required to disclose if I currently own a stock I mention and/or may buy/short it within the next 72 hours.
"Technical Analysis is a windsock, not a crystal ball." - Carl Swenlin
(c) Copyright 2023 DecisionPoint.com
Watch the latest episode of DecisionPoint Trading Room with Carl & Erin Swenlin on Mondays 7:00p EST or on the DecisionPoint playlist on the StockCharts TV YouTube channel here!
NOTE: The stocks reported herein are from mechanical trading model scans that are based upon moving average relationships, momentum and volume. DecisionPoint analysis is then applied to get five selections from the scans. The selections given should prompt readers to do a chart review using their own analysis process. This letter is not a call for a specific action to buy, sell or short any of the stocks provided. There are NO sure things or guaranteed returns on the daily selection of "Diamonds in the Rough."
Regarding BUY/SELL Signals: The signal status reported herein is based upon mechanical trading model signals and crossovers. They define the implied bias of the price index/stock based upon moving average relationships and momentum, but they do not necessarily call for a specific action. They are information flags that should prompt chart review. Further, they do not call for continuous buying or selling during the life of the signal. For example, a BUY signal will probably (but not necessarily) return the best results if action is taken soon after the signal is generated. Additional opportunities for buying may be found as price zigzags higher, but the trader must look for optimum entry points. Conversely, exit points to preserve gains (or minimize losses) may be evident before the model mechanically closes the signal.
Helpful DecisionPoint Links:
Price Momentum Oscillator (PMO)
Swenlin Trading Oscillators (STO-B and STO-V)
For more links, go to DecisionPoint.com