
Reader requests were a bit thin today, but overall I found nearly all to have merit. What wasn't too surprising was that the Energy theme is carrying forward. It is one of the big winners of late primarily due to Crude Oil prices rising strongly. This condition will likely continue as the Israel-Hamas war keeps the Middle East vulnerable.
Two of today's reader requests are Crude Oil related. One is a commodity ETF and the other Matador Resources (MTDR). My only hesitation with this area of the market is that it has run hot and could use a cool down. As noted above though, the war could keep this from happening, offering these trades intermediate-term upside potential.
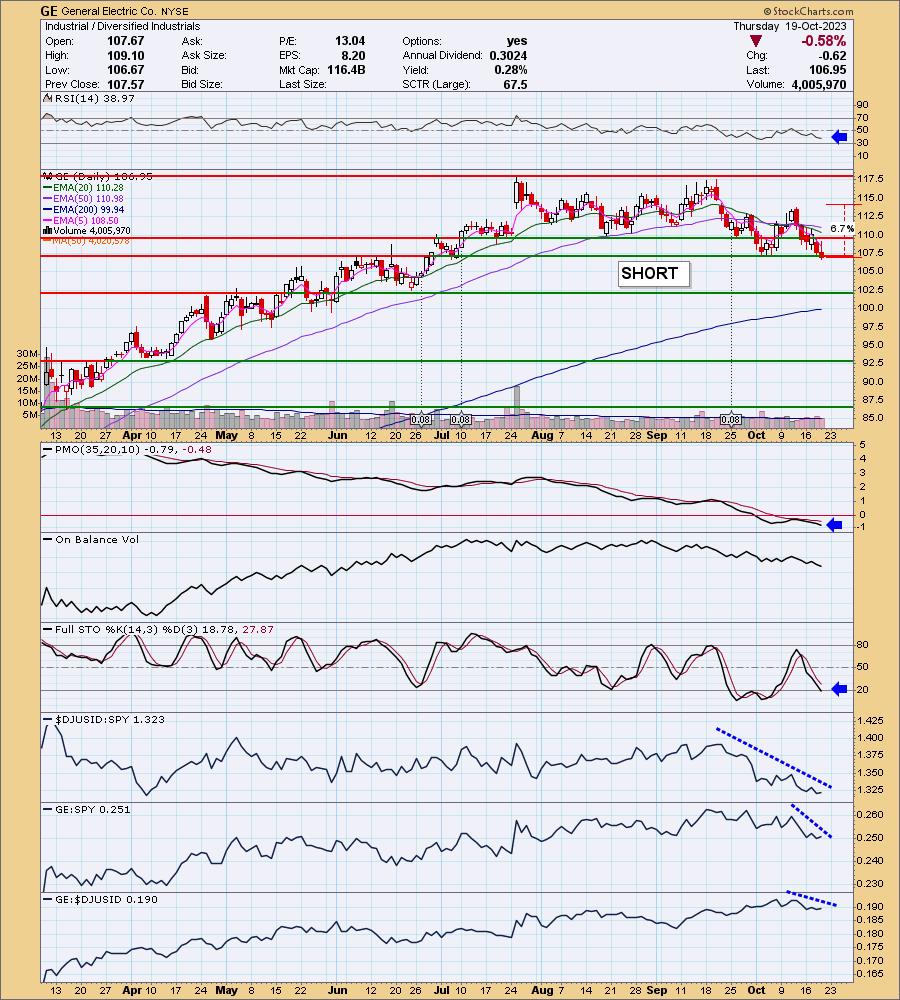
The third choice is a short of General Electric (GE). This is exactly the kind of chart I want to see before I short a stock.
I've opted not to expand my portfolio from 55% long as I do see a pullback in our future. This will offer us some nice opportunities, but right now I don't want to absorb loss out of the gate. The GE short does look interesting given this outlook.
Since I gave you an extra stock on Monday, I am only covering three Reader Requests. I think I may move Tuesdays to be four and only three on Thursdays.
It's hard to believe, but it is already time for the Diamond Mine trading room tomorrow! Remember, you can download the recordings if you want to keep them for future reference. If you would like a copy of the Chat Room discussion, it is available upon request.
Good Luck & Good Trading,
Erin
Today's "Diamonds in the Rough": GE (Short), MTDR and PDBC.
Other requests: NKE (time for a pullback), OBE, TALO, MUR, GEL, VTEX, RELY, VLO, XOM, CENTA and CRWD.

RECORDING LINK (10/13/2023):
Topic: DecisionPoint Diamond Mine (10/13/2023) LIVE Trading Room
Passcode: October@13th
REGISTRATION for 10/20/2023:
When: Oct 20, 2023 09:00 AM Pacific Time (US and Canada)
Topic: DecisionPoint Diamond Mine (10/20/2023) LIVE Trading Room
Register in advance for this webinar HERE
After registering, you will receive a confirmation email containing information about joining the webinar.

Here is the last recording from 10/16:
Welcome to DecisionPoint Diamonds, wherein I highlight ten "Diamonds in the Rough" per week. These are selected from the results of my DecisionPoint Scans which search for stocks that could benefit from the trend and condition of the market. Remember, these are not recommendations to buy or sell, but are the most interesting of the stocks that surfaced in my scans. My objective is to save you the work of the initial, tedious culling process, but you need to apply your own analysis to see if these stocks pique your interest as well. There are no guaranteed winners here!
"Predefined Scans Triggered" are taken from StockCharts.com using the "Symbol Summary" option instead of a "SharpChart" on the workbench.
Stop levels are all rounded down.
General Electric Co. (GE)
EARNINGS: 10/24/2023 (BMO)
General Electric Co. engages in the provision of commercial and military aircraft engines and systems, wind, and other renewable energy generation equipment and grid solutions, and gas, steam, nuclear, and other power generation equipment. It operates through the following segments: Aviation, Renewable Energy, and Power. The Aviation segment designs and produces commercial and military aircraft engines, integrated engine components, electric power and mechanical aircraft systems. The Renewable Energy segment's portfolio of business units includes onshore and offshore wind, blade manufacturing, grid solutions, hydro, storage, hybrid renewables and digital services offerings. The Power segment serves power generation, industrial, government and other customers worldwide with products and services related to energy production. The company was founded by Thomas Alva Edison in 1878 and is headquartered in Boston, MA.
Predefined Scans Triggered: P&F Double Bottom Breakdown, Stocks in a New Downtrend (Aroon) and Moved Below Lower Price Channel.
GE is down -0.22% in after hours trading. Today, GE broke down below a strong support level today. For shorts we want all of our indicators to be negative and that is exactly what we have here. The PMO not only topped beneath its signal line, it did so below the zero line which is especially bearish. The RSI is negative and not oversold. Stochastics are falling and are below 20. Relative strength is terrible across the board. Really great pick! We'll see if it reacts as we expect. The stop is on the upside at 6.7% or $114.12.
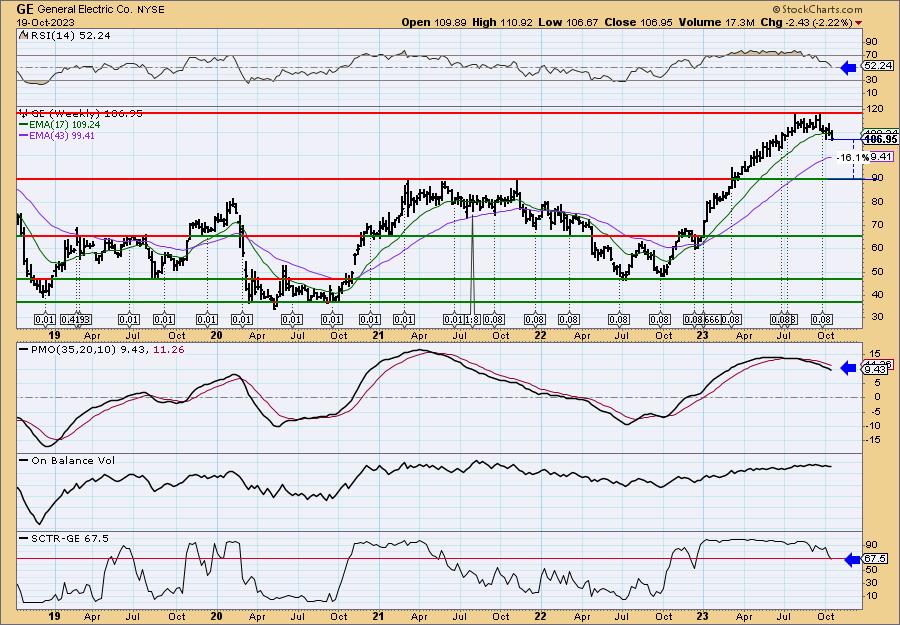
The weekly chart has been breaking down. The weekly RSI is above net neutral (50), but it is in decline. The weekly PMO is declining on an overbought Crossover SELL Signal. The StockCharts Technical Rank (SCTR) has dropped out of the hot zone* above 70. Downside potential on this short is over 16% should it reach the next level of strong support.
*If a stock is in the "hot zone" above 70, it implies that it is stronger than 70% of its universe (large-, mid-, small-caps and ETFs) primarily in the intermediate to long terms.
Matador Resources Co. (MTDR)
EARNINGS: 10/24/2023 (AMC)
Matador Resources Co. is a holding company, which engages in the exploration, development, production, and acquisition of oil and natural gas resources. It operates through the following segments: Exploration and Production, Midstream, and Corporate. The Exploration and Production segment focuses on the exploration, development, production, and acquisition of oil and liquids-rich portion of the Wolfcamp and Bone Spring. The Midstream segment conducts natural gas processing, oil transportation services, oil, natural gas and produced water gathering services, and produced water disposal services to third parties. The company was founded by Joseph William Foran and Scott E. King in July 2003 and is headquartered in Dallas, TX.
Predefined Scans Triggered: Moved Above Upper Price Channel, P&F Double Top Breakout and P&F Bearish Signal Reversal.
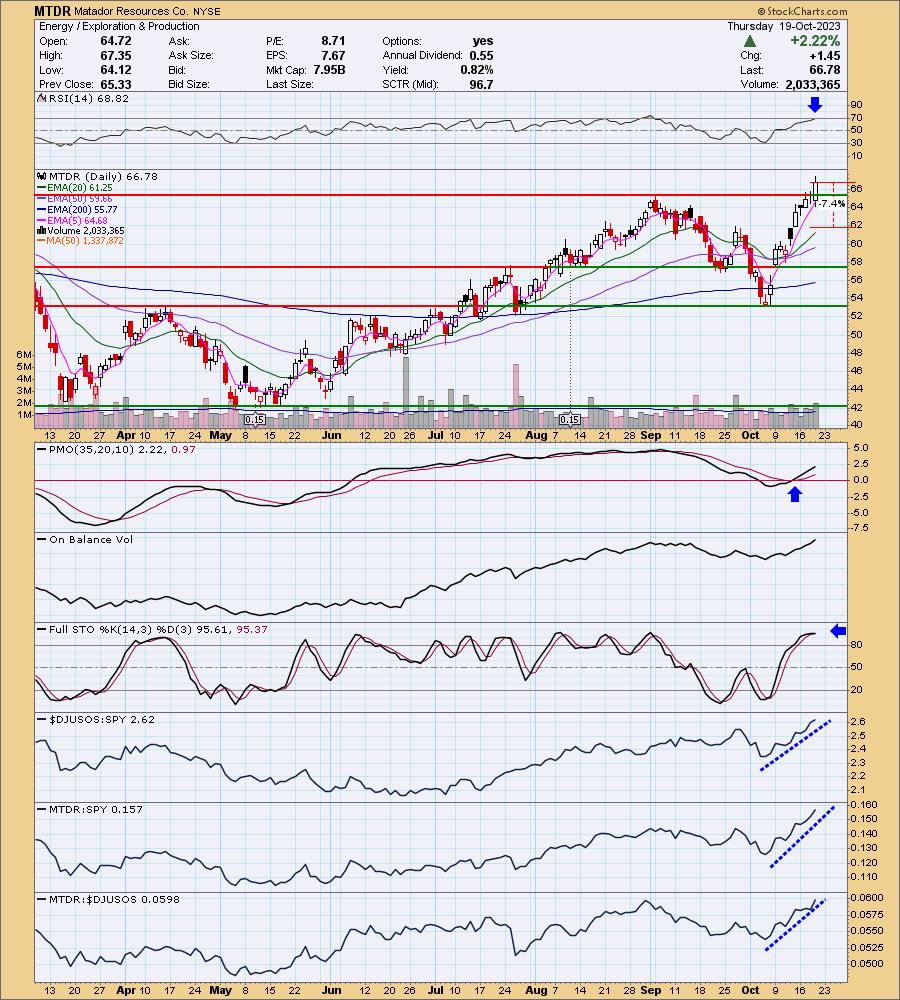
MTDR is down -0.03% in after hours trading. I liked this one best as it just broke out above overhead resistance. It has been on a sustained rally so it may churn a bit above new support, but given its tie to Crude Oil, that may not have to happen. The RSI is positive although getting a tad overbought. The PMO is rising on a Crossover BUY Signal and isn't overbought yet. Stochastics are oscillating above 80. Another reason I picked MTDR was the incredible relative strength it is showing against both the group and the SPY. I wanted to set the stop at the 20-day EMA, but that would be too deep so I settled for a 7.4% stop around $61.83.
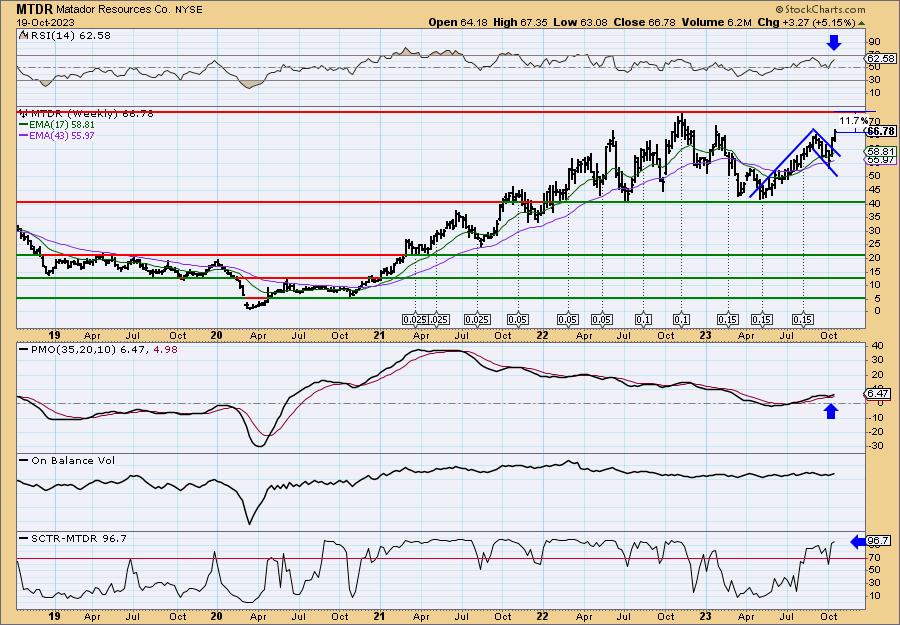
I see a bull flag on the weekly chart that has been confirmed with last week's breakout. It suggests we could see a move the height of the flagpole which would mean an upside target around $90! That may be a bit too optimistic, but given the situation in the Middle East, maybe it isn't. The weekly RSI is positive and rising. The weekly PMO surged above its signal line. The SCTR is at the top of the hot zone.
Invesco Yield Diversified Commodity Strategy No K-1 ETF (PDBC)
EARNINGS: N/A
PDBC holds a diverse basket of commodity futures and aims to mitigate negative roll yield in its contract selection. The fund is structured as an ETF and is actively managed. Click HERE for more information.
Predefined Scans Triggered: None.
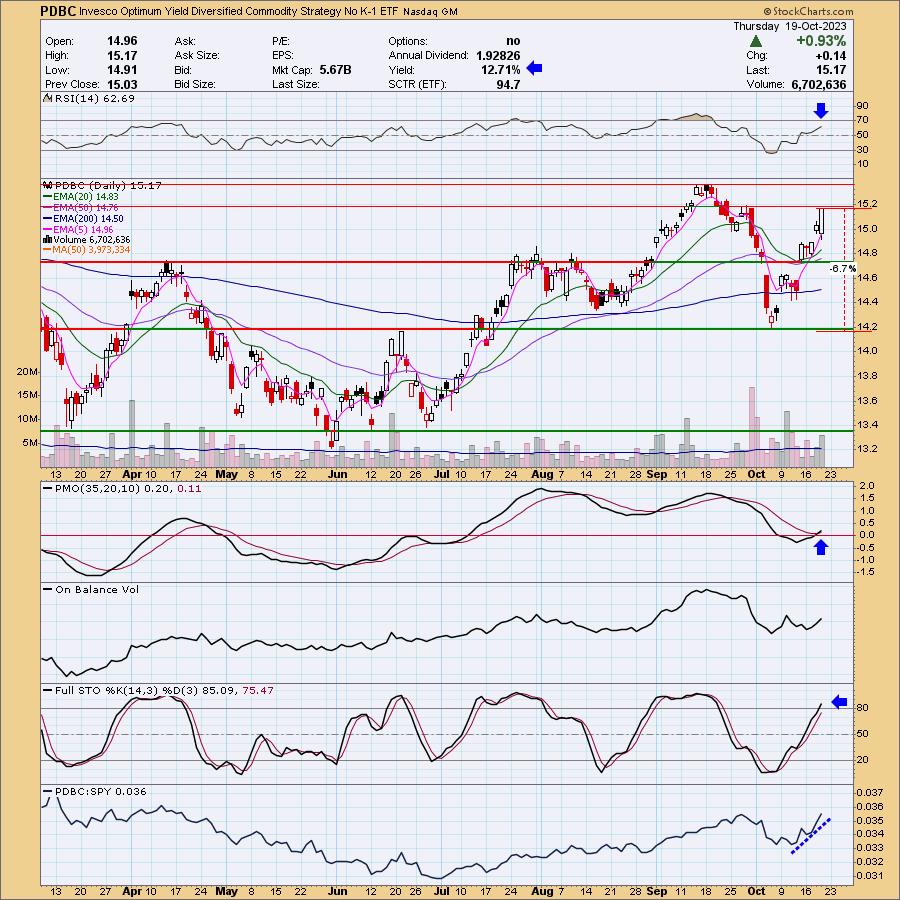
PDBC is down -0.40% in after hours trading. This ETF will take advantage of both Crude Oil and rising commodity prices without the need to file a K-1 at tax time. I also note that the yield is great at 12.71%; however, it seems to only pay once a year in November/December. You'll want to investigate that further. The rally looks like Crude Oil and like Crude it does need a digestion phase. That could occur at overhead resistance at the September high. The rally should see continuation after digestion (if needed). The RSI is positive, rising and not overbought. There is a new PMO Crossover BUY Signal (part of the reason I chose it) and Stochastics are rising above 80. Relative strength has been great coming off the October low.
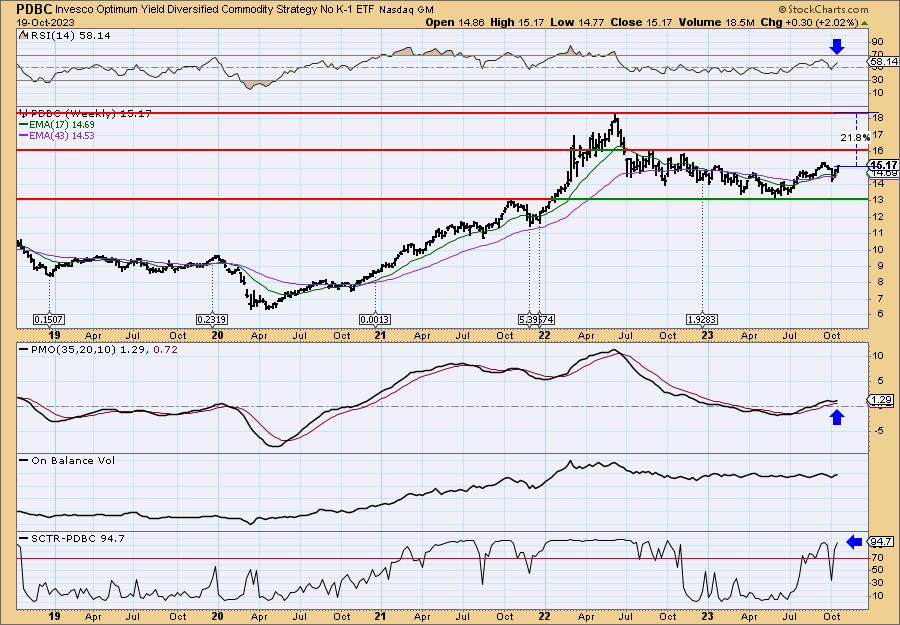
This has been rather range bound, but given the strength of Crude and rising commodities prices, I do expect the breakout. The weekly RSI is positive, rising and not overbought. The weekly PMO has surged above its signal line. The SCTR is at the top of the hot zone for ETFs.
Don't forget, on Thursdays I look at reader-requested symbols, click HERE to send me an email. I read every email I receive and try to answer them all!
Current Market Outlook:
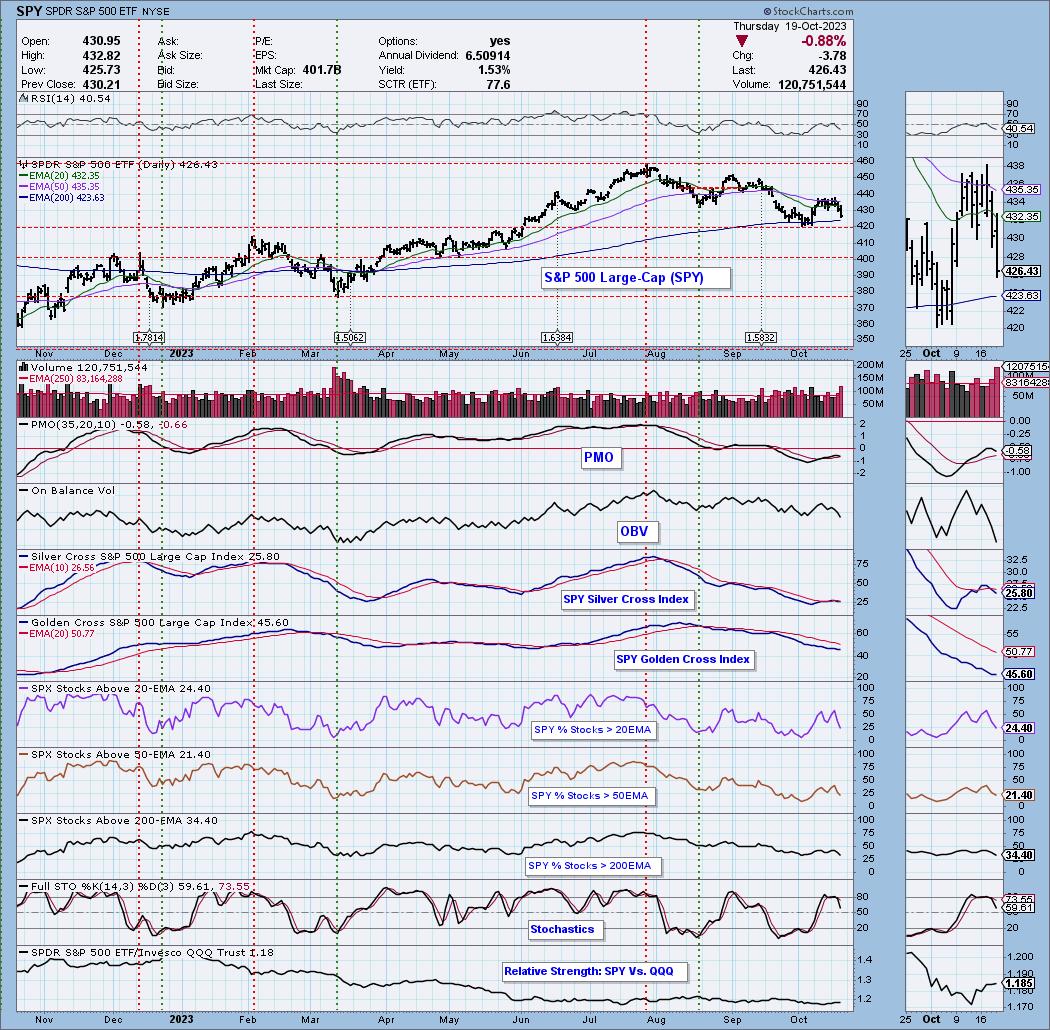
Market Environment: It is important to consider the odds for success by assessing the market tides. The following chart uses different methodologies for objectively showing the depth and trend of participation for intermediate- and long-term time frames.
- The Silver Cross Index (SCI) shows the percentage of SPX stocks on IT Trend Model BUY signals (20-EMA > 50-EMA)
- The Golden Cross Index (GCI) shows the percentage of SPX stocks on LT Trend Model BUY signals (50-EMA > 200-EMA)
Don't forget that as a "Diamonds" member, you have access to our GCI/SCI curated ChartList on DecisionPoint.com. You'll find it under "Members Only" links on the left side on the Blogs and Links Page.
Here is the current chart:
Full Disclosure: I am 55% long, 2% short.
I'm required to disclose if I currently own a stock I mention and/or may buy/short it within the next 72 hours.
"Technical Analysis is a windsock, not a crystal ball." - Carl Swenlin
(c) Copyright 2023 DecisionPoint.com
Watch the latest episode of DecisionPoint Trading Room with Carl & Erin Swenlin on Mondays 3:00p EST or on the DecisionPoint playlist on the StockCharts TV YouTube channel here!
NOTE: The stocks reported herein are from mechanical trading model scans that are based upon moving average relationships, momentum and volume. DecisionPoint analysis is then applied to get five selections from the scans. The selections given should prompt readers to do a chart review using their own analysis process. This letter is not a call for a specific action to buy, sell or short any of the stocks provided. There are NO sure things or guaranteed returns on the daily selection of "Diamonds in the Rough."
Regarding BUY/SELL Signals: The signal status reported herein is based upon mechanical trading model signals and crossovers. They define the implied bias of the price index/stock based upon moving average relationships and momentum, but they do not necessarily call for a specific action. They are information flags that should prompt chart review. Further, they do not call for continuous buying or selling during the life of the signal. For example, a BUY signal will probably (but not necessarily) return the best results if action is taken soon after the signal is generated. Additional opportunities for buying may be found as price zigzags higher, but the trader must look for optimum entry points. Conversely, exit points to preserve gains (or minimize losses) may be evident before the model mechanically closes the signal.
Helpful DecisionPoint Links:
Price Momentum Oscillator (PMO)
Swenlin Trading Oscillators (STO-B and STO-V)
For more links, go to DecisionPoint.com