
It was interesting as always to see what symbols arrived in my inbox for Reader Request Day. I picked the charts I liked best. They aren't perfect, but I'll discuss that when I review them.
There was a clear theme and that was Healthcare, Biotechs in particular. One request was the leveraged 3x Bull Biotechnology ETF (LABU), but rather than presenting the leveraged version, I am including IBB which we have "Under the Hood" indicators for. Two more Biotechs are included today.
The one lone stock not in Healthcare is Dollar Tree (DLTR) which has a very nice chart.
I would say that right now we have to be aware of overbought conditions. The market is due for a downturn and those overbought stocks will likely be hit first. If you are going to add to your portfolio, be sure to put in stops. These charts are set up for success but we know that not all "Diamonds in the Rough" polish up.
Good Luck & Good Trading,
Erin
Today's "Diamonds in the Rough": ANVS, CRNX, DLTR and IBB.
Other requests: AMGN, IP, WRK, EXEL, UTHR, RCUS, GEL, IMVT, PKG, LYFT, LABU, NTAP and ZS.

RECORDING LINK (11/17/2023) (No Recording on 11/24):
Topic: DecisionPoint Diamond Mine (11/17/2023) LIVE Trading Room
Passcode: November#17
REGISTRATION for 12/1/2023:
When: Dec 1, 2023 09:00 AM Pacific Time (US and Canada)
Topic: DecisionPoint Diamond Mine (12/1/2023) LIVE Trading Room
Register in advance for this webinar HERE
After registering, you will receive a confirmation email containing information about joining the webinar.

Here is the last recording from 11/27:
Welcome to DecisionPoint Diamonds, wherein I highlight ten "Diamonds in the Rough" per week. These are selected from the results of my DecisionPoint Scans which search for stocks that could benefit from the trend and condition of the market. Remember, these are not recommendations to buy or sell, but are the most interesting of the stocks that surfaced in my scans. My objective is to save you the work of the initial, tedious culling process, but you need to apply your own analysis to see if these stocks pique your interest as well. There are no guaranteed winners here!
"Predefined Scans Triggered" are taken from StockCharts.com using the "Symbol Summary" option instead of a "SharpChart" on the workbench.
Stop levels are all rounded down.
Annovis Bio Inc. (ANVS)
EARNINGS: 03/28/2024 (AMC)
Annovis Bio, Inc. is a clinical stage drug platform company, which engages in the development of drugs which aims to treat neurodegenerative diseases such as Alzheimer's (AD) and Parkinson's (PD). Its lead product candidate, Buntanetap, is designed to address AD, PD, and potentially other chronic neurodegenerative diseases. Its product pipeline also includes ANVS405 and ANVS301, which focus on the treatment of traumatic brain injury, stroke, and advanced AD. The company was founded by Maria Luisa Maccecchini in May 2008 and is headquartered in Berwyn, PA.
Predefined Scans Triggered: Stocks in a New Uptrend (Aroon), P&F Double Top Breakout and Shooting Star.
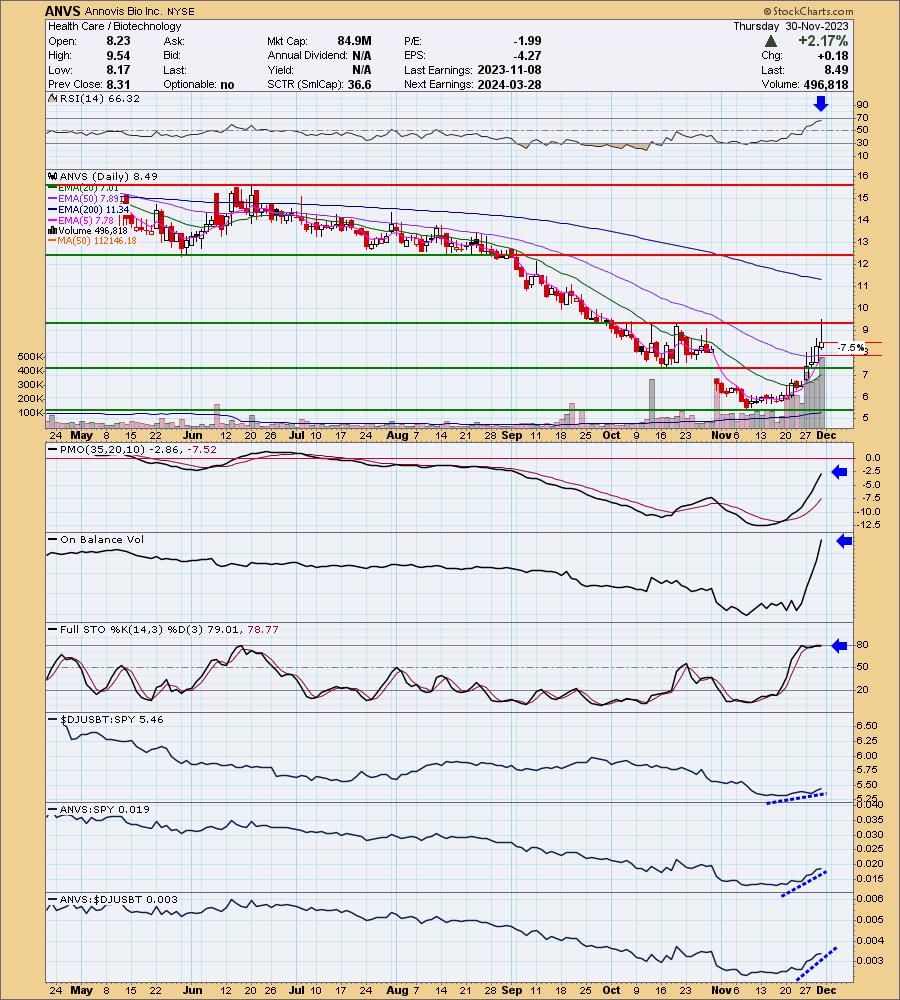
ANVS is up +0.12% in after hours trading. Admittedly this is a parabolic rally and they do tend to fail in order to get a less steep rising trend. You may want to wait on that given it is just now reaching overhead resistance. The chart is favorable and does suggest we will see a breakout. Be careful, P/E is negative. I try to avoid that. The RSI is positive and not yet overbought. The PMO is rising strongly and isn't overbought yet. Volume has been flying in so interest is there. Stochastics aren't above 80, but they are technically rising and should get there soon. Relative strength is definitely picking up for Biotechs (part of the reason I selected IBB today). ANVS is showing leadership based on rising relative strength against the group and consequently the SPY. The stop is set below the 50-day EMA at 7.5% or $7.85.
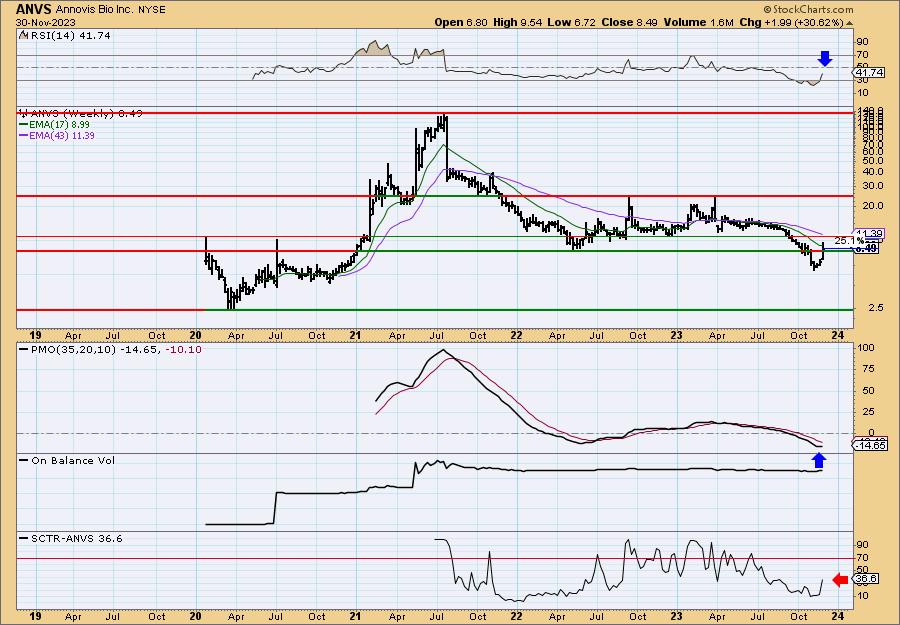
I like how the weekly chart is shaping up. It isn't fully bullish, but is definitely showing improvement. Price is now back above support. The weekly RSI is rising, but is still in negative territory for now. The PMO has turned up. The StockCharts Technical Rank (SCTR) is not in the hot zone* above 70, but it is showing great improvement. Upside potential on this one is crazy if it can reach the top of the prior trading range (over 200%), but I'm going to look for a modest upside target at 25% for now.
*If a stock is in the "hot zone" above 70, it implies that it is stronger than 70% of its universe (large-, mid-, small-caps and ETFs) primarily in the intermediate to long terms.
Crinetics Pharmaceuticals, Inc. (CRNX)
EARNINGS: 02/28/2024 (AMC)
Crinetics Pharmaceuticals, Inc. operates as a clinical stage pharmaceutical company focused on the discovery, development, and commercialization of novel therapeutics for rare endocrine diseases and endocrine-related tumors. Its product candidate, CRN00808, is an oral nonpeptide somatostatin agonist for the treatment of acromegaly. The firm is also developing other oral nonpeptide somatostatin agonists for neuroendocrine tumors and hyperinsulinism, as well as an oral nonpeptide ACTH antagonist for the treatment of Cushing's disease. The company was founded by R. Scott Struthers, Yun-Fei Zhu and Stephen F. Betz in 2008 and is headquartered in San Diego, CA.
Predefined Scans Triggered: Elder Bar Turned Blue, New 52-week Highs, Stocks in a New Uptrend (Aroon), P&F Double Top Breakout and P&F Triple Top Breakout.
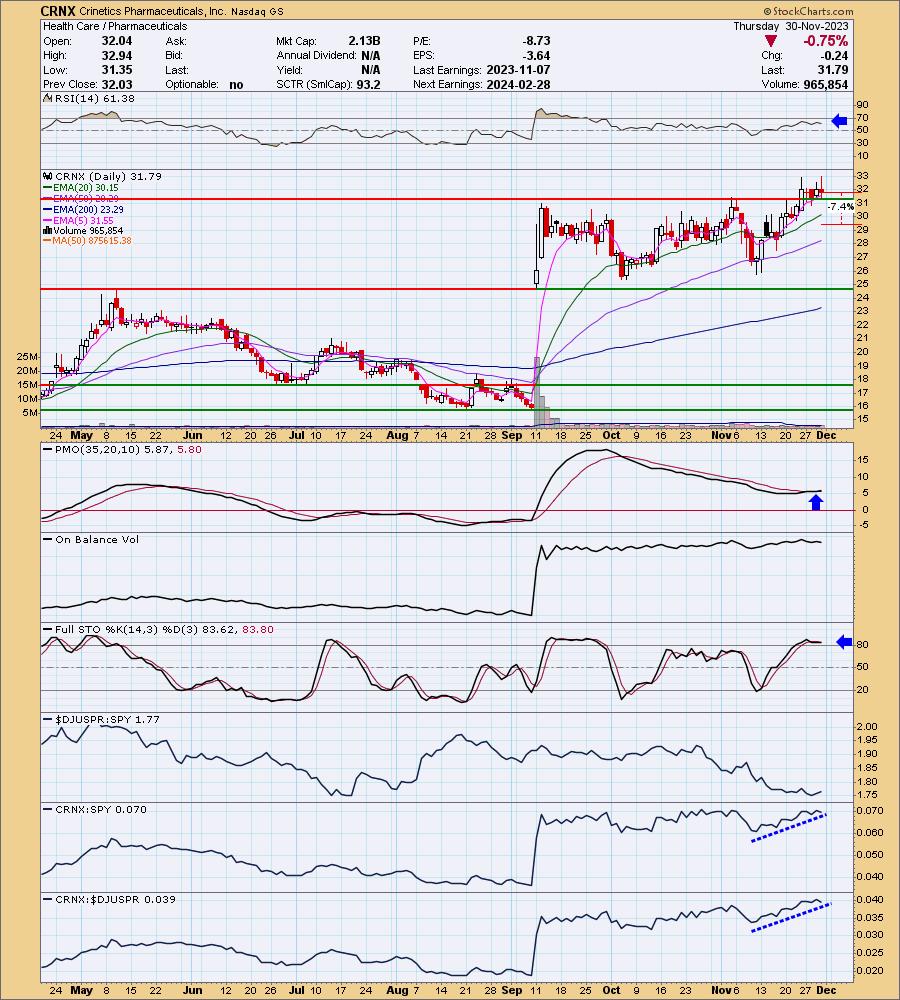
CRNX is unchanged in after hours trading. I like the breakout from the prior trading range. It was down today, but stayed above support. The RSI is positive and not overbought. The PMO is on a new Crossover BUY Signal. Stochastics have camped out above 80. Relative strength for Pharma hasn't picked up, but it has evened out. CRNX is showing strength against both the group and SPY. The stop is set between the 20/50-day EMAs at 7.4% or $29.43.
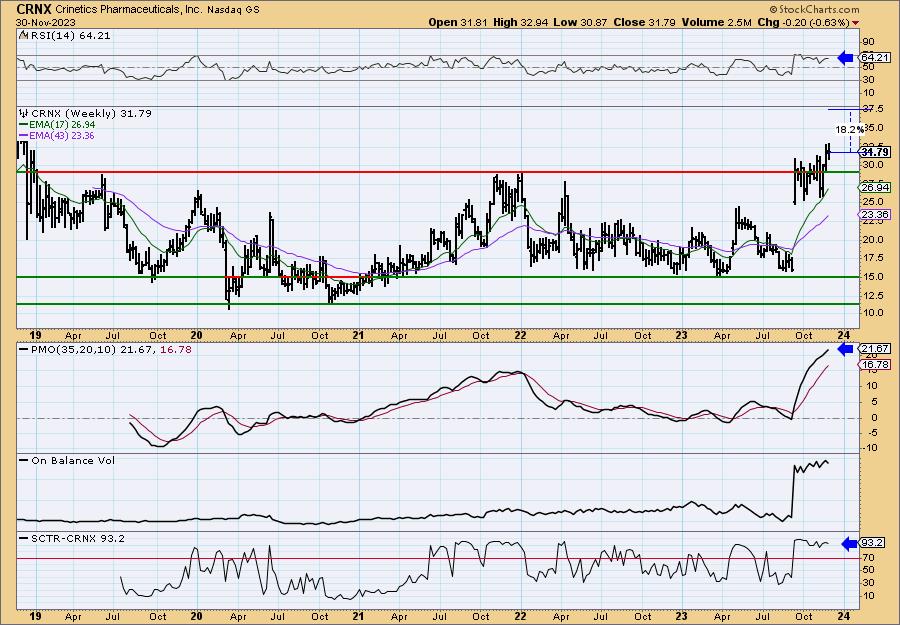
I like the weekly chart except for the overbought PMO, but it is still rising strongly so I can't argue with that. The RSI is positive and not overbought. Best is the SCTR being at the top of the hot zone. I've opted to set an upside target of about 18.2%.
Dollar Tree, Inc. (DLTR)
EARNINGS: 02/28/2024 (BMO)
Dollar Tree, Inc. owns and operates discount variety stores offering merchandise at fixed prices. It operates through the Dollar Tree and Family Dollar segments. The Dollar Tree segment includes operations under Dollar Tree and Dollar Tree Canada brands, with its distribution centers in the United States and Canada. The Family Dollar segment consists of a chain of general merchandise retail discount stores providing consumers with a selection of competitively priced merchandise in convenient neighborhood stores. The company was founded by J. Douglas Perry and Macon F. Brock, Jr. in 1953 and is headquartered in Chesapeake, VA.
Predefined Scans Triggered: Moved Above Upper Keltner Channel, Moved Above Upper Price Channel, P&F Ascending Triple Top Breakout and P&F Double Top Breakout.
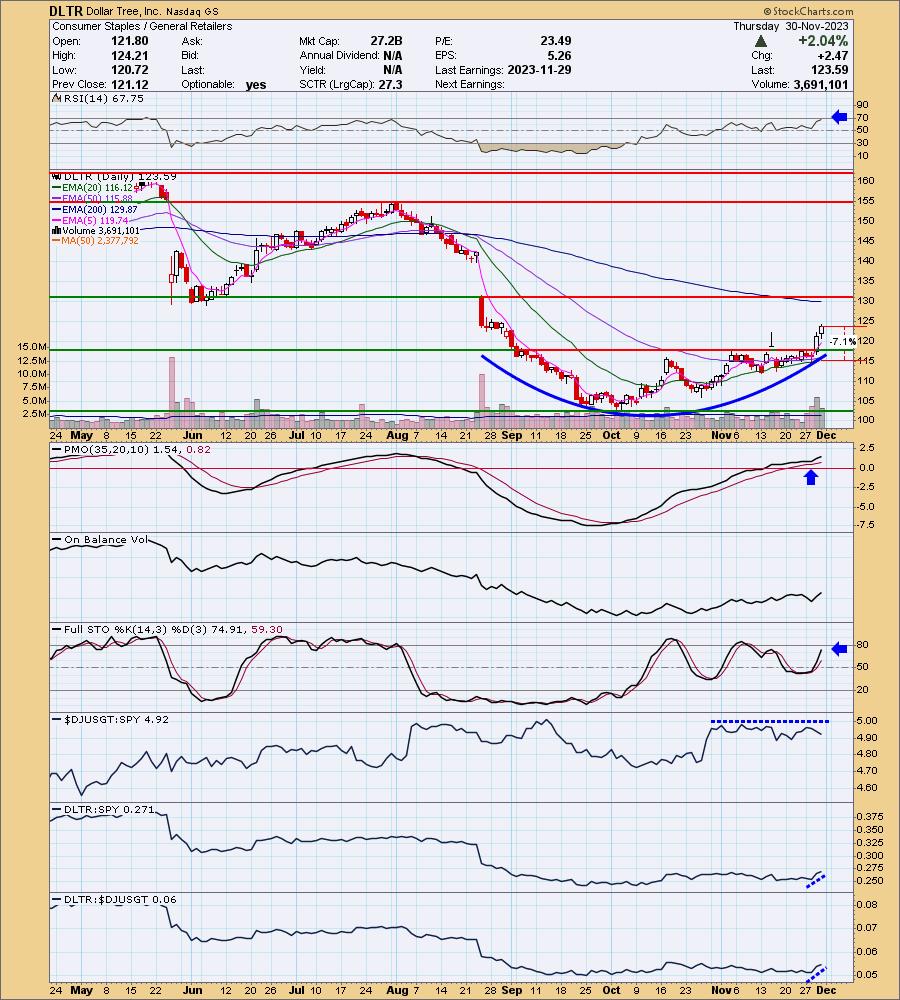
DLTR is down -0.48% in after hours trading. It reported earnings yesterday and apparently they were well received. The rally on earnings took price above overhead resistance. There is a nice cup-shaped basing pattern. The RSI is positive and not yet overbought. The PMO is rising and is not overbought. It appears it recently surged above the signal line (bottomed above the signal line). Stochastics are rising strongly in positive territory. Relative strength for the group could be better. The recent rally has DLTR currently outperforming the group and the SPY. The stop is set at 7.1% or $114.81.
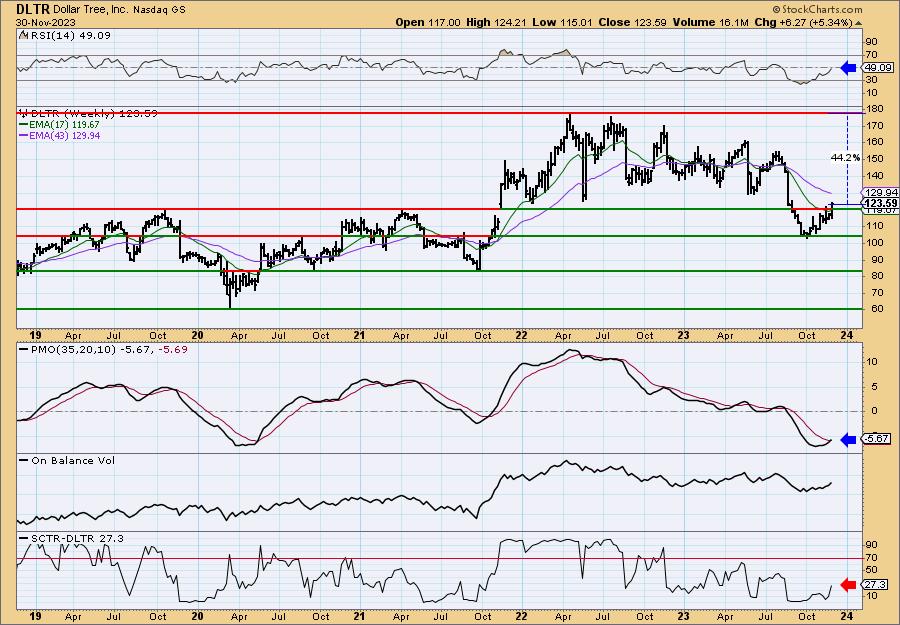
I like the weekly chart, it suggests this could be an intermediate-term investment. The RSI is negative, but should hit positive territory soon. There is a new weekly PMO Crossover BUY Signal on tap for tomorrow (these signals don't go 'final' until after the close on the last trading day of the week). The SCTR is not in the hot zone, but it is rising quickly. Upside potential is over 44% if it can reach the 2022 highs.
iShares Nasdaq Biotechnology ETF (IBB)
EARNINGS: N/A
IBB tracks the performance of a modified market-cap-weighted index of US biotechnology companies listed on US exchanges. Click HERE for more information.
Predefined Scans Triggered: New CCI Buy Signals, Stocks in a New Uptrend (Aroon), Moved Above Upper Price Channel and Entered Ichimoku Cloud.
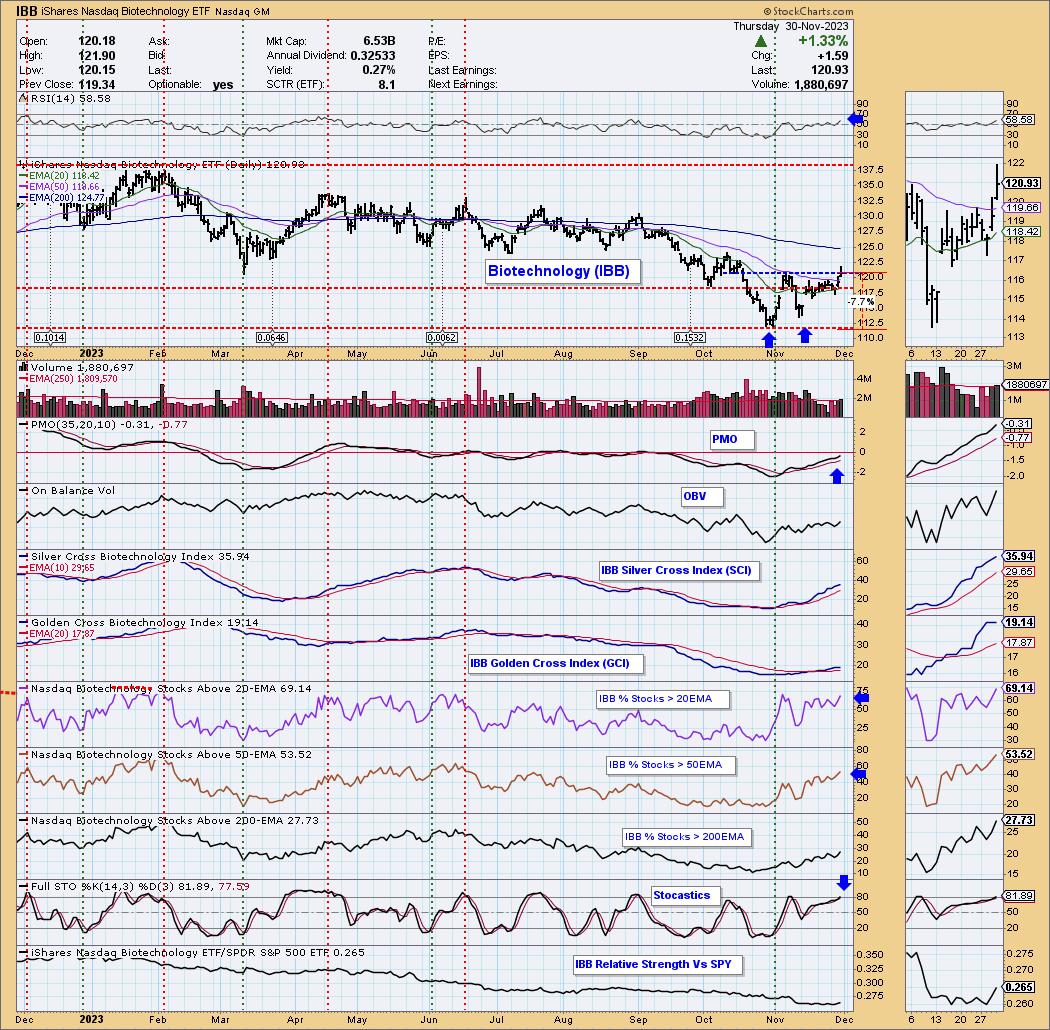
IBB is unchanged in after hours trading. You could also consider XBI as a possible choice besides this one. I have "Under the Hood" indicators on IBB and opted to use it. There is a double bottom pattern that has executed with today's breakout. The RSI is positive and PMO is surging above the signal line. The OBV is confirming the rally. Participation is strong and not really overbought. It is also continuing to improve. Stochastics just moved above 80. We can see that over the past two days it began outperforming the SPY. The stop is set where the double bottom would be considered busted at 7.7% or $111.61.
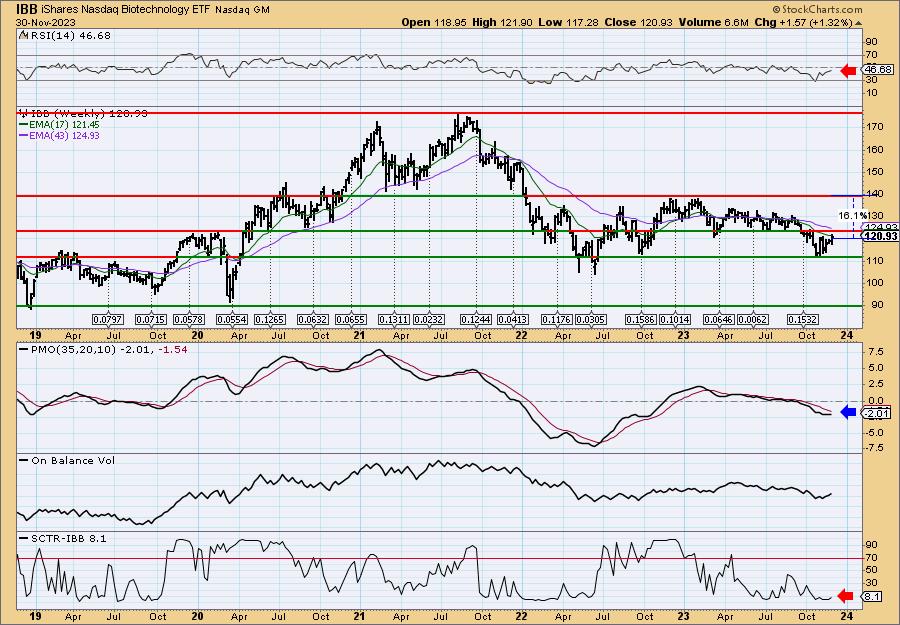
Price reversed on support and is now coming up against resistance again. I would keep this one as a short-term trade as the weekly chart could use some help. The RSI is negative, but rising. The PMO has flattened likely in preparation for a turn back up. The SCTR is in the basement. Should it breakout, I've set upside potential at 16.1%.
Don't forget, on Thursdays I look at reader-requested symbols, click HERE to send me an email. I read every email I receive and try to answer them all!
Current Market Outlook:
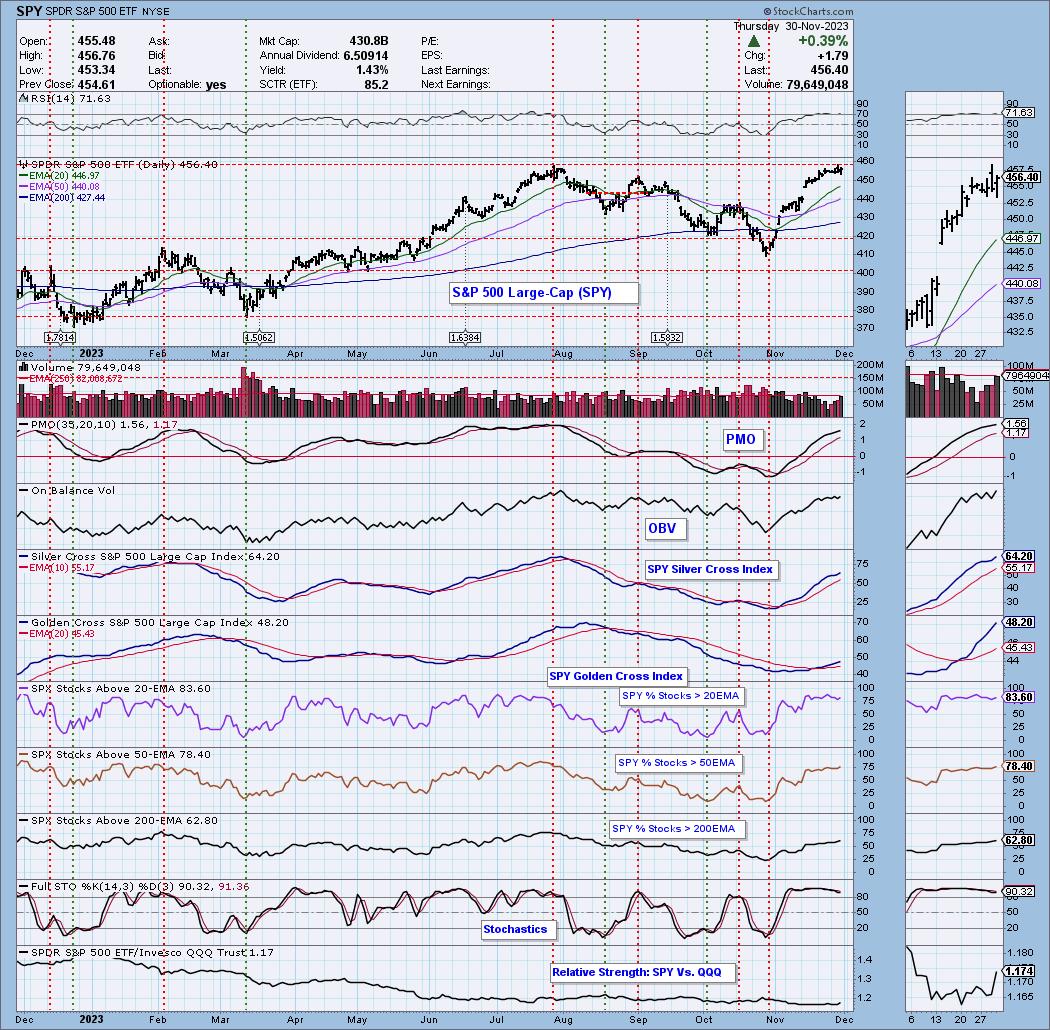
Market Environment: It is important to consider the odds for success by assessing the market tides. The following chart uses different methodologies for objectively showing the depth and trend of participation for intermediate- and long-term time frames.
- The Silver Cross Index (SCI) shows the percentage of SPX stocks on IT Trend Model BUY signals (20-EMA > 50-EMA)
- The Golden Cross Index (GCI) shows the percentage of SPX stocks on LT Trend Model BUY signals (50-EMA > 200-EMA)
Don't forget that as a "Diamonds" member, you have access to our GCI/SCI curated ChartList on DecisionPoint.com. You'll find it under "Members Only" links on the left side on the Blogs and Links Page.
Here is the current chart:
Full Disclosure: I am 70% long, 0% short.
I'm required to disclose if I currently own a stock I mention and/or may buy/short it within the next 72 hours.
"Technical Analysis is a windsock, not a crystal ball." - Carl Swenlin
(c) Copyright 2023 DecisionPoint.com
Watch the latest episode of DecisionPoint Trading Room with Carl & Erin Swenlin on Mondays 3:00p EST or on the DecisionPoint playlist on the StockCharts TV YouTube channel here!
NOTE: The stocks reported herein are from mechanical trading model scans that are based upon moving average relationships, momentum and volume. DecisionPoint analysis is then applied to get five selections from the scans. The selections given should prompt readers to do a chart review using their own analysis process. This letter is not a call for a specific action to buy, sell or short any of the stocks provided. There are NO sure things or guaranteed returns on the daily selection of "Diamonds in the Rough."
Regarding BUY/SELL Signals: The signal status reported herein is based upon mechanical trading model signals and crossovers. They define the implied bias of the price index/stock based upon moving average relationships and momentum, but they do not necessarily call for a specific action. They are information flags that should prompt chart review. Further, they do not call for continuous buying or selling during the life of the signal. For example, a BUY signal will probably (but not necessarily) return the best results if action is taken soon after the signal is generated. Additional opportunities for buying may be found as price zigzags higher, but the trader must look for optimum entry points. Conversely, exit points to preserve gains (or minimize losses) may be evident before the model mechanically closes the signal.
Helpful DecisionPoint Links:
Price Momentum Oscillator (PMO)
Swenlin Trading Oscillators (STO-B and STO-V)
For more links, go to DecisionPoint.com