
We had quite a bit of symbols to look at in today's Diamond Mine trading room this morning. After picking the Industry Group to Watch, I was able to glean three very interesting symbols. Finally at the end of the program, I was able to run a few scans to find some interesting selections to consider next week. Those symbols are: CRMT, AKAM, CLF, CRC, DOCS, HP, R and WY.
A few of the symbols are overbought, but they still have room to run in my opinion. You might be able to get a better price if they pullback on overbought conditions.
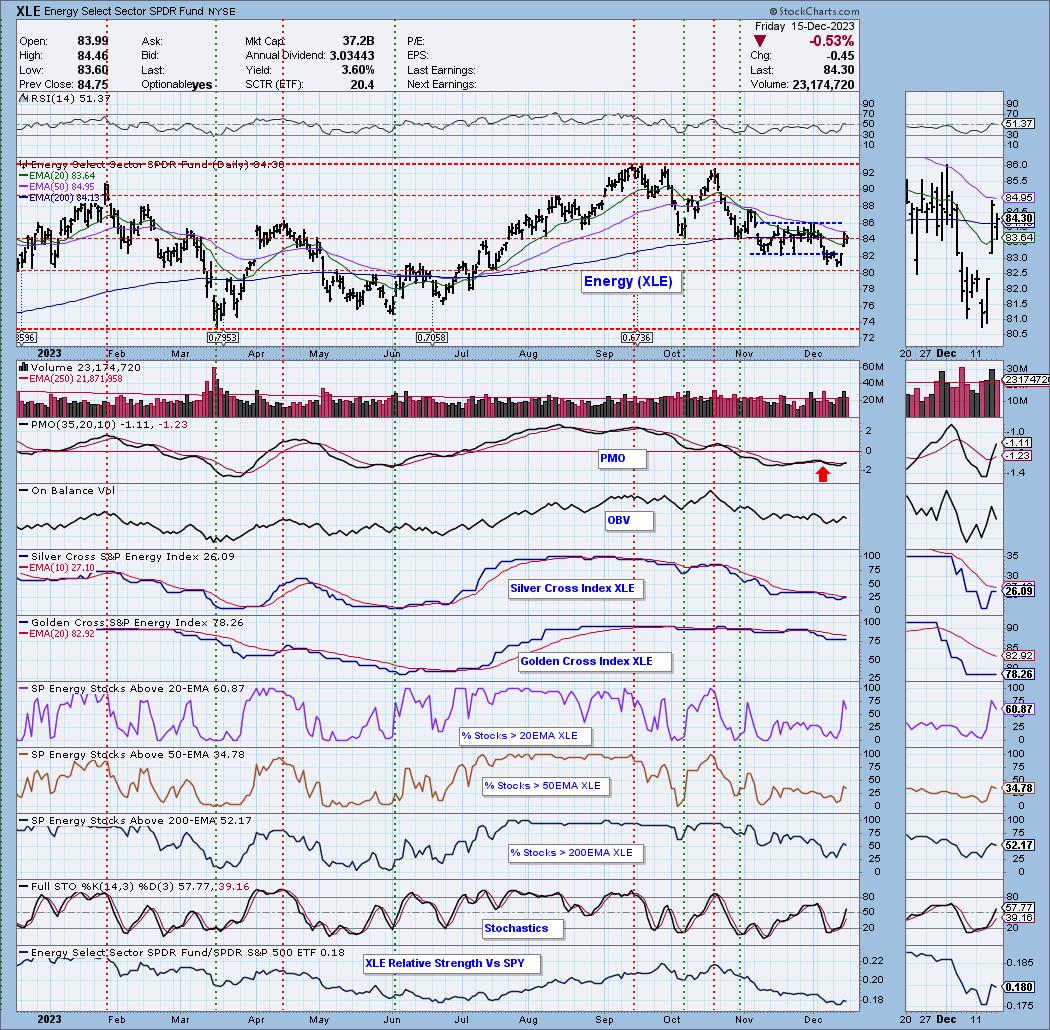
The Sector to Watch turned out to be Energy (XLE). While I don't fully trust this sector, it is showing new momentum and could wake up. Definitely watch list material. I will say that Consumer Discretionary, which we didn't discuss this morning, looks very bullish and could've been today's Sector to Watch. Its biggest problem is overbought participation and price. Still, not a bad area to consider fishing from next week.
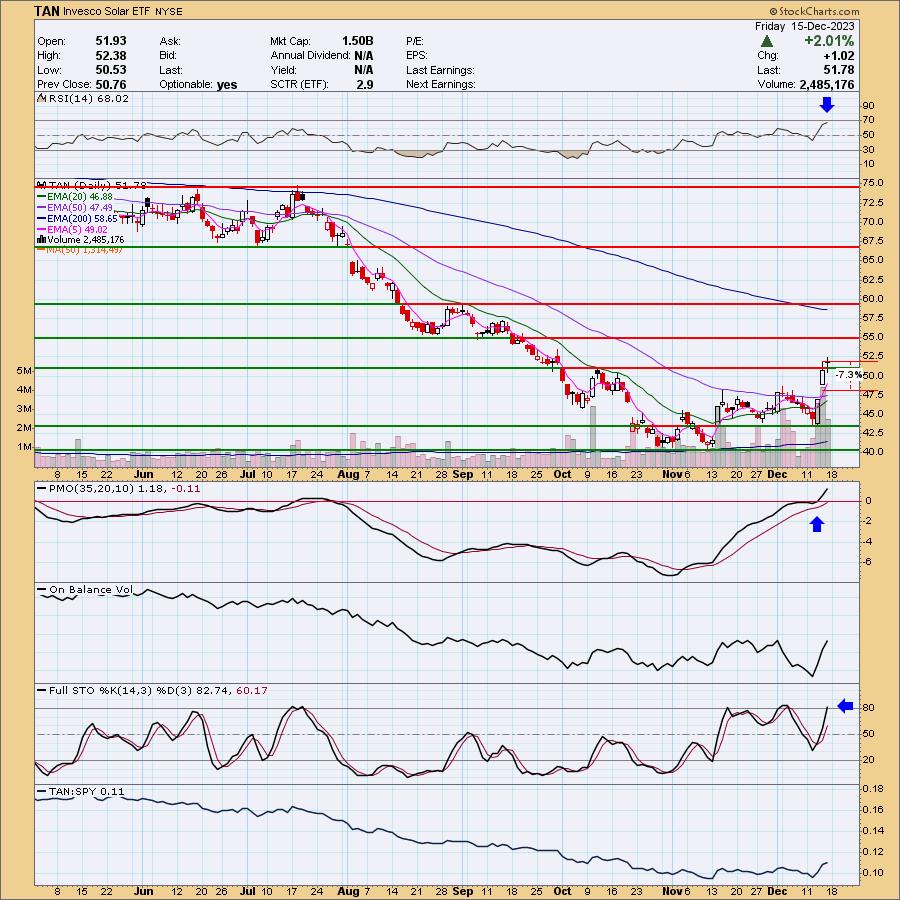
The Industry Group to Watch did not come from the Energy sector, it was from the Technology sector. Renewable Energy (TAN) looks very good going into next week. Three symbols of interest here are FSLR, ENPH and RUN.
This week's "Darling" turned out to be Tarsus Pharma (TARS) which was up 5.72% since being picked on Tuesday. The "Dud" was Molina Healthcare (MOH). It is down -4.10% since being picked on Tuesday.
Have a great weekend!
Good Luck & Good Trading,
Erin

RECORDING LINK (12/15/2023):
Topic: DecisionPoint Diamond Mine (12/15/2023) LIVE Trading Room
Passcode: December#15
REGISTRATION for 12/22/2023:
When: Dec 22, 2023 09:00 AM Pacific Time (US and Canada)
Topic: DecisionPoint Diamond Mine (12/22/2023) LIVE Trading Room
Register in advance for this webinar HERE
After registering, you will receive a confirmation email containing information about joining the webinar.

Our latest DecisionPoint Trading Room recording (12/4, no recording on 12/11):
A few items about the spreadsheet: I've put on the spreadsheet whether the RSI is positive (green) or negative (red). The PMO column tells you if it is rising (green) or falling (red). Finally I've added my own "Sparkle Factor" that gives you my assessment going forward, bullish (green), bearish (red) or neutral (gray). The Sparkle Factor is basically my thoughts on whether I expect it to rise or fall. A neutral means it could really go either way so it could be added to a watch list. If you're in a stock I consider "neutral" going forward, the ball is in your court.
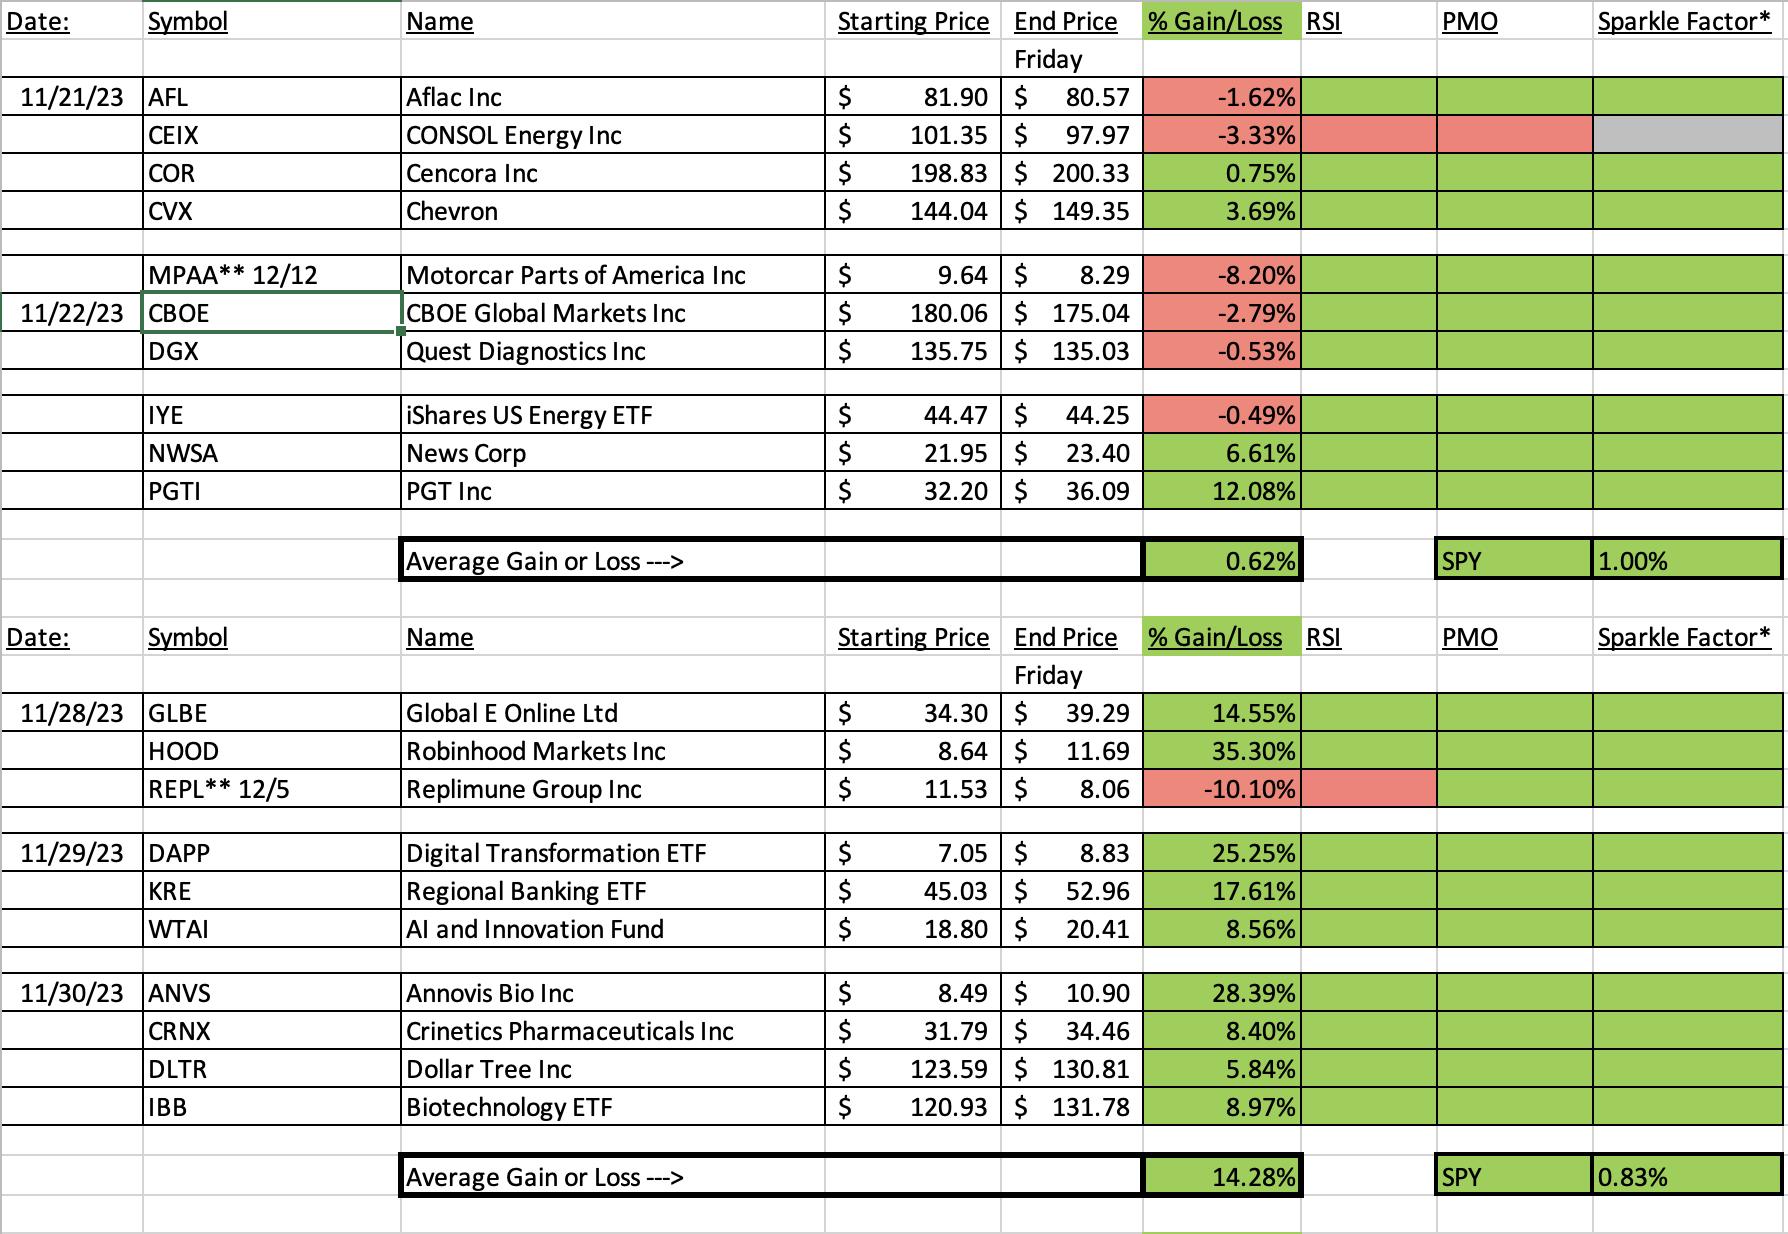
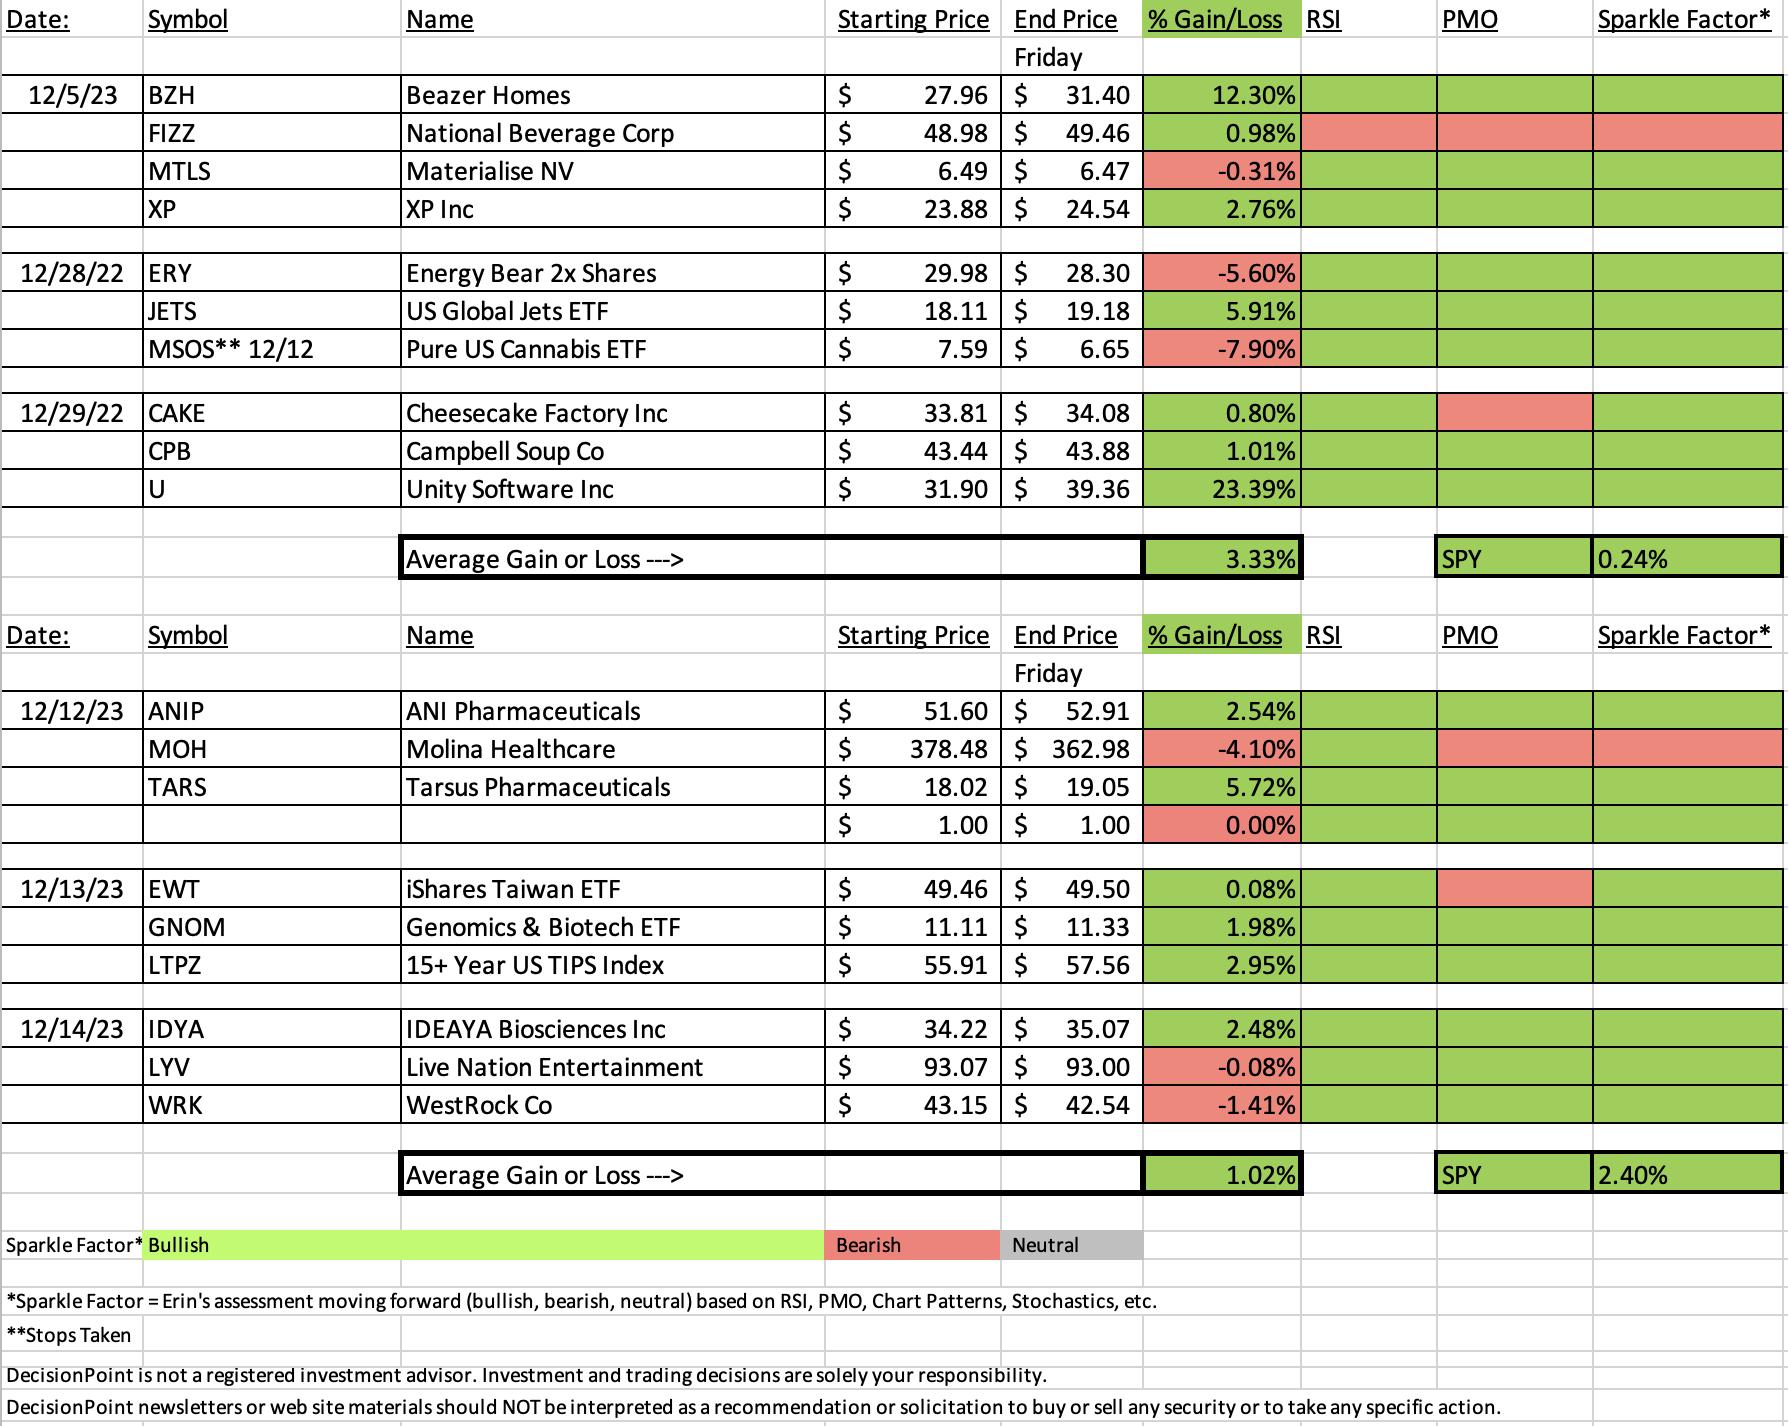
Darling:
Tarsus Pharmaceuticals Inc. (TARS)
EARNINGS: 03/13/2024 (AMC)
Tarsus Pharmaceuticals, Inc. is a clinical-stage biopharmaceutical company, which focuses on the development and commercialization of therapeutic candidates. Its product candidate, TP-03, is a novel therapeutic in Phase 2b/3 that is being developed for the treatment of blepharitis caused by the infestation of Demodex mites, which is referred to as Demodex blepharitis. The company was founded by Bobak Azamian and D. Michael Ackermann in 2017 and is headquartered in Irvine, CA.
Predefined Scans Triggered: P&F Double Top Breakout and P&F Bearish Signal Reversal.
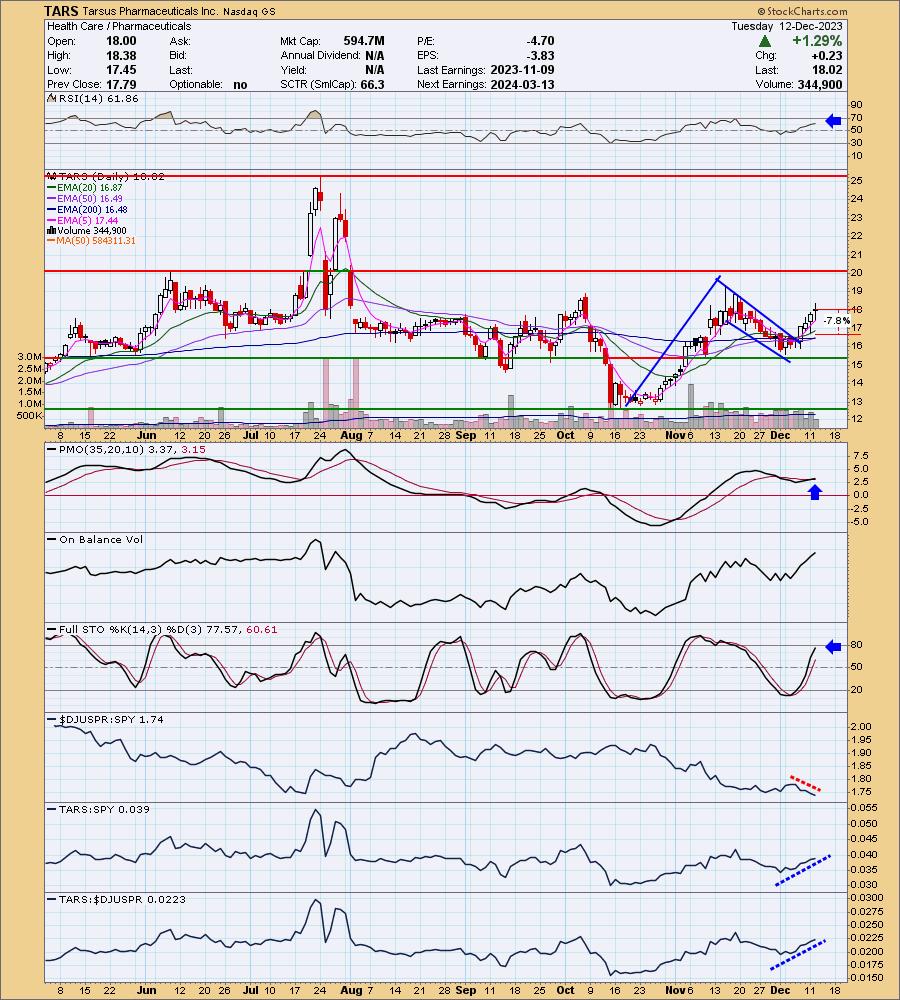
Below are the commentary and chart from Tuesday, 11/12:
"TARS is down -3.16% in after hours trading so this "boom or bust" stock may struggle a bit near-term. I don't see what is going on in after hours trading until I start writing. I don't want it to be a determining factor on picking "Diamonds in the Rough". I was drawn to the chart due to the bull flag formation and the confirmation of the pattern on the breakout. Based on the chart pattern, price should make its way to the July high once again. The RSI is positive and there is a new PMO Crossover BUY Signal. Stochastics have been rising strongly. As noted earlier, the group isn't doing so hot, but TARS is outperforming both the SPY and the group right now. The stop is set to land right around the 50-day EMA at 7.8% or $16.61."
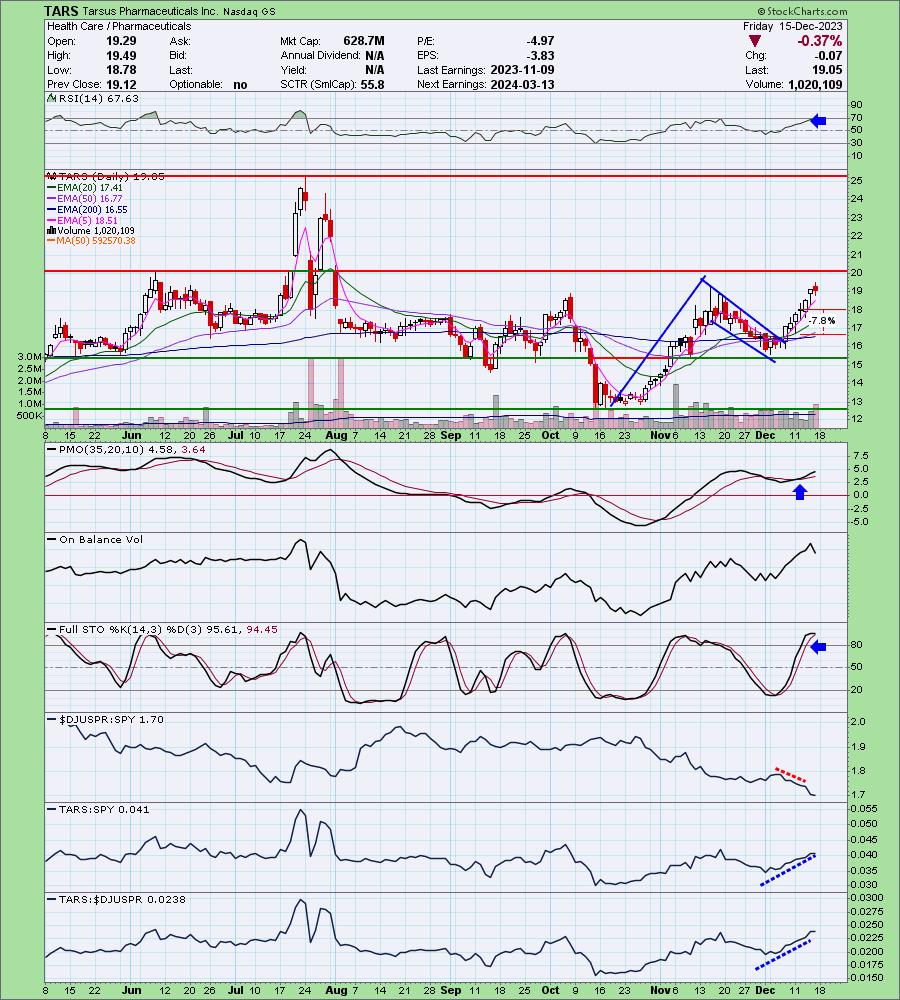
Here is today's chart:
TARS paused today but still formed a higher low and higher high. Another flag could be building. Since being picked, the RSI has remained positive and not overbought. Stochastics have now moved above 80. The chart is still very strong, but it may need more pause or a pullback so keep it on the watch list and consider entry after a pullback. It does look good moving forward, I just think you could get a better entry.
Don't forget, on Thursdays I look at reader-requested symbols, so shoot me an email at erin@decisionpoint.com. I read every email I receive and try to answer them all!
Dud:
Molina Healthcare, Inc. (MOH)
EARNINGS: 02/07/2024 (AMC)
Molina Healthcare, Inc. engages in the provision of health care services. It operates through the following segments: Medicaid, Medicare, Marketplace, and Other. The company was founded by C. David Molina in 1980 and is headquartered in Long Beach, CA.
Predefined Scans Triggered: Elder Bar Turned Green, New CCI Buy Signals, New 52-week Highs, Moved Above Upper Bollinger Band, Moved Above Upper Price Channel and P&F Double Top Breakout.
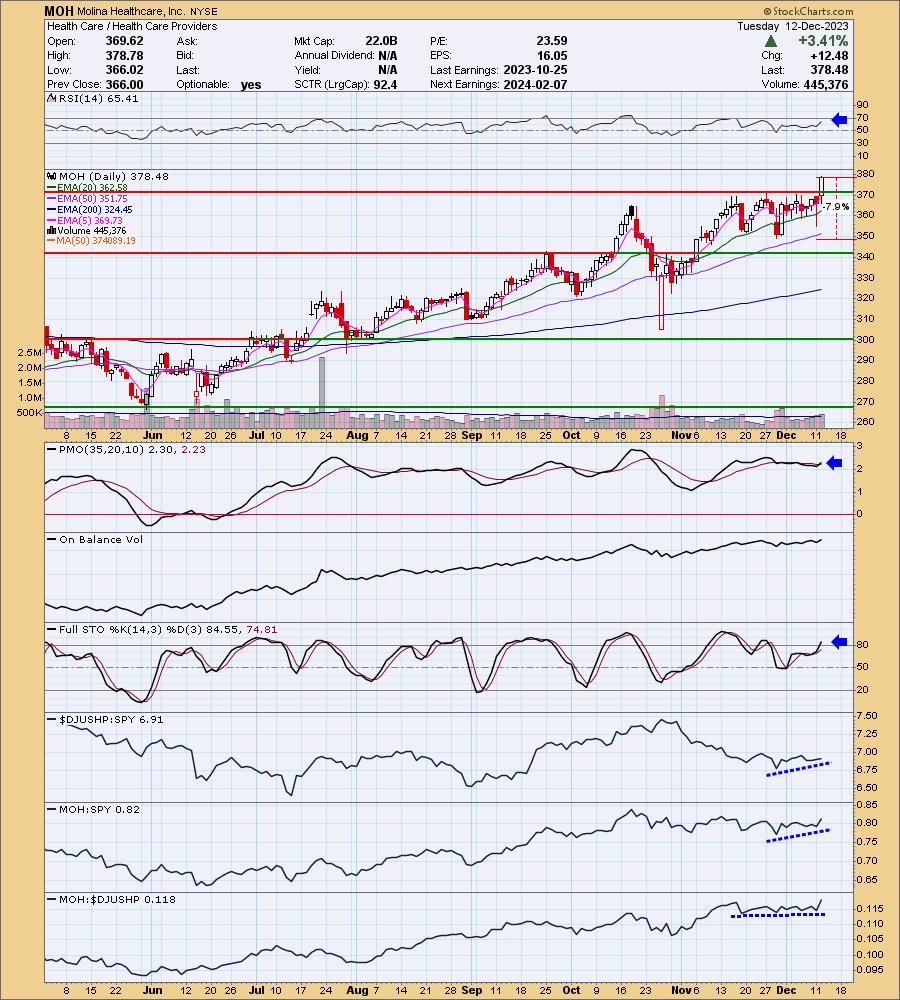
Below are the commentary and chart from Tuesday, 12/12:
"MOH is up +0.45% in after hours trading. This is a likely "winner that keeps on winning" stock. I was impressed with today's breakout above overhead resistance. The RSI is positive and there is a new PMO Crossover BUY Signal. Stochastics have just reached above 80. The Health Care Providers industry group is healthier than the Pharma group as we see a rising relative strength line. MOH is outperforming on its own against the SPY as it is traveling in line with the group itself. I've set the stop below support at 7.9% or $348.58."
Here is today's chart:
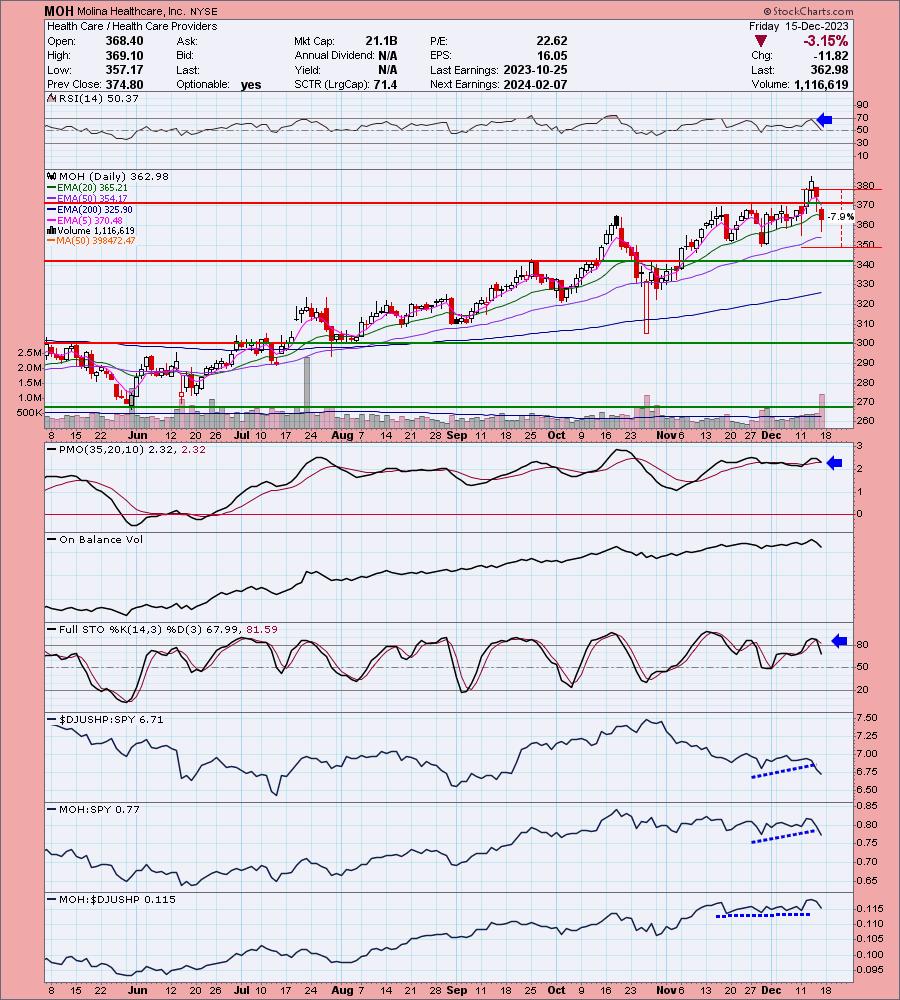
We got only one day of rally before this one headed south. The chart has fallen apart so I wouldn't stay in it if you're in. The PMO is now giving us a Crossover SELL Signal and relative strength has fallen off the map. Bad pick.
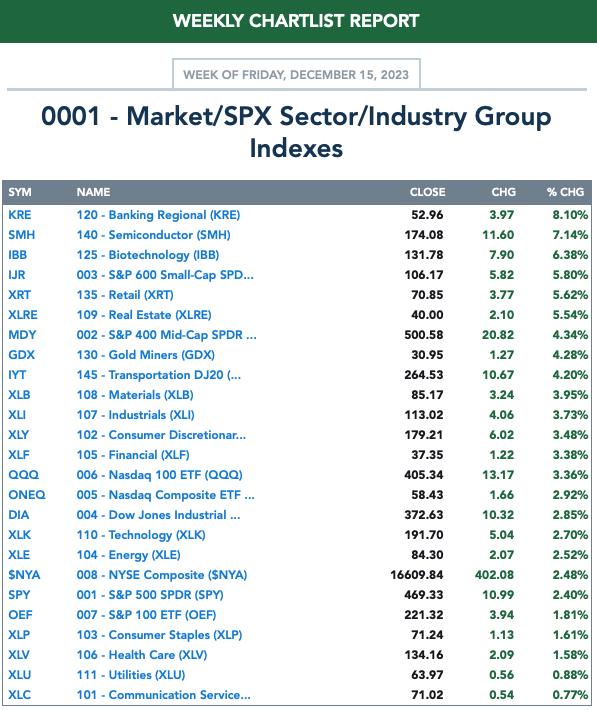
THIS WEEK's Performance:
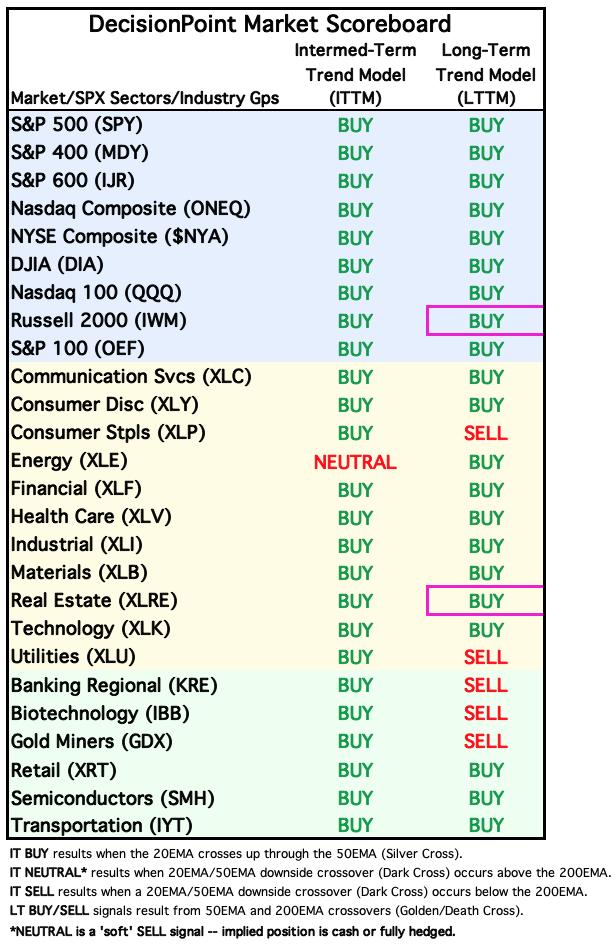
DecisionPoint Market Scoreboard (Mechanical Trend Model Signals):
Friday's signal changes are outlined in purple.
Click Here to view Carl's annotated "Under the Hood" ChartList!
Sector to Watch: Energy (XLE)
I will say that I don't completely trust this sector yet, but I simply couldn't ignore the major improvement to participation of stocks above their 20/50/200-day EMAs. They lost a little today on the decline, but remain strong. We don't have %Stocks > 50EMA above our 50% bullish threshold and the Silver Cross Index is still below its signal line, but this one looks like it could reverse next week. Watch list material if nothing else.
Industry Group to Watch: Renewable Energy (TAN)
TAN is waking up and there is plenty of upside potential to be had in this group. Price broke out above overhead resistance today. It does have a few more levels of resistance to overcome, but this rally looks legitimate. The RSI is positive, rising and not overbought. The PMO is rising above the zero line and picking up momentum. Stochastics just popped above 80 and relative strength is beginning to seep in. This can be a very volatile area of the market so keep that in mind. If you foray into this area, I would keep my position size fairly conservative. Symbols in this area to consider: FSLR, ENPH and RUN.
Go to our Under the Hood ChartList on DecisionPoint.com to get an in-depth view of all the sectors. On StockCharts.com you can find the Industry Summary.
Good Luck & Good Trading!
- Erin
erin@decisionpoint.com
Full Disclosure: I'm 80% long, 0% short.
Watch the latest episode of the DecisionPoint Trading Room with Carl & Erin Swenlin on Mondays 3:00p EST!
Technical Analysis is a windsock, not a crystal ball. --Carl Swenlin
NOTE: The stocks reported herein are from mechanical trading model scans that are based upon moving average relationships, momentum and volume. DecisionPoint analysis is then applied to get selections from the scans. The selections given should prompt readers to do a chart review using their own analysis process. This letter is not a call for a specific action to buy, sell or short any of the stocks provided. There are NO sure things or guaranteed returns on the selection of "diamonds in the rough."
Helpful DecisionPoint Links:
DecisionPoint Shared ChartList and DecisionPoint Chart Gallery
Price Momentum Oscillator (PMO)
Swenlin Trading Oscillators (STO-B and STO-V)
(c) Copyright 2023 DecisionPoint.com