
The market is cooling and it is becoming apparent based on the number of scan results. With a strong rally out of the October low, I saw lots of scan results on the way up. The market has paused to digest that big rally and it is obvious. My Diamond PMO Scan usually will get me about 40 or 50 results in a bull market move. Today I only had a handful.
This tells me that we need to be careful adding to our portfolios right now. Personally, I'm holding off until the next leg up and making sure what I do have holds up technically.
Good Luck & Good Trading,
Erin
Today's "Diamonds in the Rough": BZH, FIZZ, MTLS and XP.
Runner-ups: GD, CENTA, JAZZ, UNH, MOH, MOD, AXL and CNXN.

RECORDING LINK (12/1/2023):
Topic: DecisionPoint Diamond Mine (12/1/2023) LIVE Trading Room
Passcode: December#1
REGISTRATION for 12/8/2023:
When: Dec 8, 2023 09:00 AM Pacific Time (US and Canada)
Topic: DecisionPoint Diamond Mine (12/8/2023) LIVE Trading Room
Register in advance for this webinar HERE
After registering, you will receive a confirmation email containing information about joining the webinar.

Here is the last recording from 12/4:
Welcome to DecisionPoint Diamonds, wherein I highlight ten "Diamonds in the Rough" per week. These are selected from the results of my DecisionPoint Scans which search for stocks that could benefit from the trend and condition of the market. Remember, these are not recommendations to buy or sell, but are the most interesting of the stocks that surfaced in my scans. My objective is to save you the work of the initial, tedious culling process, but you need to apply your own analysis to see if these stocks pique your interest as well. There are no guaranteed winners here!
"Predefined Scans Triggered" are taken from StockCharts.com using the "Symbol Summary" option instead of a "SharpChart" on the workbench.
Stop levels are all rounded down.
Beazer Homes USA, Inc. (BZH)
EARNINGS: 02/01/2024 (AMC)
Beazer Homes USA, Inc. engages in the design and sale of single-family and multi-family homes. It operates through the following geographical segments: West, East, and Southeast. The West segment includes Arizona, California, Nevada, and Texas. The East segment consists of Delaware, Indiana, Maryland, Tennessee, and Virginia. The Southeast segment focuses on the Florida, Georgia, North Carolina, and South Carolina. The company was founded in 1985 and is headquartered in Atlanta, GA.
Predefined Scans Triggered: Moved Above Ichimoku Cloud and Parabolic SAR Buy Signals.
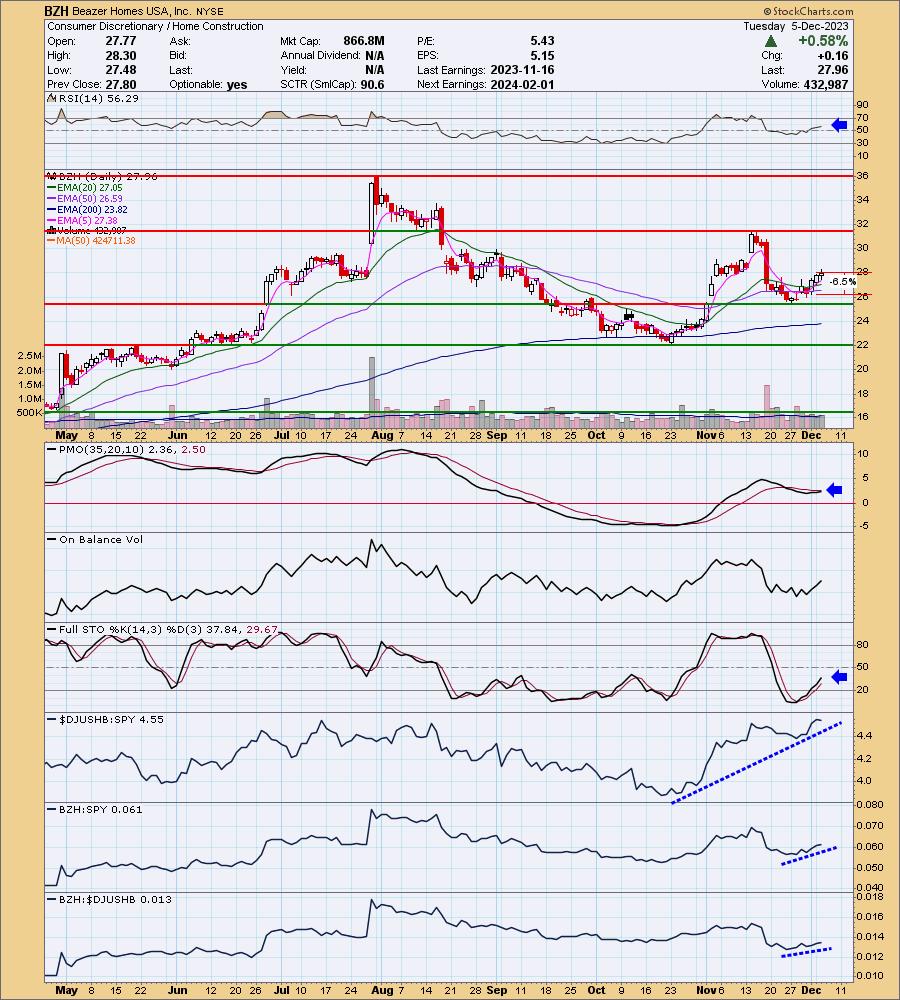
BZH is unchanged in after hours trading. This one caught my eye due to the cup shaped bottom that recently formed on support. After a breakout and then a deep correction, it is recovering. The RSI is positive and the PMO is nearing a Crossover BUY Signal. Stochastics are rising strongly. The group has been on a tear since the October low, outperforming the SPY in a big way. BZH is showing leadership among the group members and is outperforming the SPY. The stop is set at 6.5% below the 50-day EMA or $26.14.
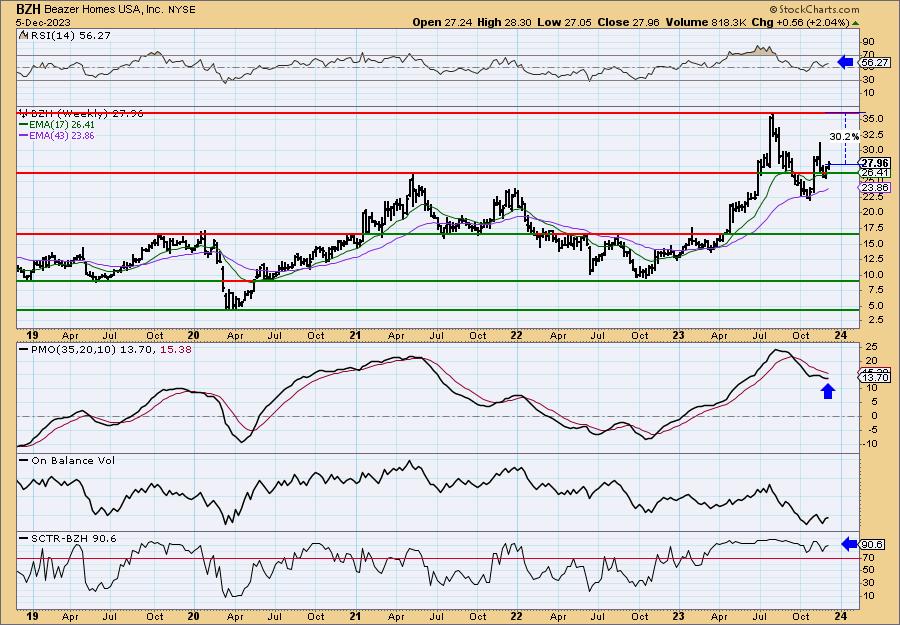
The weekly chart is positive and therefore we could consider this one in the intermediate term. The weekly RSI is positive and rising. The weekly PMO is turning back up. The StockCharts Technical Rank (SCTR) is in the hot zone* above 70 and has been most of the year. If it can reach all-time highs again it would be an over 30% gain.
*If a stock is in the "hot zone" above 70, it implies that it is stronger than 70% of its universe (large-, mid-, small-caps and ETFs) primarily in the intermediate to long terms.
National Beverage Corp. (FIZZ)
EARNINGS: 12/07/2023 (AMC) ** Reports Thursday **
National Beverage Corp. engages in the development, manufacture, market, and sale of sparkling waters, juices, energy drinks, and carbonated soft drinks. Its brands include LaCroix, LaCroix Crate, LaCroix NiCola, Clear Fruit, Rip It, Everfresh, Everfresh Premier Varietals, Mr. Pure, Shasta, and Faygo. The company was founded by Nick A. Caporella in 1985 and is headquartered in Fort Lauderdale, FL.
Predefined Scans Triggered: Three White Soldiers and Parabolic SAR Buy Signals.
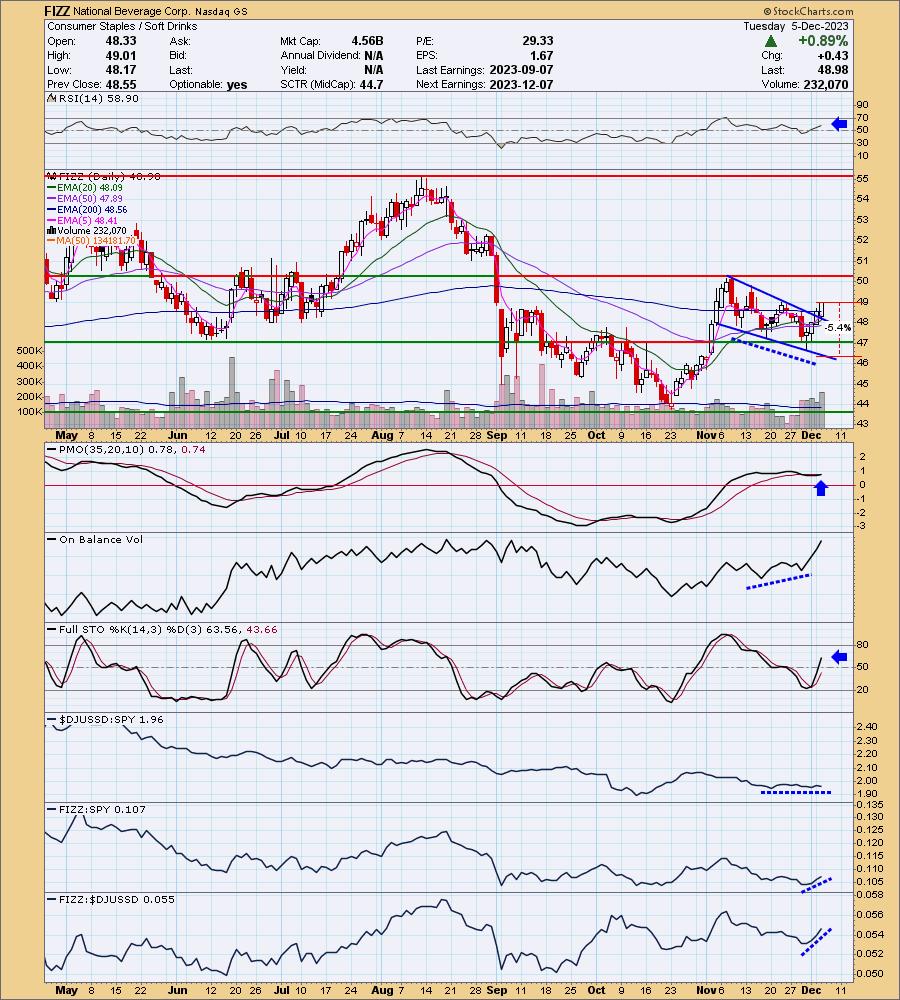
FIZZ is up +0.35% in after hours trading. We have a not so well-known candlestick pattern, Three White Soldiers. This is a bullish reversal pattern that suggests more upside ahead. Price also broke from a bullish falling wedge pattern. The RSI is positive and not overbought. The PMO just triggered a Crossover BUY Signal. There is a positive divergence between OBV bottoms and price lows. Stochastics are rising strongly and relative strength is building. This is a defensive stock that should hold up through more market pause. The stop is set below support at 5.4% or $46.33.
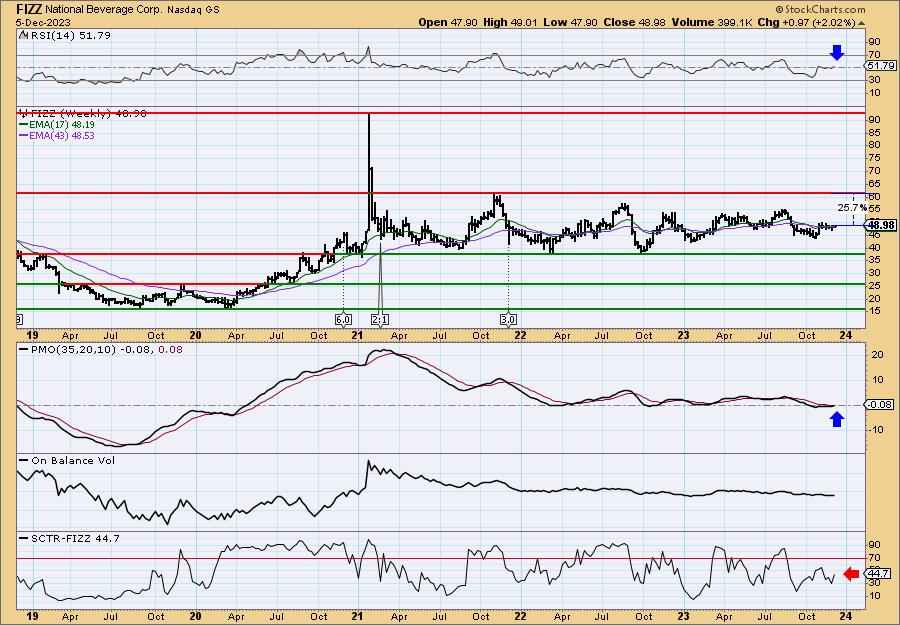
This is a rather typical Consumer Staples kind of chart. Mostly made up of a trading range. Currently it is in the middle of the range. The weekly RSI is now positive and the weekly PMO is generating a Crossover BUY Signal. The SCTR could be better, but at least it is improving. Upside potential should it reach the top of the range is about 25.7%.
Materialise NV (MTLS)
EARNINGS: 02/15/2024 (BMO)
Materialise NV engages in the provision of additive manufacturing software and 3D printing services. It operates through the following segments: Materialise Software, Materialise Medical, and Materialise Manufacturing. The Materialise Software segment offers proprietary software worldwide through programs and platforms that enable companies to set up reliable and sustainable 3D printing production. The Materialise Medical segment includes medical software solutions, medical devices and other related products and services. The Materialise Manufacturing segment provides 3D printed services to industrial and commercial customers. The company was founded by Wilfried Vancraen and Hilde Ingelaere on June 28, 1990 and is headquartered in Leuven, Belgium.
Predefined Scans Triggered: Elder Bar Turned Green.
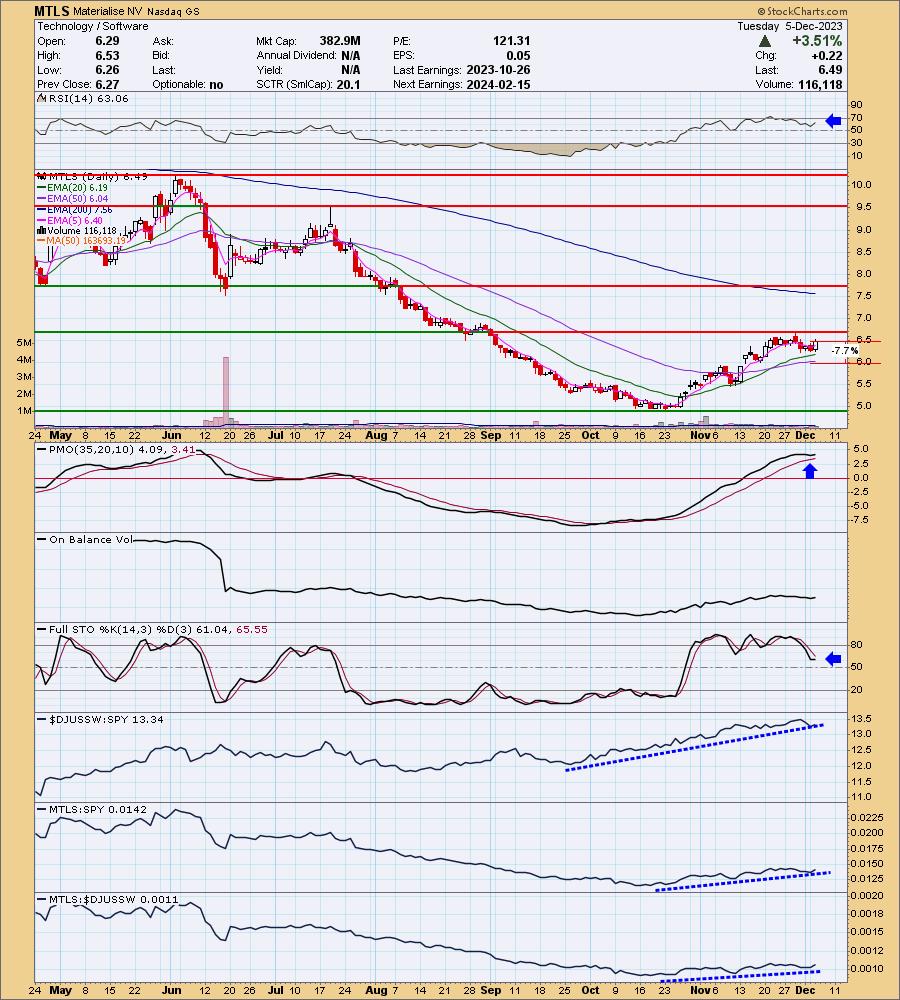
MTLS is down -3.08% in after hours trading. This is a 'boom or bust' type of stock and based on after hours trading, it seems more at risk as a bust. However, I don't base my picks on after hours trading and it would certainly offer a better entry. It is a low priced stock, so position size wisely if you are okay with the risk. The RSI is positive and the PMO has surged above the signal line. Stochastics have halted their decline. The group continues to show outperformance and MTLS is outperforming the SPY and the group modestly. The stop is set beneath the 50-day EMA at 7.7% or $5.99.
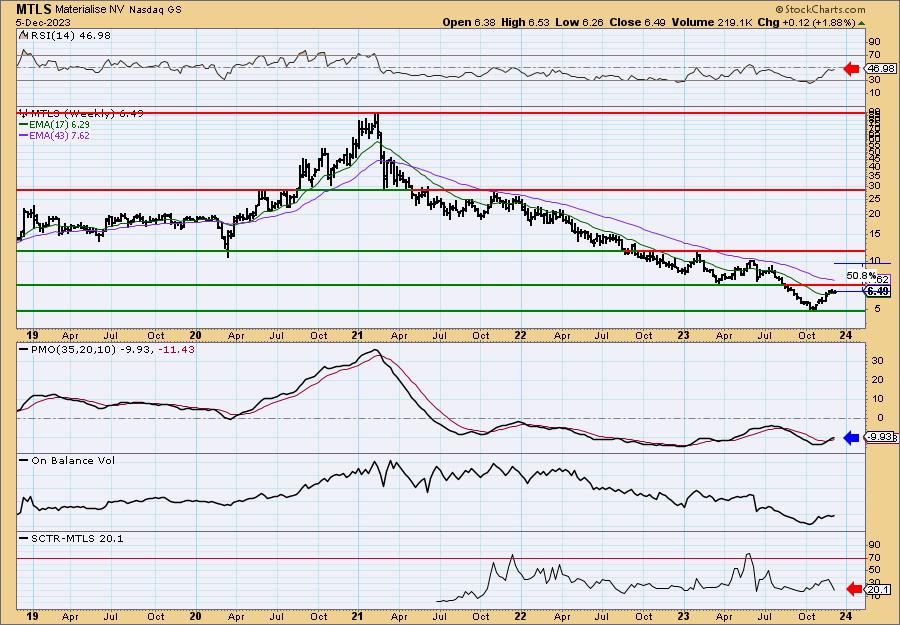
Here's where the 'boom' comes in on this stock. Upside potential is very high even if it just makes it through half of the next trading range. The weekly RSI is negative, but rising. The weekly PMO is on a Crossover BUY Signal. I don't like the way the SCTR is reacting so I would keep this in the short-term timeframe.
XP Inc (XP)
EARNINGS: 02/15/2024 (AMC)
XP, Inc. engages in the operation of technology-driven financial services platform. The firm provides customers with two principal types of offerings, financial advisory services for retail clients in Brazil, high-net-worth clients, international clients and corporate and institutional clients, and an open financial product platform providing access to over 800 investment products including equity and fixed income securities, mutual and hedge funds, structured products, life insurance, pension plans, real-estate investment funds (REITs) and others from XP, its partners and competitors. he company was founded by Guilherme Dias Fernandes Benchimol in 2001 and is headquartered in Vila Olimpia, Brazil.
Predefined Scans Triggered: Elder Bar Turned Green, New CCI Buy Signals, Moved Above Ichimoku Cloud, Parabolic SAR Buy Signals and P&F Low Pole.
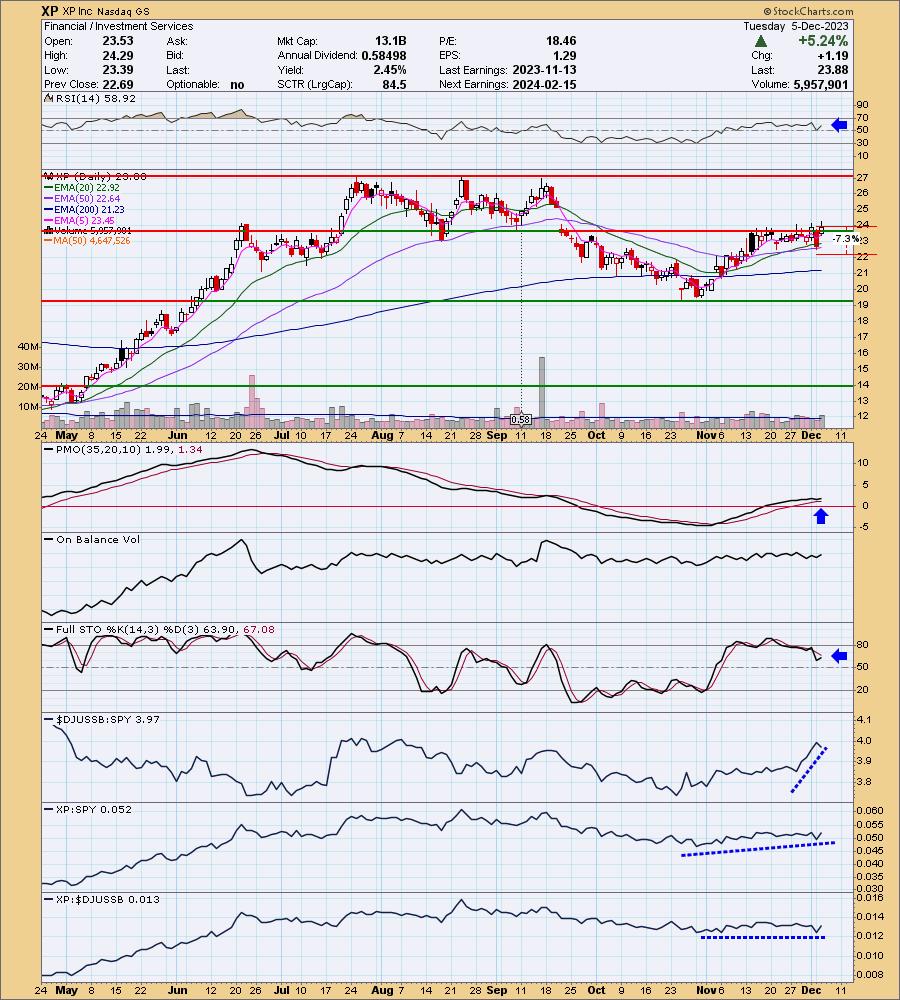
XP is unchanged in after hours trading. Price is still mostly stuck beneath resistance, but today we did see a close just above resistance. The RSI is positive and the PMO has surged above the signal line. Stochastics are in positive territory and have turned up on today's strong rally. Relative strength for the group is incredible and that has afforded XP and opportunity to outperform the SPY since it is performing in line with the group. The stop is set beneath support and the 50-day EMA at 7.3% or $22.13.
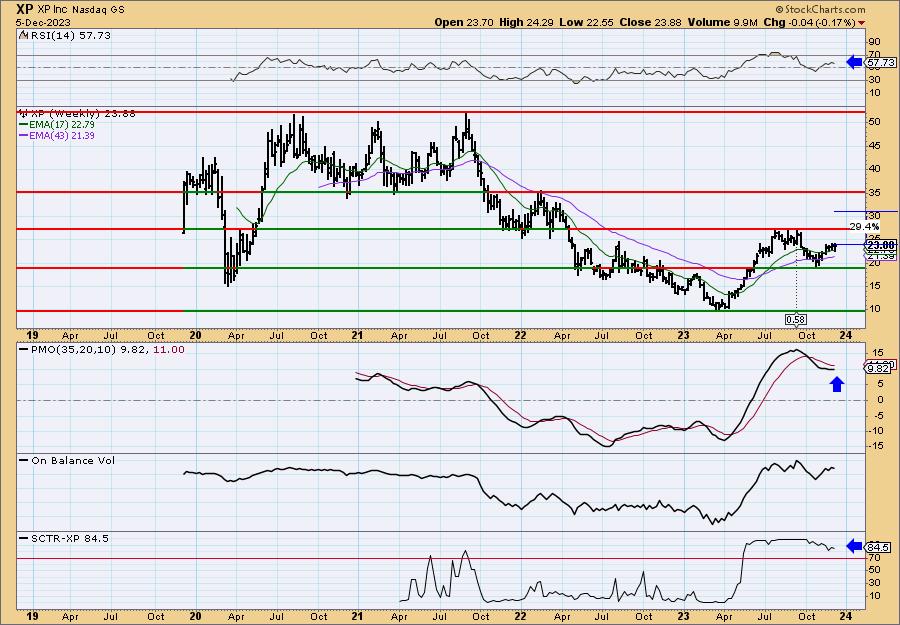
The weekly chart is favorable enough to consider this in the intermediate-term timeframe. The weekly RSI is positive and the weekly PMO is turning back up. The SCTR is in the hot zone. I've marked an upside target around 29.4% which takes us halfway into the next trading range.
Don't forget, on Thursdays I look at reader-requested symbols, click HERE to send me an email. I read every email I receive and try to answer them all!
Current Market Outlook:
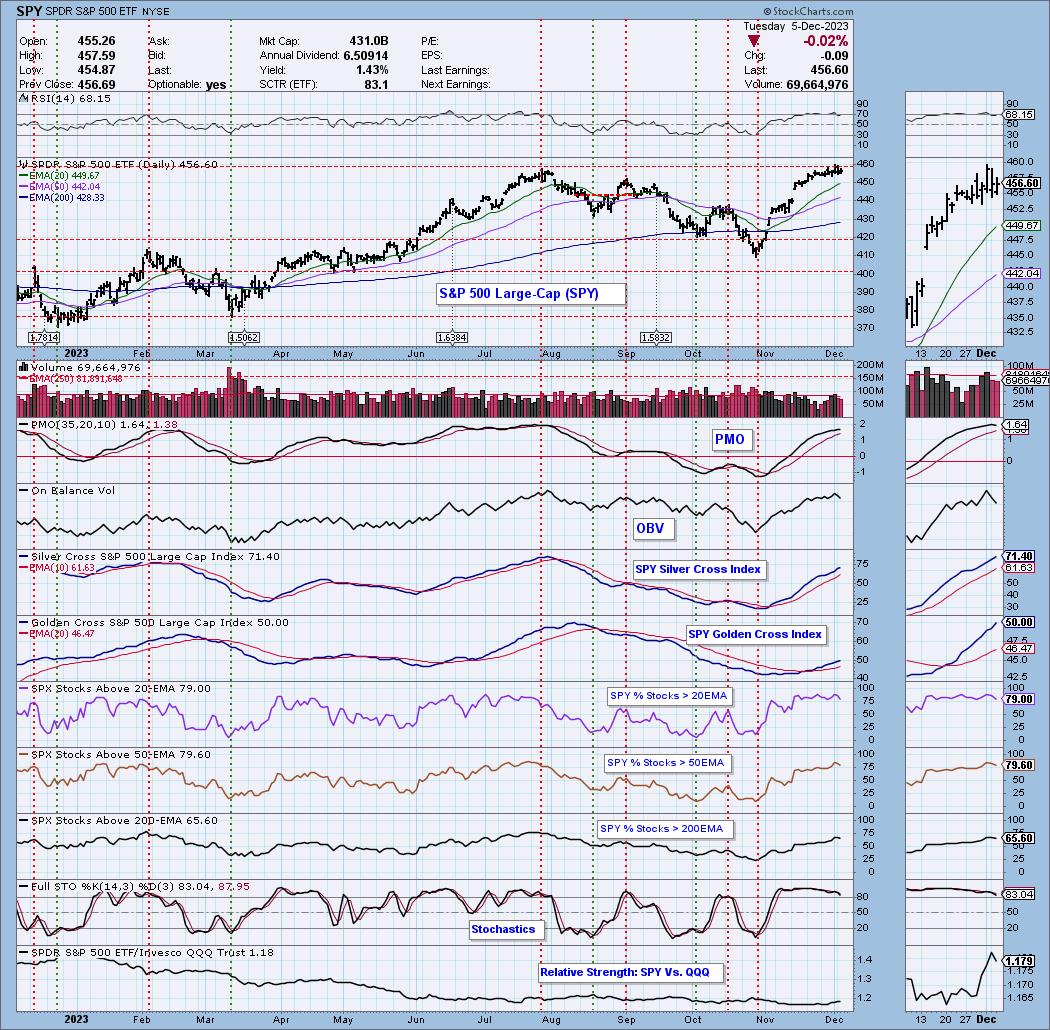
Market Environment: It is important to consider the odds for success by assessing the market tides. The following chart uses different methodologies for objectively showing the depth and trend of participation for intermediate- and long-term time frames.
- The Silver Cross Index (SCI) shows the percentage of SPX stocks on IT Trend Model BUY signals (20-EMA > 50-EMA)
- The Golden Cross Index (GCI) shows the percentage of SPX stocks on LT Trend Model BUY signals (50-EMA > 200-EMA)
Don't forget that as a "Diamonds" member, you have access to our GCI/SCI curated ChartList on DecisionPoint.com. You'll find it under "Members Only" links on the left side on the Blogs and Links Page.
Here is the current chart:
Full Disclosure: I am 70% long, 0% short.
I'm required to disclose if I currently own a stock I mention and/or may buy/short it within the next 72 hours.
"Technical Analysis is a windsock, not a crystal ball." - Carl Swenlin
(c) Copyright 2023 DecisionPoint.com
Watch the latest episode of DecisionPoint Trading Room with Carl & Erin Swenlin on Mondays 3:00p EST or on the DecisionPoint playlist on the StockCharts TV YouTube channel here!
NOTE: The stocks reported herein are from mechanical trading model scans that are based upon moving average relationships, momentum and volume. DecisionPoint analysis is then applied to get five selections from the scans. The selections given should prompt readers to do a chart review using their own analysis process. This letter is not a call for a specific action to buy, sell or short any of the stocks provided. There are NO sure things or guaranteed returns on the daily selection of "Diamonds in the Rough."
Regarding BUY/SELL Signals: The signal status reported herein is based upon mechanical trading model signals and crossovers. They define the implied bias of the price index/stock based upon moving average relationships and momentum, but they do not necessarily call for a specific action. They are information flags that should prompt chart review. Further, they do not call for continuous buying or selling during the life of the signal. For example, a BUY signal will probably (but not necessarily) return the best results if action is taken soon after the signal is generated. Additional opportunities for buying may be found as price zigzags higher, but the trader must look for optimum entry points. Conversely, exit points to preserve gains (or minimize losses) may be evident before the model mechanically closes the signal.
Helpful DecisionPoint Links:
Price Momentum Oscillator (PMO)
Swenlin Trading Oscillators (STO-B and STO-V)
For more links, go to DecisionPoint.com