
I hope your holiday was joyful and happy! We still have another holiday weekend to go. Given we are still in "holiday" mode as far as the market, I will be keeping my commentary brief today.
I talked about Energy in the title today. I had two Energy stocks come up that looked good today. I opted to only present one as I didn't want to overexpose "Diamonds in the Rough" to Energy. We had some Energy positions last week. The one I didn't include was Range Resources (RRC) but it is worth a look.
Good Luck & Good Trading,
Erin
Today's "Diamonds in the Rough": AVA, CEIX, DDD and SHEN.
Runner-ups: RRC, MEI and XPER.
** IMPORTANT **
I was asked if there would be cancellations of the Diamond Mine trading room for the holidays. The Fridays don't land on holidays so I'm planning on hosting the Diamond Mine without fail this holiday season. The free DecisionPoint Trading Room will not meet on December 25th or January 1st, so our next free trading room will be January 8th.

RECORDING & DOWNLOAD LINK (12/22/2023):
Topic: DecisionPoint Diamond Mine (12/22/2023) LIVE Trading Room
Passcode: December#22
REGISTRATION for 12/29/2023:
When: Dec 29, 2023 09:00 AM Pacific Time (US and Canada)
Topic: DecisionPoint Diamond Mine (12/29/2023) LIVE Trading Room
Register in advance for this webinar LINK
After registering, you will receive a confirmation email containing information about joining the webinar.

Here is the last recording from 12/18:
Welcome to DecisionPoint Diamonds, wherein I highlight ten "Diamonds in the Rough" per week. These are selected from the results of my DecisionPoint Scans which search for stocks that could benefit from the trend and condition of the market. Remember, these are not recommendations to buy or sell, but are the most interesting of the stocks that surfaced in my scans. My objective is to save you the work of the initial, tedious culling process, but you need to apply your own analysis to see if these stocks pique your interest as well. There are no guaranteed winners here!
"Predefined Scans Triggered" are taken from StockCharts.com using the "Symbol Summary" option instead of a "SharpChart" on the workbench.
Stop levels are all rounded down.
Avista Corp. (AVA)
EARNINGS: 02/21/2024 (BMO)
Avista Corp. is a holding company, which engages in the provision of electric and natural gas utility business. It operates through the Avista Utilities, and Alaska Electric Light and Power Company (AEL&P) segments. The Avista Utilities segment includes electric distribution and transmission, and natural gas distribution services in parts of eastern Washington, Northern Idaho, and Northeastern and Southwestern Oregon. The AEL&P segment offers electric services in Juneau. The company was founded on March 13, 1889 and is headquartered in Spokane, WA.
Predefined Scans Triggered: P&F Low Pole.
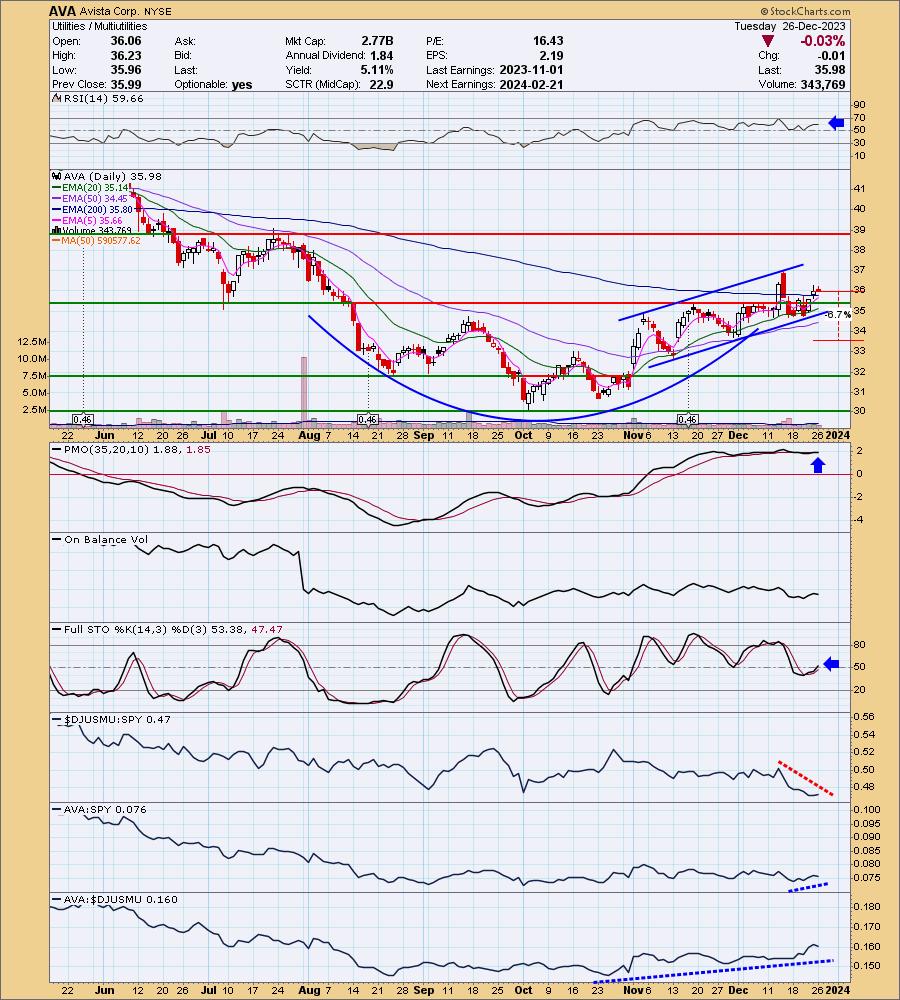
AVA is up +0.33% in after hours trading. We have a nice basing pattern and rising trend channel. The RSI is positive and the PMO just gave us a new Crossover BUY Signal. I like how Stochastics have turned up and are back above net neutral (50). The industry group isn't performing well, but AVA is outperforming the SPY anyway. At first I was worried about a flat overbought PMO, but it is not overbought at all given the downside is -4.0. It is flat because there is a steady rising trend which is good. The stop is set beneath support at the late November low around 6.7% or $33.56.
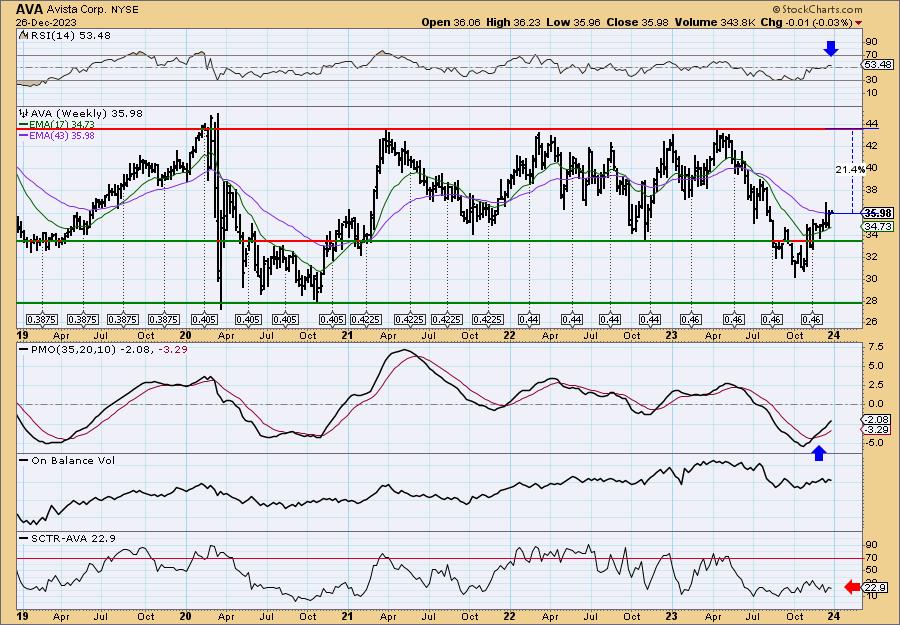
The chart is favorable with the exception of the StockCharts Technical Rank (SCTR) which is not in the hot zone* nor is it rising. I like the price pattern anyway and the weekly RSI and weekly PMO are configured very bullishly. I'm looking for upside potential to reach over 21%.
*If a stock is in the "hot zone" above 70, it implies that it is stronger than 70% of its universe (large-, mid-, small-caps and ETFs) primarily in the intermediate to long terms.
CONSOL Energy Inc. (CEIX)
EARNINGS: 02/06/2024 (BMO)
CONSOL Energy, Inc. engages in the production of bituminous coal which focuses on the extraction and preparation of coal in the Appalachian Basin. It operates under the Pennsylvania Mining Complex (PAMC) and CONSOL Marine Terminal. The PAMC segment includes mining, preparation, and marketing of bituminous coal sold to power generators, and industrial and metallurgical end-users. The CONSOL Marine Terminal segment is involved in the provision of coal export terminal services. The company was founded in 1864 and is headquartered in Canonsburg, PA.
Predefined Scans Triggered: Bullish MACD Crossovers, Filled Black Candlesticks and P&F Double Top Breakout.
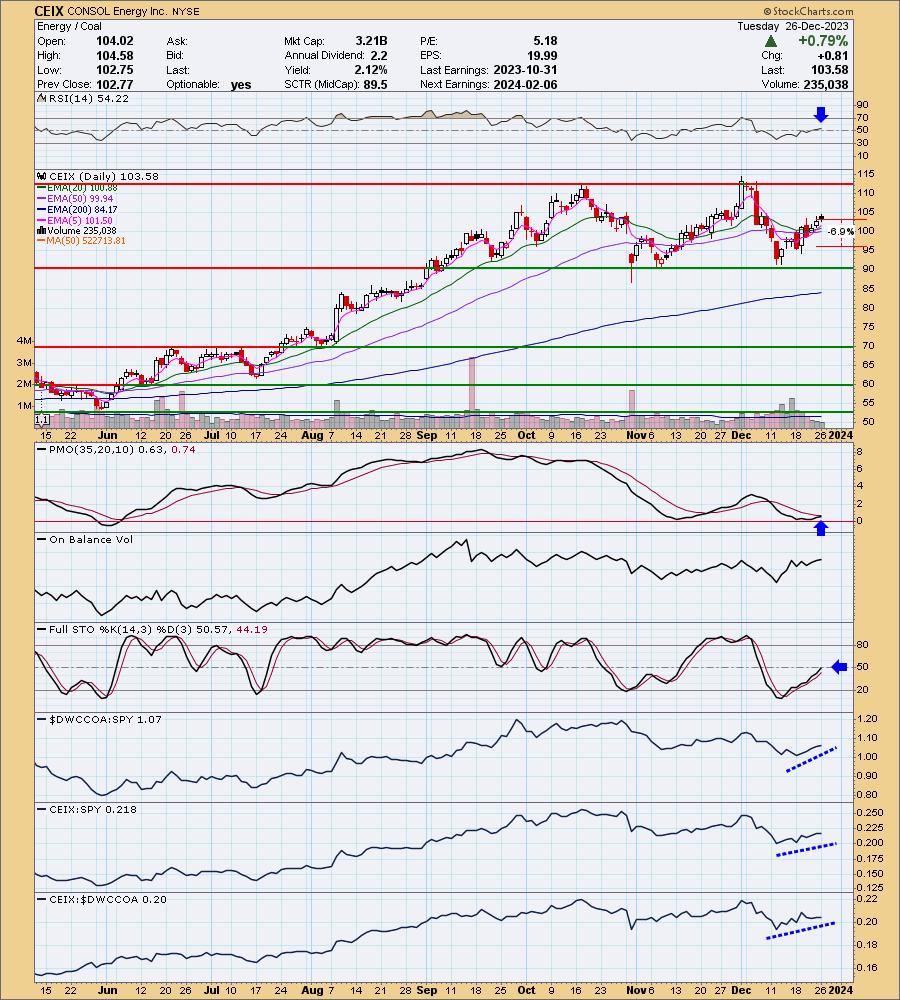
CEIX is unchanged in after hours trading. CEIX was cooking and then was taken down with the Energy sector. That sector is beginning to reverse as is CEIX. I believe it will be third times a charm when it hits overhead resistance this time around. The RSI positive and the PMO is nearing a Crossover BUY Signal. Stochastics are back above net neutral (50) and relative strength is rising strongly across the board. I've set the stop arbitrarily at 6.9% or $96.43.
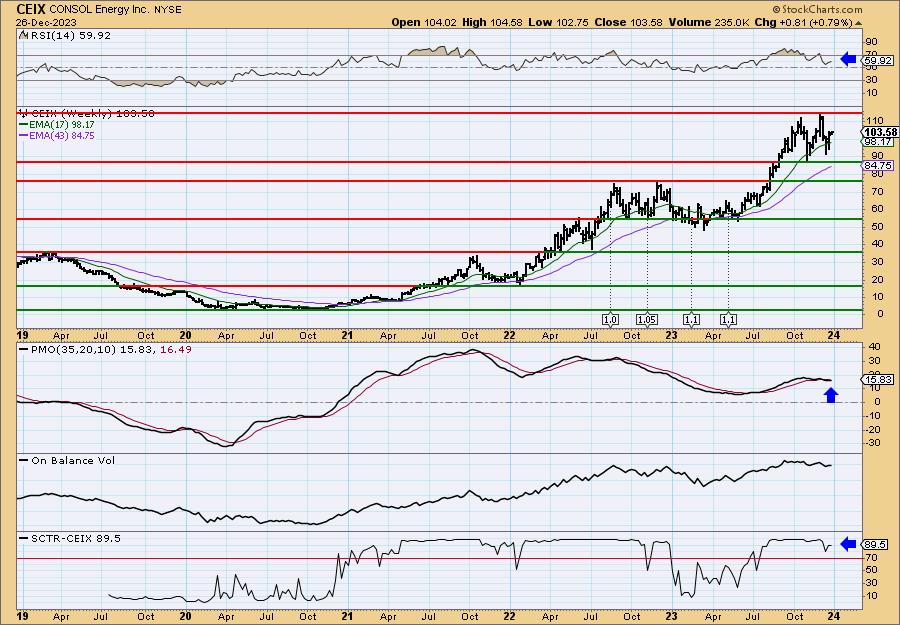
The weekly chart tells us this could be an intermediate-term investment given everything is going right. The weekly RSI is positive and not overbought. The weekly PMO is nearing a Crossover BUY Signal and the SCTR is in the hot zone. Consider a 17% upside target around $121.19.
3D Systems Corp. (DDD)
EARNINGS: 02/27/2024 (AMC)
3D Systems Corp. is a holding company, which engages in the provision of comprehensive three-dimensional printing solutions. It offers a comprehensive range of 3D printers, materials, software, haptic design tools, 3D scanners, and virtual surgical simulators. The company was founded by Charles W. Hull in 1986 and is headquartered in Rock Hill, SC.
Predefined Scans Triggered: Elder Bar Turned Green, New CCI Buy Signals, Moved Above Upper Keltner Channel, Moved Above Upper Bollinger Band and P&F Low Pole.
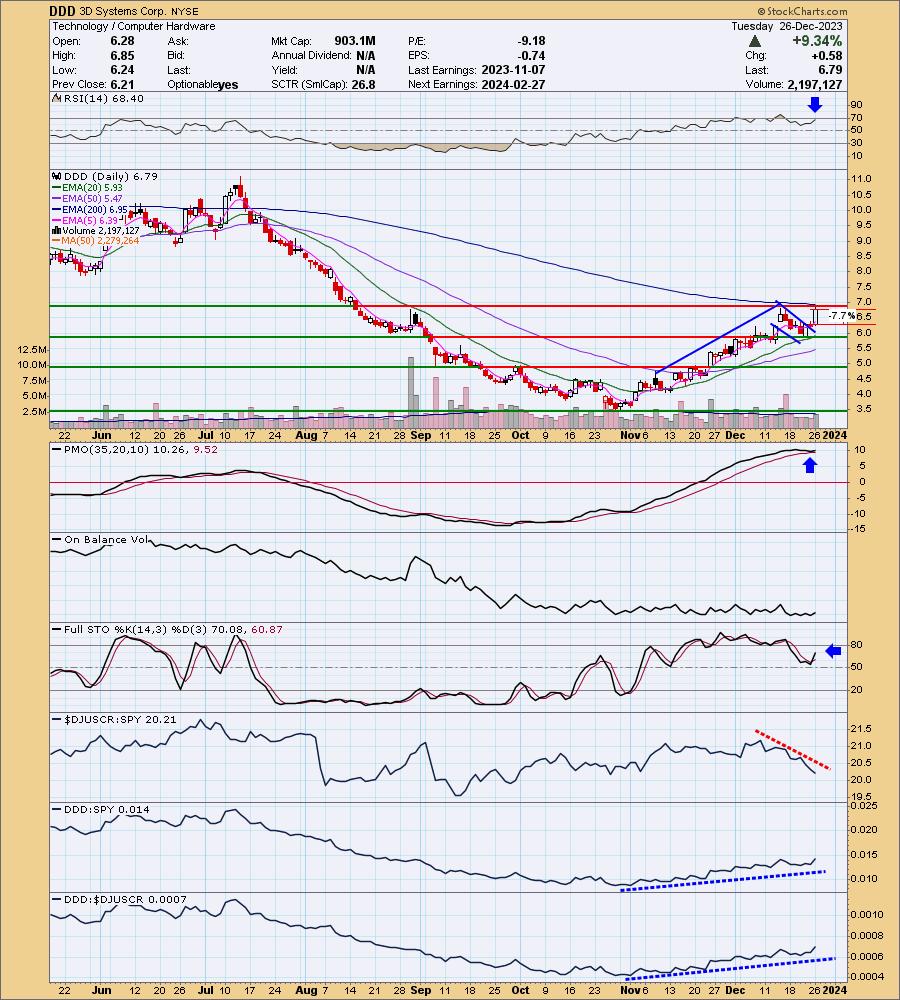
DDD is up +0.44% in after hours trading. I see this as a 'boom or bust' stock. It has some great upside potential, but it carries volatility risk. It is also low priced and that contributes to volatility. Position size wisely if you get involved in this one. There is bull flag that was confirmed with today's strong rally. The weekly RSI is positive and not quite overbought. The PMO surged above its signal line today. The industry group isn't doing great, but DDD is outperforming the SPY steadily so we will ignore that for now. Stochastics have turned up in positive territory. The stop was tough to set given today's big move. I opted for a 7.7% stop around $6.26.
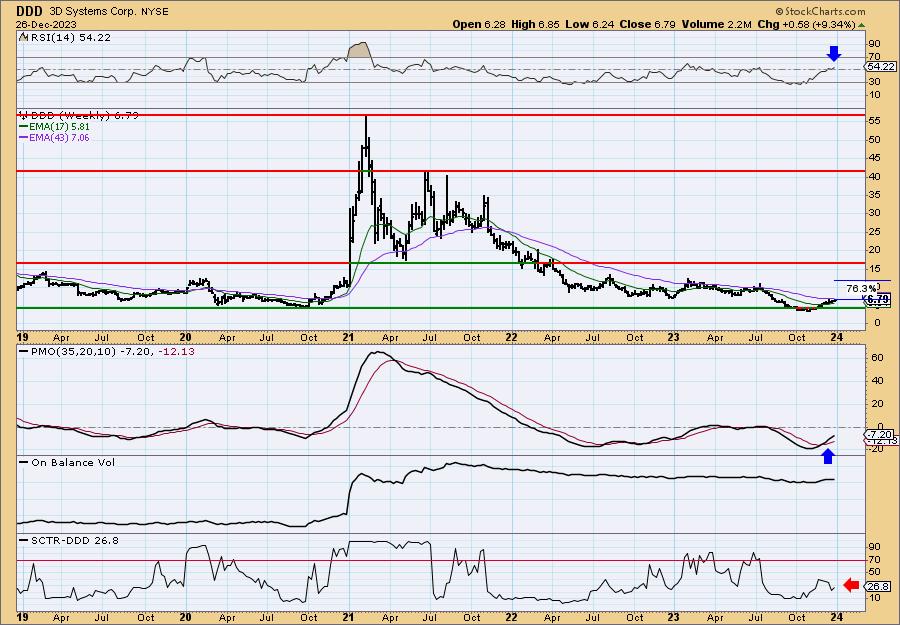
The weekly chart demonstrates the 'boom' possibilities. Upside potential is incredibly high. The weekly RSI is positive and not at all overbought. The weekly PMO is rising on a Crossover BUY Signal. The only preventing me from considering this an intermediate-term investment is the SCTR which isn't very healthy.
Shenandoah Telecommunications Co. (SHEN)
EARNINGS: 02/21/2024 (BMO)
Shenandoah Telecommunications Co. is a holding company, which engages in the provision of regulated and unregulated telecommunication services to end-user customers and other telecommunications providers. It offers voice, video and data communications services. It operates through the Broadband and Tower segments. The Broadband segment provides broadband, video, and voice services to residential and commercial customers in portions of Virginia, West Virginia, Maryland, and Kentucky, via fiber optic and hybrid fiber coaxial ("HFC") cable. The Tower segment leases space on 225 owned cell towers. The company was founded in 1902 and is headquartered in Edinburg, VA.
Predefined Scans Triggered: Elder Bar Turned Green.
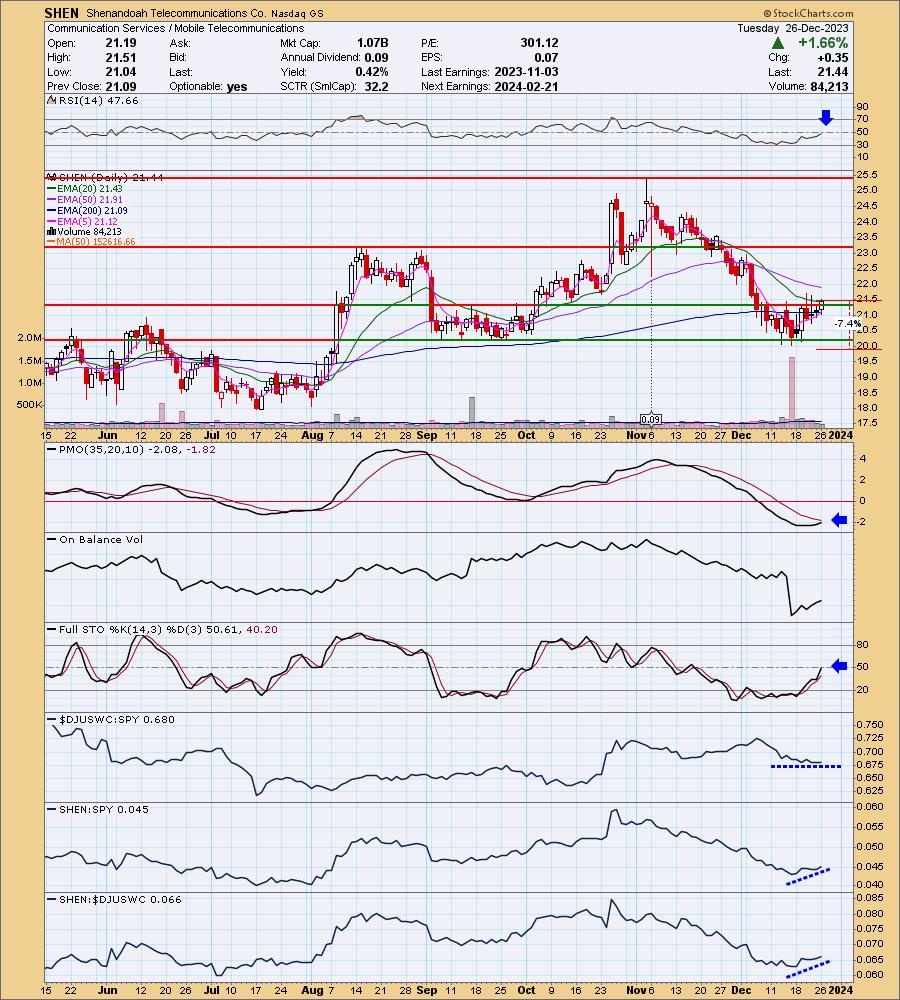
SHEN is unchanged in after hours trading. The is chart is in the early stages and offers us an opportunity to get in while this one isn't overbought. It has reversed nicely off support and has now overcome both the 20/200-day EMAs. The PMO is rising toward a Crossover BUY Signal. While this reversal is occurring beneath the zero line, this looks like developing strength not diminishing weakness. Stochastics are now above 50. Relative strength is about even with the SPY for the group, but SHEN is outperforming both the group and the SPY. I've set the stop beneath support at 7.4% or $19.85.
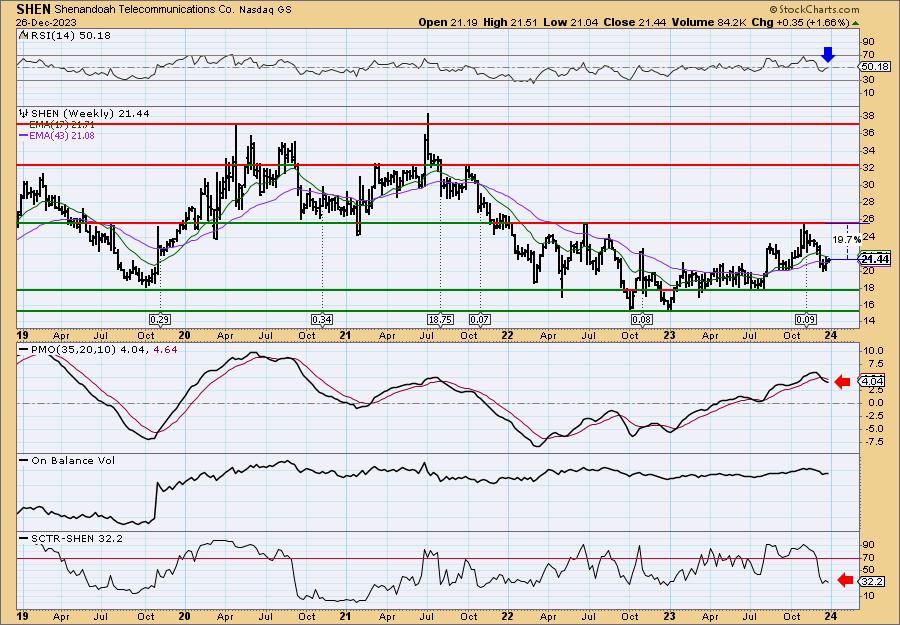
The weekly chart suggests that we keep this is the short-term timeframe. The weekly RSI is back in positive territory, but the weekly PMO is in decline on a Crossover SELL Signal. Additionally, the SCTR is declining in weak territory. If it can recapture the prior high, that would be a nice 19.7% gain.
Don't forget, on Thursdays I look at reader-requested symbols, click HERE to send me an email. I read every email I receive and try to answer them all!
Current Market Outlook:
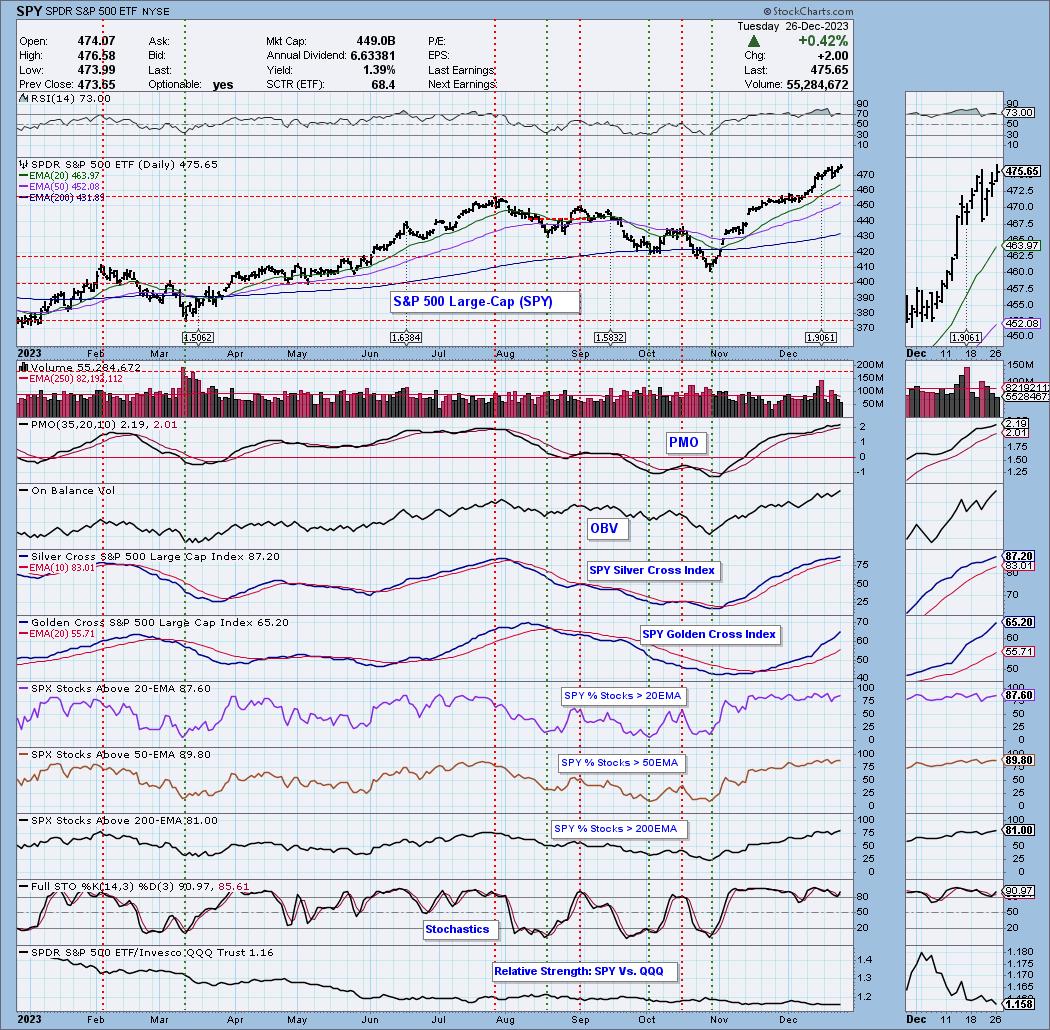
Market Environment: It is important to consider the odds for success by assessing the market tides. The following chart uses different methodologies for objectively showing the depth and trend of participation for intermediate- and long-term time frames.
- The Silver Cross Index (SCI) shows the percentage of SPX stocks on IT Trend Model BUY signals (20-EMA > 50-EMA)
- The Golden Cross Index (GCI) shows the percentage of SPX stocks on LT Trend Model BUY signals (50-EMA > 200-EMA)
Don't forget that as a "Diamonds" member, you have access to our GCI/SCI curated ChartList on DecisionPoint.com. You'll find it under "Members Only" links on the left side on the Blogs and Links Page.
Here is the current chart:
Full Disclosure: I am 85% long, 0% short.
I'm required to disclose if I currently own a stock I mention and/or may buy/short it within the next 72 hours.
"Technical Analysis is a windsock, not a crystal ball." - Carl Swenlin
(c) Copyright 2023 DecisionPoint.com
Watch the latest episode of DecisionPoint Trading Room with Carl & Erin Swenlin on Mondays 3:00p EST or on the DecisionPoint playlist on the StockCharts TV YouTube channel here!
NOTE: The stocks reported herein are from mechanical trading model scans that are based upon moving average relationships, momentum and volume. DecisionPoint analysis is then applied to get five selections from the scans. The selections given should prompt readers to do a chart review using their own analysis process. This letter is not a call for a specific action to buy, sell or short any of the stocks provided. There are NO sure things or guaranteed returns on the daily selection of "Diamonds in the Rough."
Regarding BUY/SELL Signals: The signal status reported herein is based upon mechanical trading model signals and crossovers. They define the implied bias of the price index/stock based upon moving average relationships and momentum, but they do not necessarily call for a specific action. They are information flags that should prompt chart review. Further, they do not call for continuous buying or selling during the life of the signal. For example, a BUY signal will probably (but not necessarily) return the best results if action is taken soon after the signal is generated. Additional opportunities for buying may be found as price zigzags higher, but the trader must look for optimum entry points. Conversely, exit points to preserve gains (or minimize losses) may be evident before the model mechanically closes the signal.
Helpful DecisionPoint Links:
Price Momentum Oscillator (PMO)
Swenlin Trading Oscillators (STO-B and STO-V)
For more links, go to DecisionPoint.com