
Surprise! I'm publishing DP Diamonds today instead of tomorrow. I have a procedure on my eye tomorrow and I thought I'd give it a break by only writing DP Alert. It gives us a fresh start to the week and gives these "Diamonds in the Rough" one extra day to mature.
The scans were plentiful which makes my job harder trying to cull through all of those results. Another reason to give my eye a break tomorrow. I like today's selections as I could be a bit more picky than usual.
I'm still seeing Technology dominating the scan results, but also found that Industrials were well represented. This is a sector I haven't paid much attention to, but it appears we will want to keep watch. I selected two from Technology, one from Communication Services, and one from the very successful Property-Casualty Insurance group with Financials.
Before I finish, I would invite you to go to the new DecisionPoint YouTube Channel and subscribe. I will now be posting our free trading room videos there. Here is a link.
Good Luck & Good Trading,
Erin
Today's "Diamonds in the Rough": COHR, PRA, VNT and ZD.
Runner-ups: AMGN, FFIV, WTFC, CARS, LRN, MSM, MTSI, AIT, AKAM, CW and FORM.

RECORDING & DOWNLOAD LINK (1/19/2024):
Topic: DecisionPoint Diamond Mine (1/19/2024) LIVE Trading Room
Recording & Download LINK
Passcode: January#19
REGISTRATION for 1/26/2024:
When: Jan 26, 2024 09:00 AM Pacific Time (US and Canada)
Topic: DecisionPoint Diamond Mine (1/26/2024) LIVE Trading Room
Register in advance for this webinar HERE
After registering, you will receive a confirmation email containing information about joining the webinar.

Here is the latest recording from January 22nd:
Welcome to DecisionPoint Diamonds, wherein I highlight ten "Diamonds in the Rough" per week. These are selected from the results of my DecisionPoint Scans which search for stocks that could benefit from the trend and condition of the market. Remember, these are not recommendations to buy or sell, but are the most interesting of the stocks that surfaced in my scans. My objective is to save you the work of the initial, tedious culling process, but you need to apply your own analysis to see if these stocks pique your interest as well. There are no guaranteed winners here!
"Predefined Scans Triggered" are taken from StockCharts.com using the "Symbol Summary" option instead of a "SharpChart" on the workbench.
Stop levels are all rounded down.
Coherent Corp. (COHR)
EARNINGS: 02/05/2024 (AMC)
Coherent Corp. engages in the development, refinement, manufacturing, and marketing of engineered materials and opto-electronic components and devices for precision in the field of industrial materials processing, optical communications, aerospace and defense, consumer electronics, semiconductor capital equipment, life sciences, and automotive applications and markets. It operates through the following segments: Photonic Solutions and Compound Semiconductors. The Photonic Solutions segment manufactures crystal materials, optics, microchip lasers and optoelectronic modules for use in optical communication networks and other diverse consumer and commercial applications, pump lasers, optical isolators, and optical amplifiers and micro-optics for optical amplifiers, for both terrestrial and submarine applications within the optical communications market. The Compound Semiconductors segment designs, manufactures and markets optical and electro-optical components and materials, infrared optical components and high-precision optical assemblies for aerospace and defense, medical and commercial laser imaging applications, semiconductor lasers and detectors for optical interconnects and sensing applications, unique engineered materials for thermoelectric and silicon carbide applications servicing the semiconductor, aerospace and defense and medical markets. The company was founded by Carl J. Johnson in 1971 and is headquartered in Saxonburg, PA.
Predefined Scans Triggered: Moved Above Upper Keltner Channel and P&F Double Top Breakout.
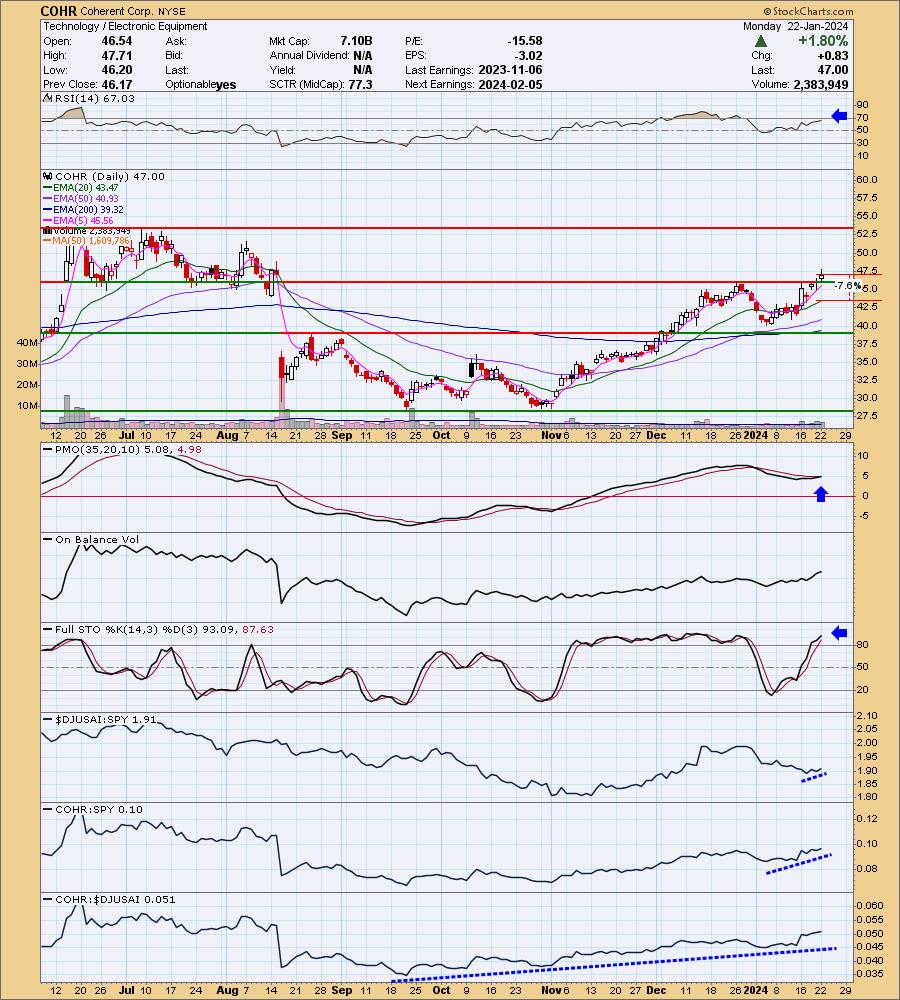
COHR is down -0.85% in after hours trading. I really liked the breakout today. Add to that the positive indicators as well as a favorable configuration of the key moving averages with price above them. The RSI is positive and not yet overbought despite this lengthy rally. The PMO is signaling pure strength as it gives us a Crossover BUY Signal. Remember PMO Crossovers above the signal line are especially bullish. Stochastics are now above 80. The group is finally starting to see a tiny bit of outperformance, but COHR is showing very good rising relative strength against the group and the SPY. The stop is set around the 20-day EMA at 7.6% or $43.42.
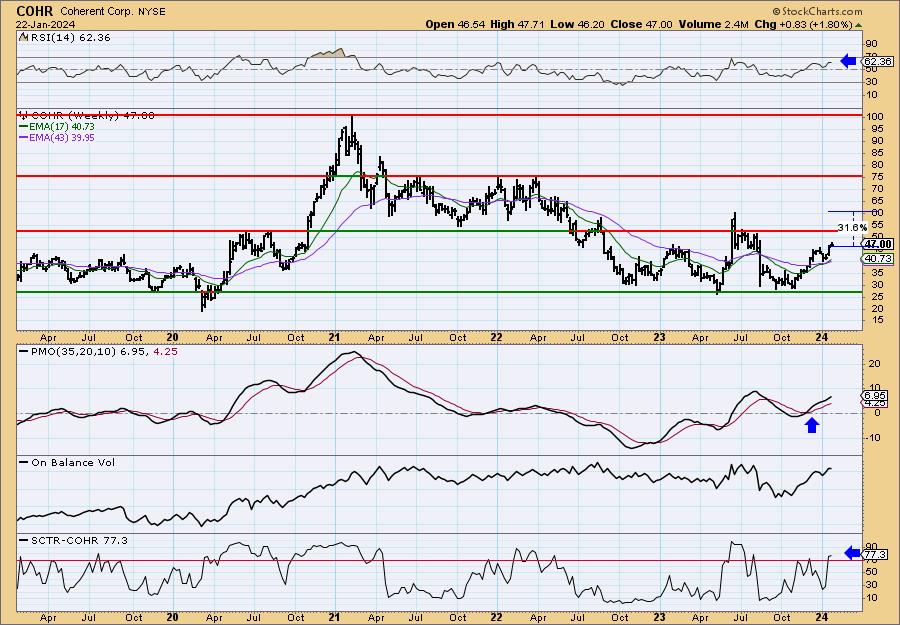
The weekly chart is favorable and suggests this could be held onto longer than just the short term. The weekly RSI is positive and not overbought. The weekly PMO is on a Crossover BUY Signal that occurred just above the zero line. The StockCharts Technical Rank (SCTR) is sitting inside the hot zone*. I've listed the upside target at the 2023 high.
*If a stock is in the "hot zone" above 70, it implies that it is stronger than 70% of its universe (large-, mid-, small-caps and ETFs) primarily in the intermediate to long terms.
ProAssurance Corp. (PRA)
EARNINGS: 02/26/2024 (AMC)
ProAssurance Corp. is a holding company. It operates through the following segments: Specialty Property and Casualty, Workers' Compensation Insurance, Lloyd's Syndicate, Segregated Portfolio Cell Reinsurance and Corporate. The Specialty Property and Casualty segment includes professional liability business and medical technology and life sciences business. The Workers' Compensation Insurance segment includes the workers' compensation business which the company provides for employers, groups and associations. The Lloyd's Syndicate segment includes operating results from participation in Lloyd's Syndicate 1729. The Segregated Portfolio Cell Reinsurance segment assumes workers' compensation insurance, healthcare professional liability insurance or a combination of the two from Workers' Compensation Insurance and Specialty Property & Casualty segments. The Corporate segment includes investing operations managed at the corporate level, non-premium revenues generated outside of insurance entities, and corporate expenses, including interest and U.S. income taxes. The company was founded in 1976 and is headquartered in Birmingham, AL.
Predefined Scans Triggered: Bullish MACD Crossovers and Entered Ichimoku Cloud.
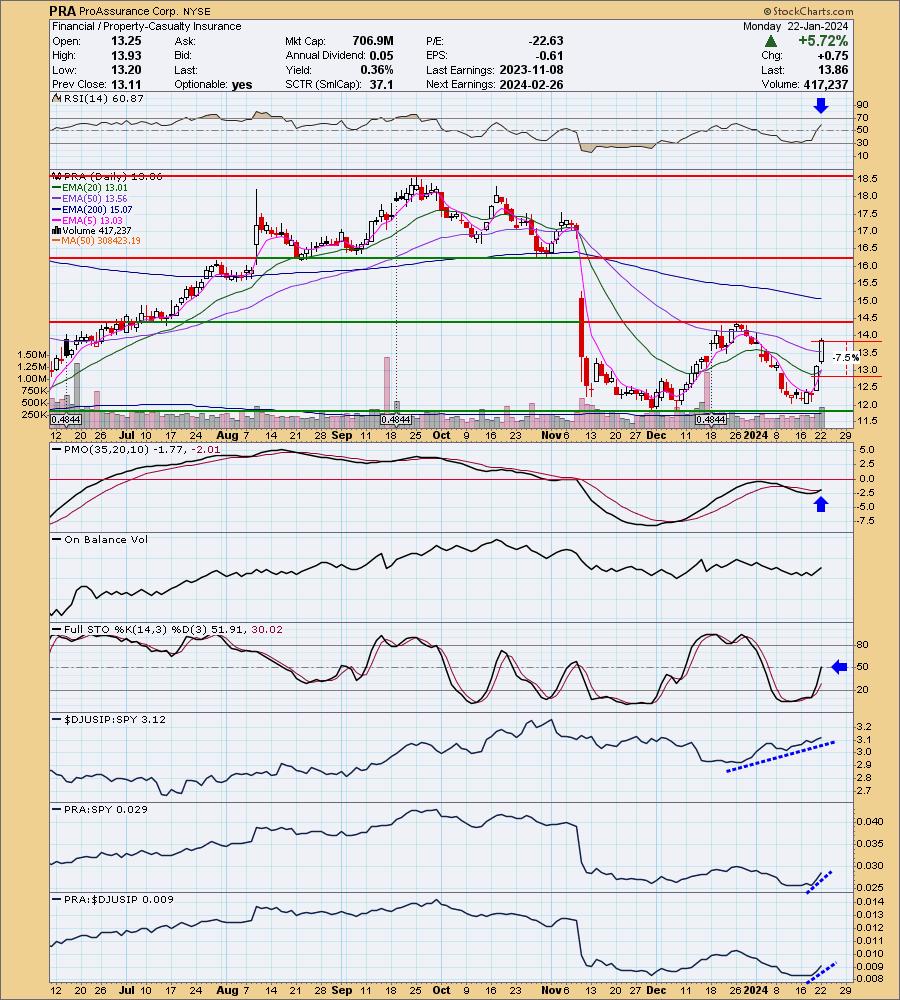
PRA is unchanged in after hours trading. This rally has been running a bit hot, but the RSI is not yet overbought suggesting it could continue to move higher. We have a new ST Trend Model BUY Signal as the 5-day EMA just crossed above the 20-day EMA. There is a PMO Crossover BUY Signal that is likely signaling new strength not just diminishing weakness. Stochastics are rising and are now in positive territory. This group has been outperforming in a big way. PRA hasn't enjoyed the same relative strength, but it is now starting to wake up based on those newly rising relative strength lines. The stop is set beneath the 20-day EMA at 7.5% or $12.82.
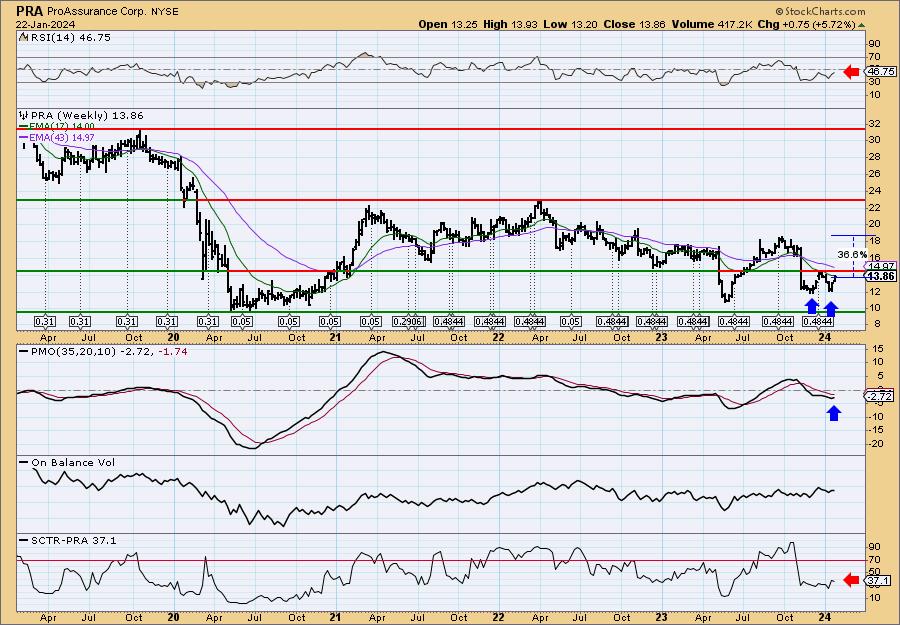
There is a bullish double bottom that is forming. I'm looking for the pattern to be confirmed with a breakout. The weekly chart isn't great, but it is improving. The weekly RSI is negative but is on the rise. The weekly PMO has just turned back up. The SCTR definitely could be better. Keep this one short-term at least until the RSI gets positive.
Vontier Corporation (VNT)
EARNINGS: 02/15/2024 (BMO)
Vontier Corp. engages in the provision of critical technical equipment, components, software and services for manufacturing, and repair and servicing in the mobility infrastructure industry worldwide. It supplies solutions, spanning advanced environmental sensors, fueling equipment, field payment hardware, remote management and workflow software, vehicle tracking and fleet management software solutions for traffic light control and vehicle mechanics and technicians equipment. The company was founded in 2019 and is headquartered in Raleigh, NC.
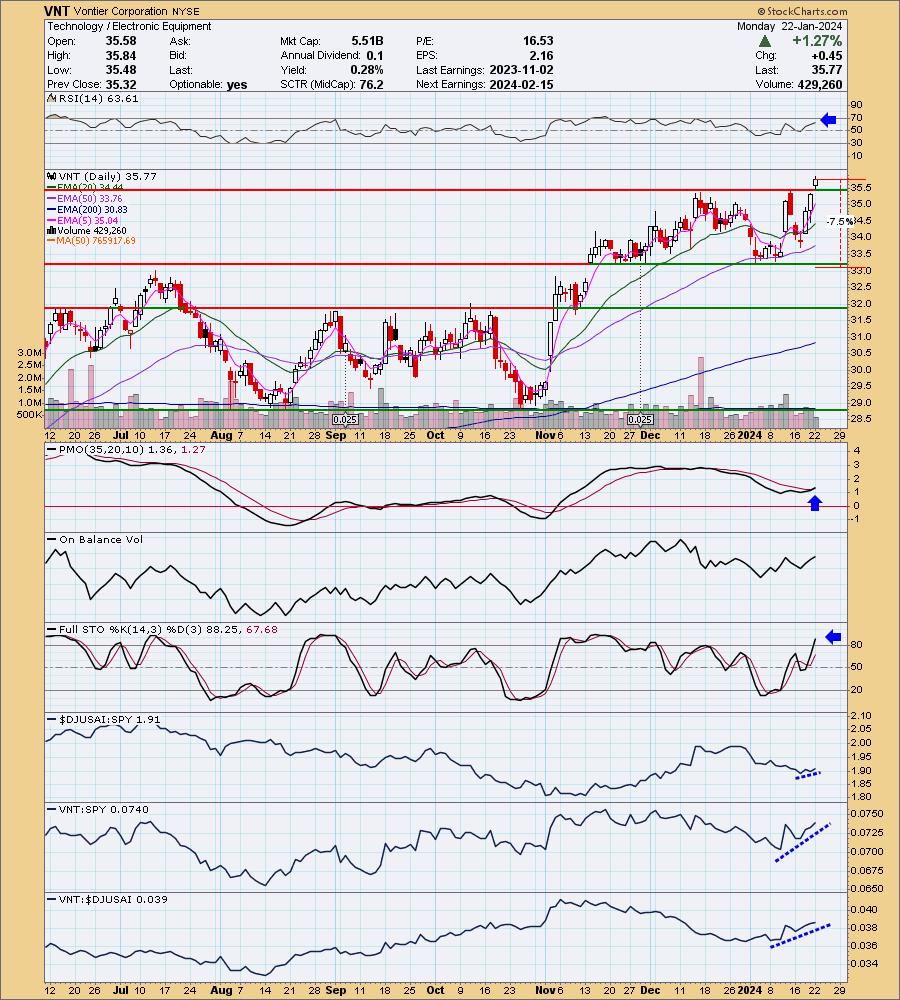
Predefined Scans Triggered: Moved Above Upper Keltner Channel, New 52-week Highs, Moved Above Upper Bollinger Band, Moved Above Upper Price Channel and P&F Double Top Breakout.
VNT is up +0.08% in after hours trading. Here is another great looking breakout on a follow-through day (3rd rally day). The EMAs are configured very positively with plenty of margin between them. The RSI is positive and rising. The PMO just triggered a Crossover BUY Signal above the signal line which generally means 'pure strength' to the move. Stochastics are back above 80. Relative strength is just now picking up a bit for the industry group. VNT is an outperformer against both the group and the SPY. The stop is set beneath support at 7.5% or $33.08.
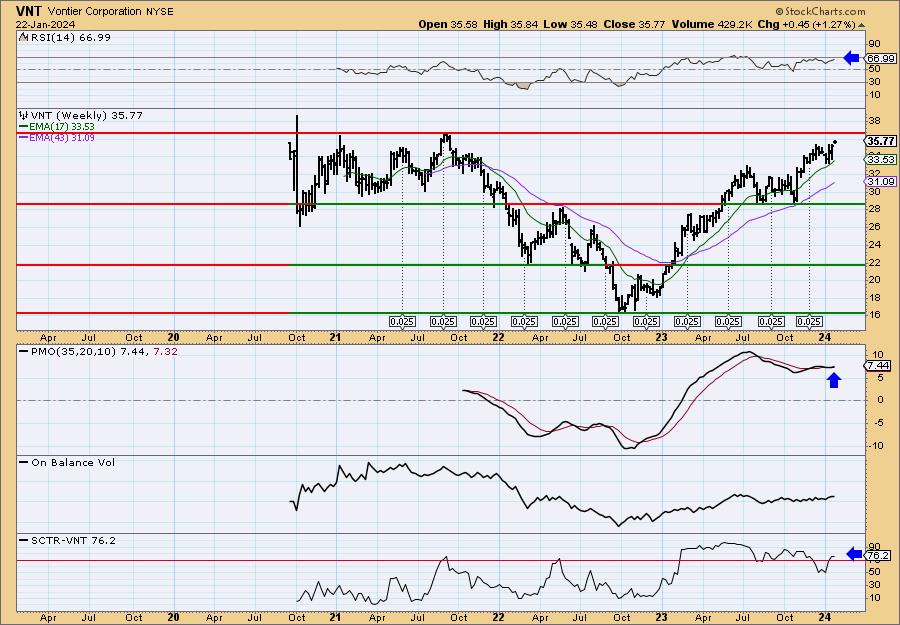
The weekly chart is favorable and suggests this could be a longer-term hold. The weekly RSI is positive and the weekly PMO is surging above the signal line (bottom above the signal line). The SCTR has just entered the hot zone. Consider an upside target around 17% or $41.85.
Ziff Davis, Inc. (ZD)
EARNINGS: 02/14/2024 (AMC)
Ziff Davis, Inc. is a digital media and internet company. Its portfolio includes brands in technology, shopping, gaming and entertainment, connectivity, health, cybersecurity, and martech. It operates through the following segments: Digital Media, and Cybersecurity and Martech. The Digital Media segment specializes in the technology, shopping, gaming and entertainment, and healthcare markets, offering content, tools, and services to consumers and businesses. The Cybersecurity and Martech segment provides cloud-based subscription services to consumers and businesses including cybersecurity, privacy, and marketing technology. The company was founded by Jaye Muller and John F. Rieley in 2014 and is headquartered in New York, NY.
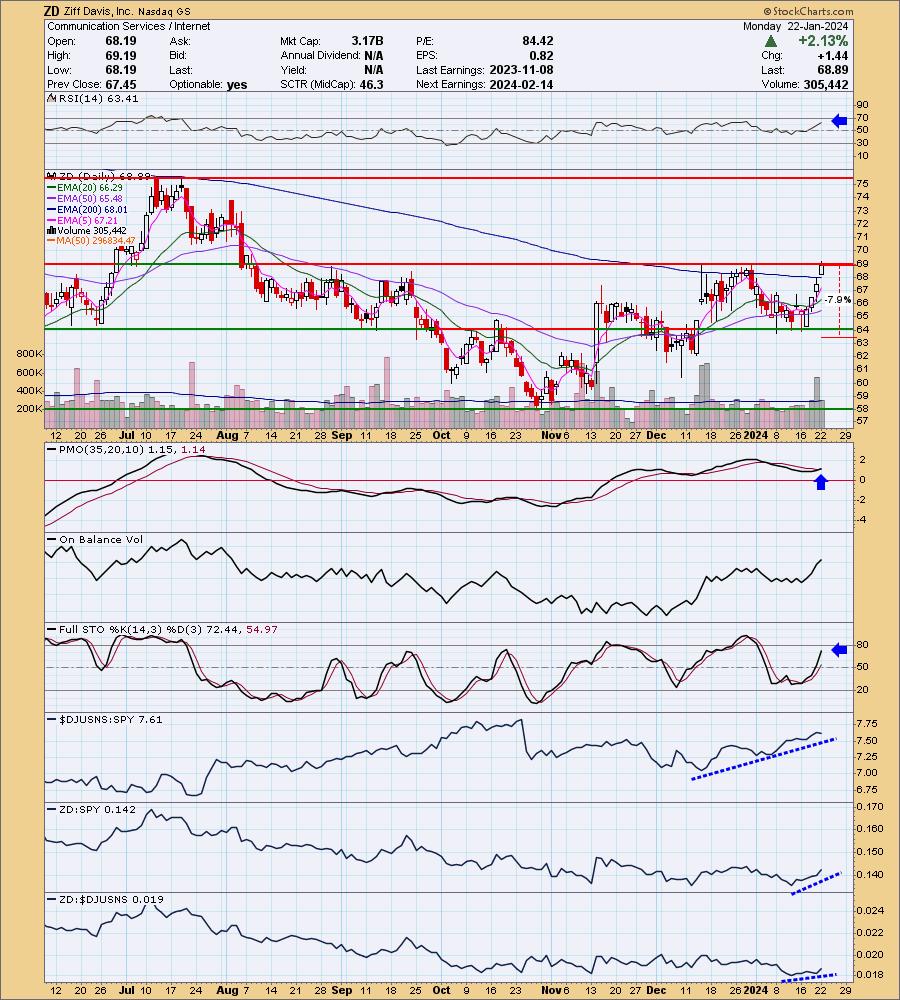
Predefined Scans Triggered: New CCI Buy Signals, Stocks in a New Uptrend (Aroon), Parabolic SAR Buy Signals, P&F Double Top Breakout and P&F Triple Top Breakout.
ZD is unchanged in after hours trading. Part of the reason I selected ZD was its exposure to the Communications Services sector which is outperforming alongside Technology. Today ZD broke out above the 200-day EMA. It has reached overhead resistance and a pullback may be in order, but this rally is very strong and the PMO Crossover BUY Signal is coming above the zero line. The RSI is not overbought and is rising. Stochastics are rising strongly suggesting we should see follow through. The group is really outperforming and ZD is starting to see outperformance against the group. It's already seeing rising relative strength against the SPY. I've set the stop beneath support at 7.9% or $63.44.
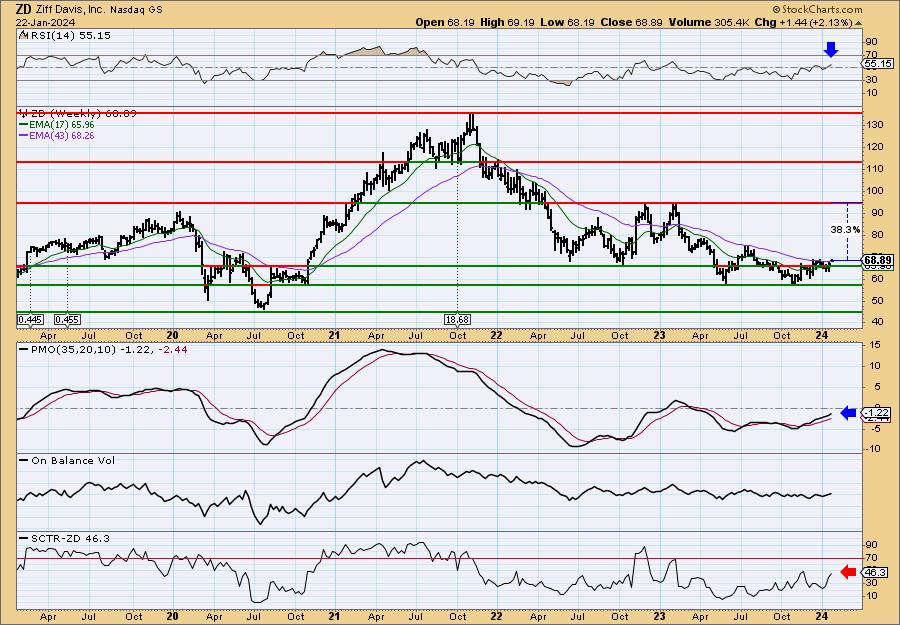
I noticed that price is also breaking above the 43-week EMA on the weekly chart. The only detractor to the chart is the low SCTR value, but that is improving. The weekly RSI is positive, rising and not at all overbought. The weekly PMO is making its way higher on a Crossover BUY Signal. I've listed upside potential up to the 2023 high.
Don't forget, on Thursdays I look at reader-requested symbols, click HERE to send me an email. I read every email I receive and try to answer them all!
Current Market Outlook:
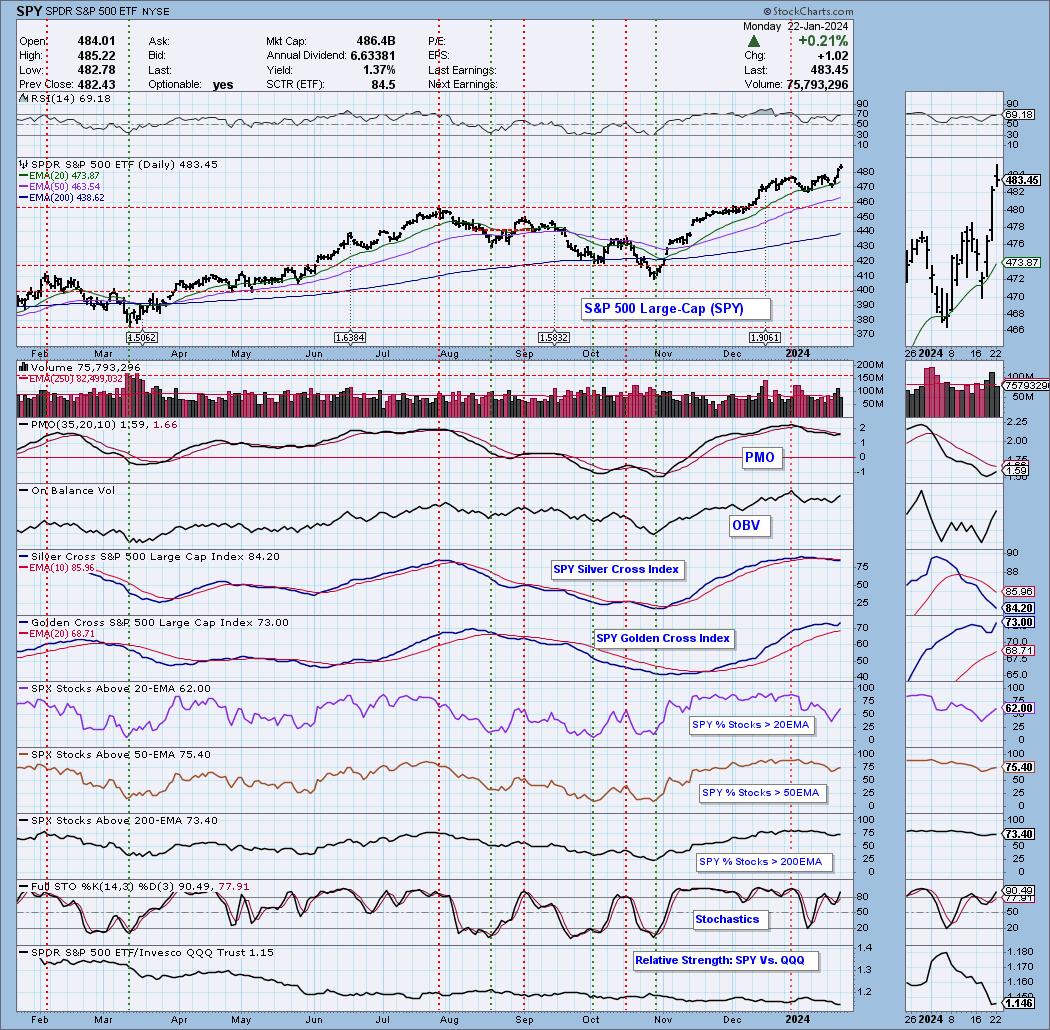
Market Environment: It is important to consider the odds for success by assessing the market tides. The following chart uses different methodologies for objectively showing the depth and trend of participation for intermediate- and long-term time frames.
- The Silver Cross Index (SCI) shows the percentage of SPX stocks on IT Trend Model BUY signals (20-EMA > 50-EMA)
- The Golden Cross Index (GCI) shows the percentage of SPX stocks on LT Trend Model BUY signals (50-EMA > 200-EMA)
Don't forget that as a "Diamonds" member, you have access to our GCI/SCI curated ChartList on DecisionPoint.com. You'll find it under "Members Only" links on the left side on the Blogs and Links Page.
Here is the current chart:
Full Disclosure: I am 65% long, 0% short. COHR has my attention as a possible add.
I'm required to disclose if I currently own a stock I mention and/or may buy/short it within the next 72 hours.
"Technical Analysis is a windsock, not a crystal ball." - Carl Swenlin
(c) Copyright 2024 DecisionPoint.com
Watch the latest episode of DecisionPoint Trading Room with Carl & Erin Swenlin on Mondays 3:00p EST or on the DecisionPoint playlist on the StockCharts TV YouTube channel here!
NOTE: The stocks reported herein are from mechanical trading model scans that are based upon moving average relationships, momentum and volume. DecisionPoint analysis is then applied to get five selections from the scans. The selections given should prompt readers to do a chart review using their own analysis process. This letter is not a call for a specific action to buy, sell or short any of the stocks provided. There are NO sure things or guaranteed returns on the daily selection of "Diamonds in the Rough."
Regarding BUY/SELL Signals: The signal status reported herein is based upon mechanical trading model signals and crossovers. They define the implied bias of the price index/stock based upon moving average relationships and momentum, but they do not necessarily call for a specific action. They are information flags that should prompt chart review. Further, they do not call for continuous buying or selling during the life of the signal. For example, a BUY signal will probably (but not necessarily) return the best results if action is taken soon after the signal is generated. Additional opportunities for buying may be found as price zigzags higher, but the trader must look for optimum entry points. Conversely, exit points to preserve gains (or minimize losses) may be evident before the model mechanically closes the signal.
Helpful DecisionPoint Links:
Price Momentum Oscillator (PMO)
Swenlin Trading Oscillators (STO-B and STO-V)
For more links, go to DecisionPoint.com