
I don't have much to talk about in today's opening. Scan produced a fair amount of stocks. What I found interesting were the wide variety of stocks that came from every sector and varied industry groups. I couldn't discern a "theme" for today.
I did notice that I had a few Pipeline stocks come through on Crude Oil's rally today. I still don't trust Crude, but the runner-up chart, GEL, has merits.
We should remain cautious. Adding positions right now carries more risk than usual as the market is displaying some weakness, particularly in the intermediate term. Be sure and set stops upon entering any position right now to play it safe.
Don't forget that I look at Reader Requested symbols on Thursday. Send in your potential candidates or a portfolio position you want more information on.
Good Luck & Good Trading,
Erin
Today's "Diamonds in the Rough": HELE, IP, UAL and XPER.
Runner-ups: STAA, CCRN, DG, VIAV, MMC and GEL.

RECORDING & DOWNLOAD LINK (1/5/2024):
Topic: DecisionPoint Diamond Mine (1/5/2024) LIVE Trading Room
Recording and download link HERE.
Passcode: January#5
REGISTRATION for 1/12/2024:
When: Jan 12, 2024 09:00 AM Pacific Time (US and Canada)
Topic: DecisionPoint Diamond Mine (1/12/2024) LIVE Trading Room
Register in advance for this webinar HERE.
After registering, you will receive a confirmation email containing information about joining the webinar.

Here is the recording link for 1/5 (not posted to YouTube this week, link expires in two weeks):
Passcode: January#8
Welcome to DecisionPoint Diamonds, wherein I highlight ten "Diamonds in the Rough" per week. These are selected from the results of my DecisionPoint Scans which search for stocks that could benefit from the trend and condition of the market. Remember, these are not recommendations to buy or sell, but are the most interesting of the stocks that surfaced in my scans. My objective is to save you the work of the initial, tedious culling process, but you need to apply your own analysis to see if these stocks pique your interest as well. There are no guaranteed winners here!
"Predefined Scans Triggered" are taken from StockCharts.com using the "Symbol Summary" option instead of a "SharpChart" on the workbench.
Stop levels are all rounded down.
Helen of Troy Ltd. (HELE)
EARNINGS: 01/08/2024 (BMO) ** Reported Yesterday **
Helen of Troy Ltd. engages in the manufacture and distribution of personal care and household products. It operates through the Home and Outdoor, and Beauty and Wellness segments. The Home and Outdoor segment offers food preparation tools, containers, electronics, baby care, and cleaning products. The Beauty and Wellness segment develops and provides products including mass and prestige market beauty appliances, prestige market liquid-based hair and personal care products, and wellness devices including thermometers, water and air filtration systems, humidifiers, and fans. The company was founded by Gerald J. Rubin and Stanlee N. Rubin in 1968 and is headquartered in Hamilton, Bermuda.
Predefined Scans Triggered: New CCI Buy Signals, Parabolic SAR Buy Signals, P&F Double Top Breakout and Bullish 50/200-day MA Crossovers.
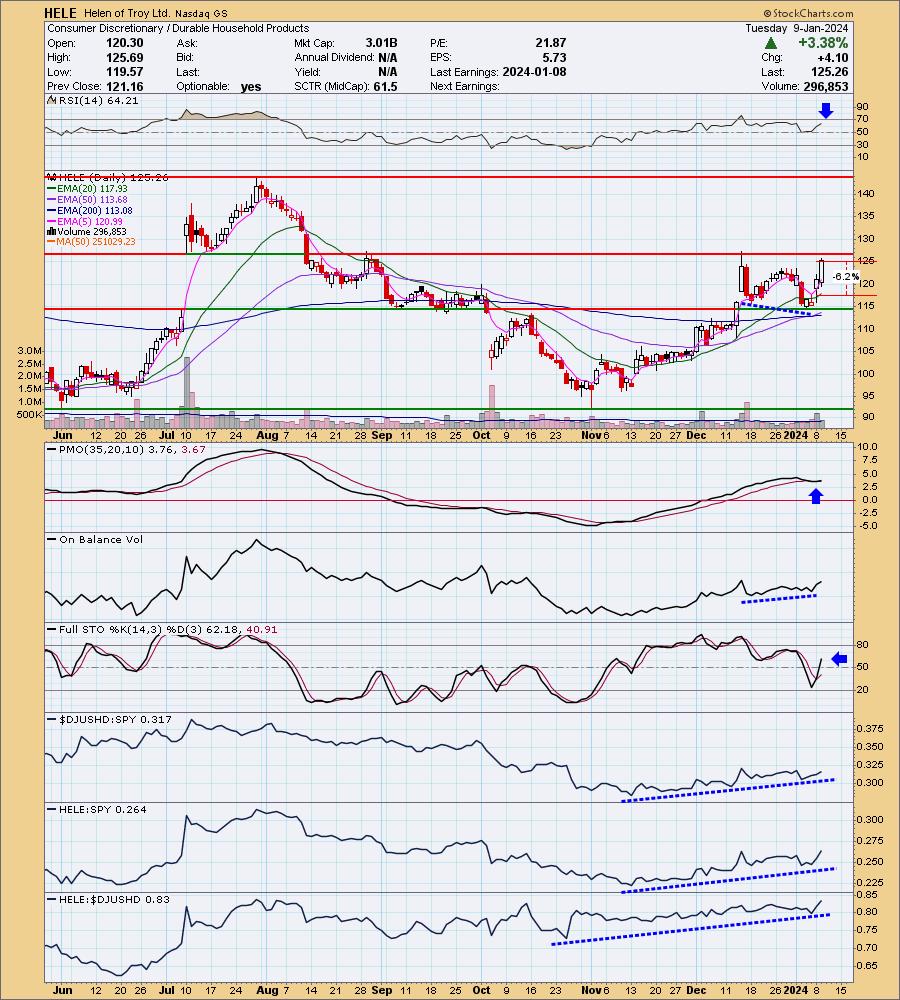
HELE is up +1.60% in after hours trading. This is probably my favorite chart today and as such, I am considering it for an add, my only hesitation is expanding my portfolio now carries more risk than I'd like. Earnings were clearly well-received as we've seen quite a rally the past two days. The technicals are looking good too. The RSI is positive and the PMO is triggering a brand new Crossover BUY Signal well above the zero line which implies internal strength. Stochastics also imply internal strength as they are rising vertically toward 80. We even have a positive OBV divergence with price lows. Relative strength studies are bullish. I'm looking for a breakout. The stop is set at about the 20-day EMA at 6.2% or $117.49.
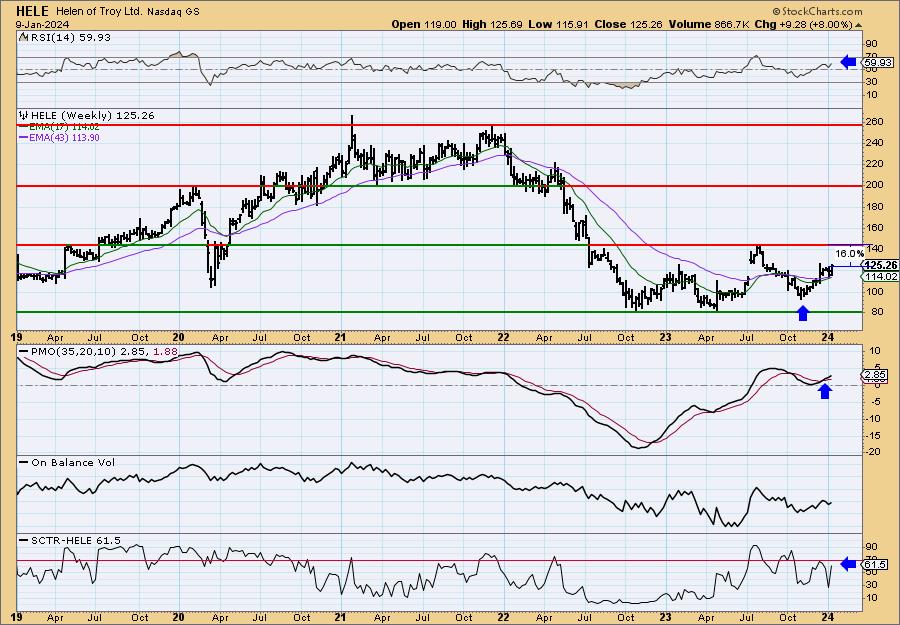
The weekly chart is strong. First notice that price did not have to go all the way down to support before it reversed. That is bullish. There is a weekly PMO Crossover BUY Signal and the weekly RSI is positive. The StockCharts Technical Rank (SCTR) is not yet in the hot zone, but it is likely to hit it soon based on the vertical rise. If it can make it to the next level of resistance it would be a 16% gain. Certainly a breakout is possible from there.
*If a stock is in the "hot zone" above 70, it implies that it is stronger than 70% of its universe (large-, mid-, small-caps and ETFs) primarily in the intermediate to long terms.
International Paper Co. (IP)
EARNINGS: 02/01/2024 (BMO)
International Paper Co. engages in the manufacture of paper and packaging products. It operates through the following segments: Industrial Packaging, Global Cellulose Fibers, and Printing Papers. The Industrial Packaging segment is involved in manufacturing containerboards, which include linerboard, medium, whitetop, recycled linerboard, recycled medium, and saturating kraft. The Global Cellulose Fibers segment offers cellulose fibers products such as fluff, market, and specialty pulps. The Printing Papers segment includes the manufacture of printing and writing papers. The company was founded by Hugh J. Chisholm in 1898 and is headquartered in Memphis, TN.
Predefined Scans Triggered: P&F Double Top Breakout.
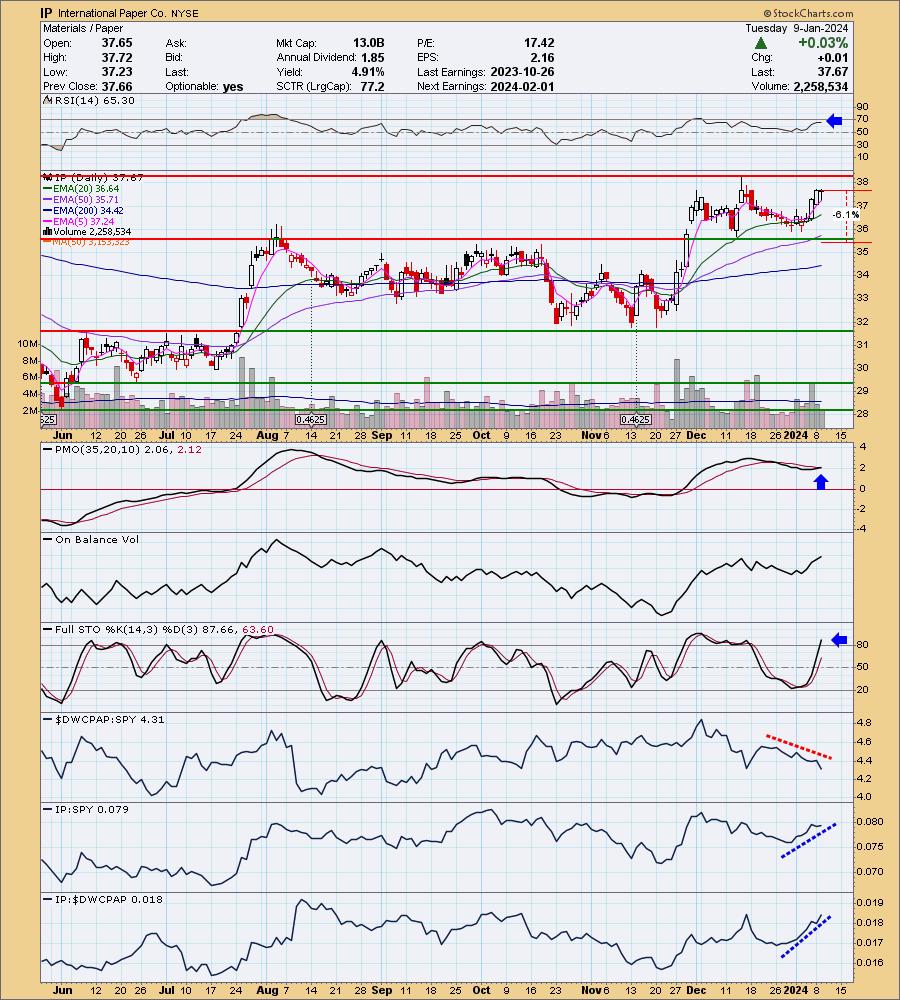
IP is down -0.08% in after hours trading. The market may've struggled to open the year, but IP has not. This recent rally has pushed the PMO up toward a Crossover BUY Signal. This is occurring well above the zero line which signals strength not diminishing weakness. The RSI is positive and the PMO is nearing a Crossover BUY Signal. Stochastics are above 80. I do not like that the group is suffering relative to the SPY, but I'll take it since IP is easily outperforming the group and SPY. The stop is set below support at 6.1% or $35.37.
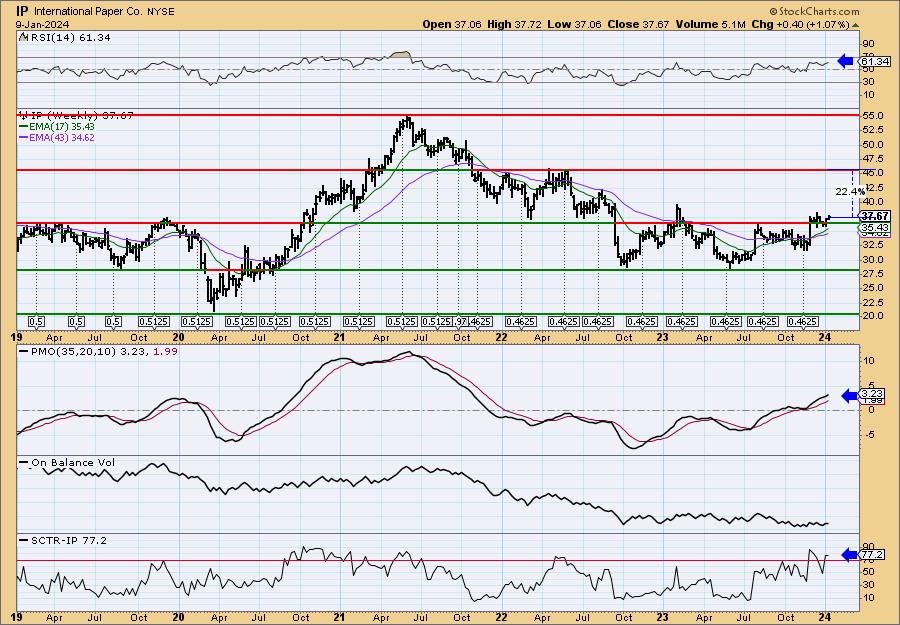
The weekly chart suggests this could be an intermediate-term investment. Price is working on breaking out above strong resistance at the 2019 high. It should break out given the positive weekly RSI and rising weekly PMO which is now above the zero line. The SCTR tells us that IP has promise in the intermediate and long terms. I'm looking for a move to test overhead resistance at the 2022 high.
United Airlines Holdings Inc. (UAL)
EARNINGS: 01/22/2024 (AMC)
United Airlines Holdings, Inc. is a holding company, which engages in the provision of transportation services. It operates through the following geographical segments: Domestic, Atlantic, Pacific, and Latin America. The company was founded on December 30, 1968 and is headquartered in Chicago, IL.
Predefined Scans Triggered: New CCI Buy Signals, Stocks in a New Uptrend (Aroon) and P&F Double Top Breakout.
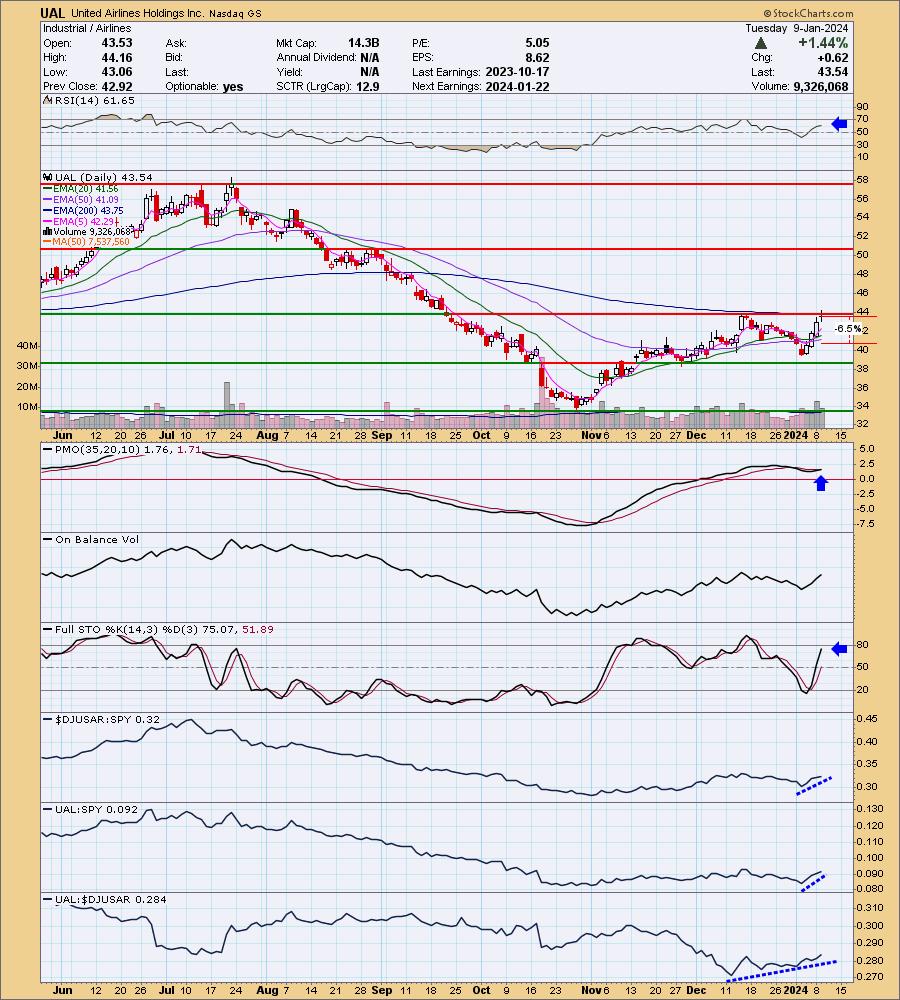
UAL is up +0.34% in after hours trading. Price broke out briefly today, but closed beneath resistance. I see a breakout in its future. The RSI is positive and not overbought yet. The PMO is nearing a Crossover BUY Signal above the zero line. Stochastics are rising strongly and should get above 80 soon. Relative strength is beginning to pick up for the Airlines and UAL is typically a leader amongst the group based on relative strength. The stop is set beneath the 50-day EMA around 6.5% or $40.70.
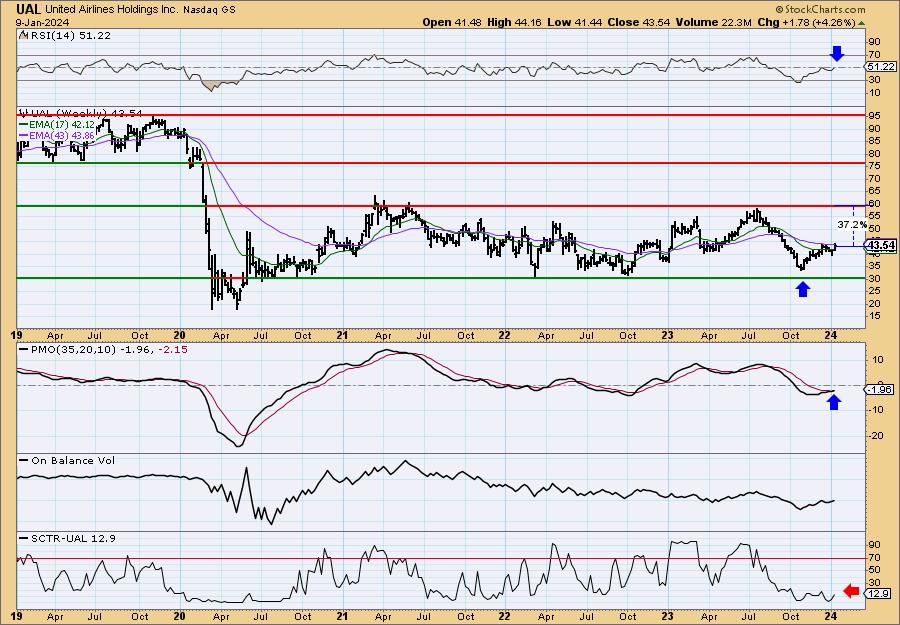
The weekly chart is very interesting. Price didn't have to go down and test support before reversing. The weekly RSI has just pushed into positive territory. More exciting is the new PMO Crossover BUY Signal. The decline was hard on UAL last year which is why the SCTR is still struggling to recuperate. If it can get back to the top of the trading range it would be a 37% plus gain.
Xperi Holding Corp. (XPER)
EARNINGS: 02/20/2024 (AMC)
Xperi, Inc. is an entertainment technology company, which engages in the provision of services to streaming media platforms across smart television and video over broadband for operators and connected cars. It operates under the brands DTS, HD Radio, Imax Enhanced, and TiVo. The company was founded in December 2019 and is headquartered in San Jose, CA.
Predefined Scans Triggered: New CCI Buy Signals and Parabolic SAR Buy Signals.
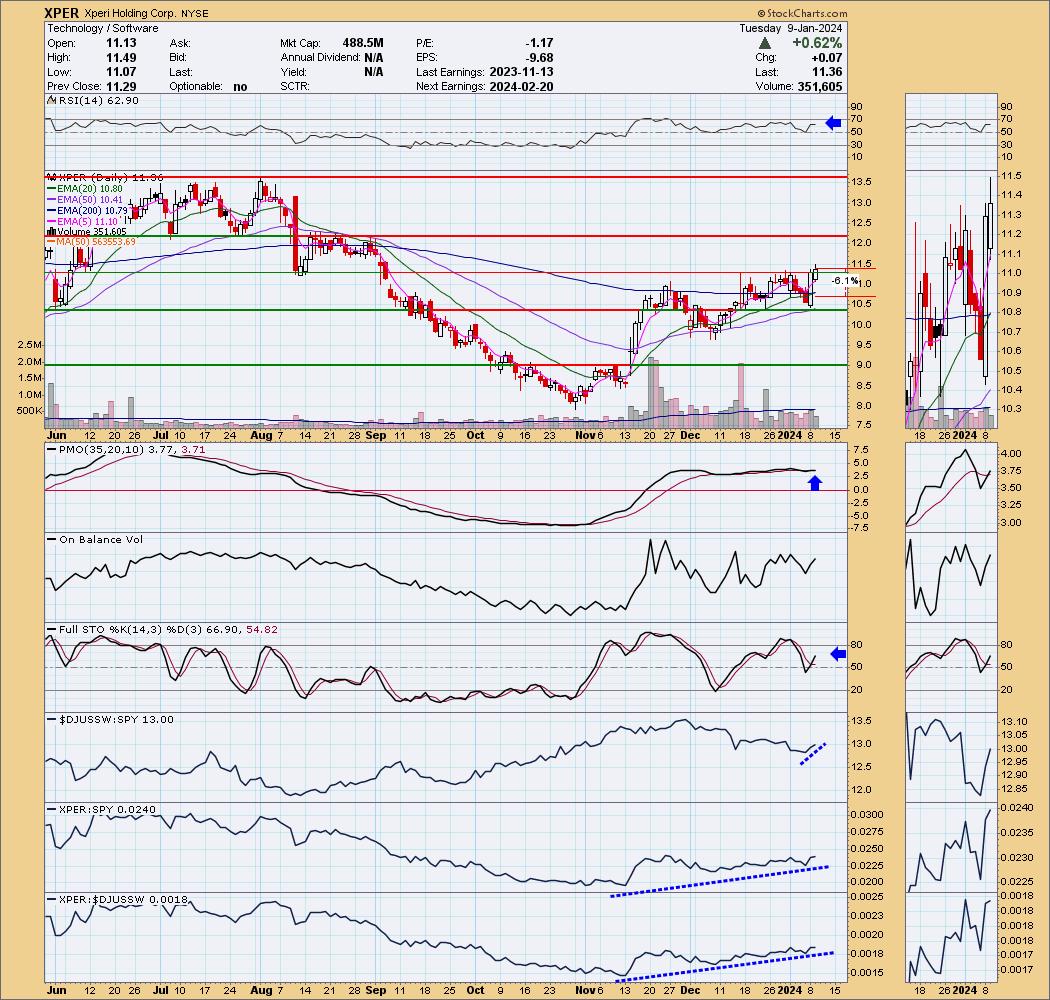
XPER is up +1.50% in after hours trading. I like today's tiny breakout from a recent congestion area. The RSI is in positive territory and isn't overbought at all. The PMO has given us a whipsaw BUY Signal above the zero line. Stochastics are rising strongly again. The group is seeing a bit of relative strength returning. XPER has shown leadership against the group since the rally began and it is still continuing to outperform the S&P. I've set the stop beneath the 200-day EMA at about 6.1% or $10.66.
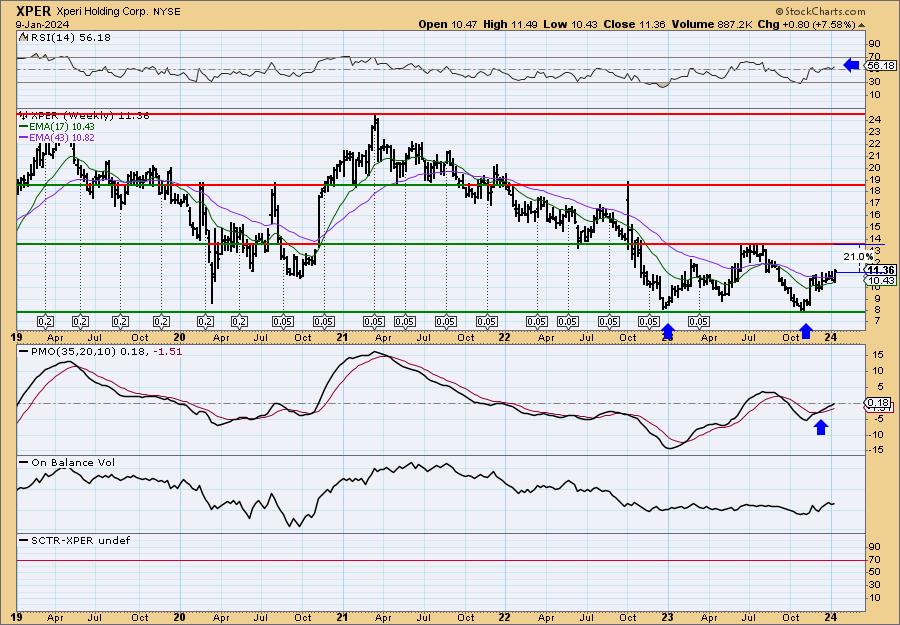
There is a giant double bottom or even triple bottom developing on the weekly chart. The weekly RSI is positive and the weekly PMO is now above the zero line on a Crossover BUY Signal. Upside potential is 21%, but if the double bottom plays out as it could, it would put price above $19 for a sizable gain.
Don't forget, on Thursdays I look at reader-requested symbols, click HERE to send me an email. I read every email I receive and try to answer them all!
Current Market Outlook:
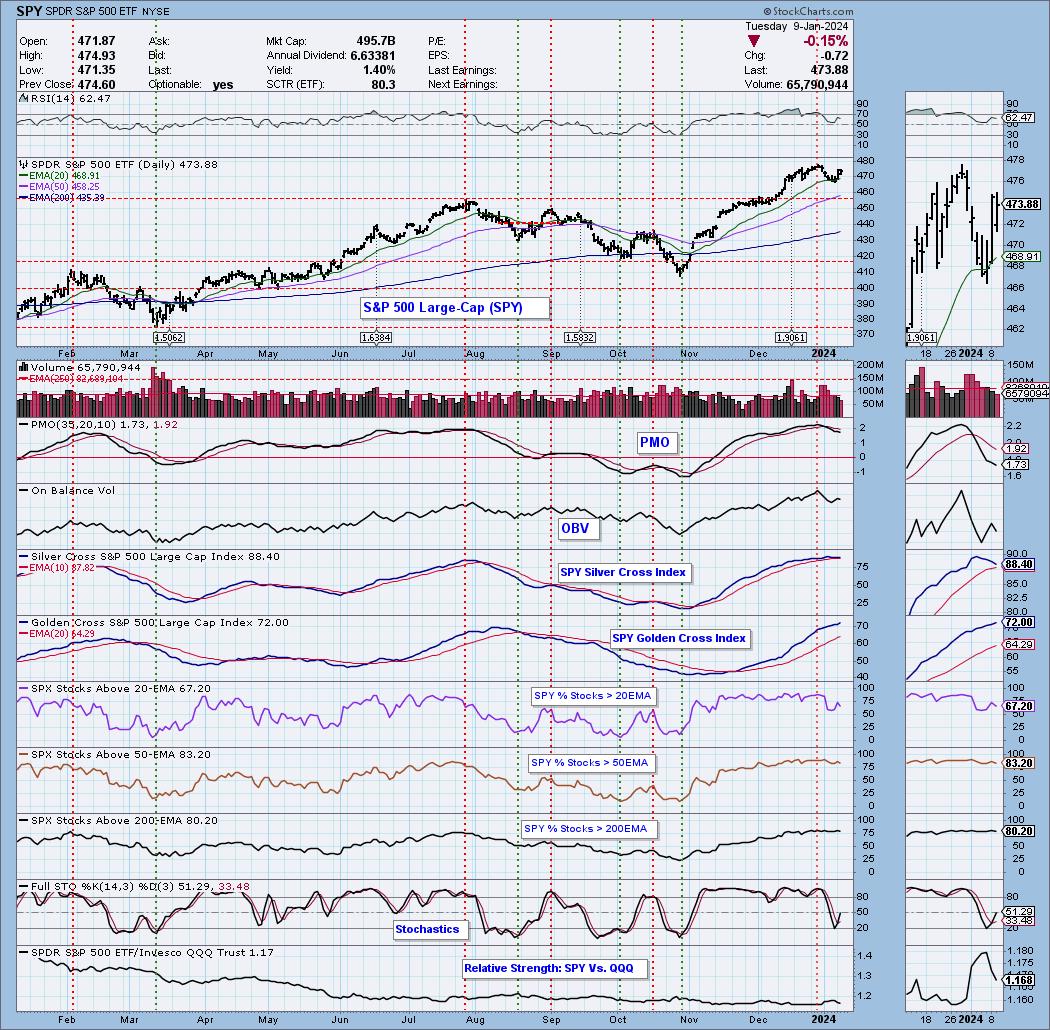
Market Environment: It is important to consider the odds for success by assessing the market tides. The following chart uses different methodologies for objectively showing the depth and trend of participation for intermediate- and long-term time frames.
- The Silver Cross Index (SCI) shows the percentage of SPX stocks on IT Trend Model BUY signals (20-EMA > 50-EMA)
- The Golden Cross Index (GCI) shows the percentage of SPX stocks on LT Trend Model BUY signals (50-EMA > 200-EMA)
Don't forget that as a "Diamonds" member, you have access to our GCI/SCI curated ChartList on DecisionPoint.com. You'll find it under "Members Only" links on the left side on the Blogs and Links Page.
Here is the current chart:
Full Disclosure: I am 75% long, 0% short. HELE is a possible add.
I'm required to disclose if I currently own a stock I mention and/or may buy/short it within the next 72 hours.
"Technical Analysis is a windsock, not a crystal ball." - Carl Swenlin
(c) Copyright 2024 DecisionPoint.com
Watch the latest episode of DecisionPoint Trading Room with Carl & Erin Swenlin on Mondays 3:00p EST or on the DecisionPoint playlist on the StockCharts TV YouTube channel here!
NOTE: The stocks reported herein are from mechanical trading model scans that are based upon moving average relationships, momentum and volume. DecisionPoint analysis is then applied to get five selections from the scans. The selections given should prompt readers to do a chart review using their own analysis process. This letter is not a call for a specific action to buy, sell or short any of the stocks provided. There are NO sure things or guaranteed returns on the daily selection of "Diamonds in the Rough."
Regarding BUY/SELL Signals: The signal status reported herein is based upon mechanical trading model signals and crossovers. They define the implied bias of the price index/stock based upon moving average relationships and momentum, but they do not necessarily call for a specific action. They are information flags that should prompt chart review. Further, they do not call for continuous buying or selling during the life of the signal. For example, a BUY signal will probably (but not necessarily) return the best results if action is taken soon after the signal is generated. Additional opportunities for buying may be found as price zigzags higher, but the trader must look for optimum entry points. Conversely, exit points to preserve gains (or minimize losses) may be evident before the model mechanically closes the signal.
Helpful DecisionPoint Links:
Price Momentum Oscillator (PMO)
Swenlin Trading Oscillators (STO-B and STO-V)
For more links, go to DecisionPoint.com