
There was a clear theme within the scan results. Consumer Staples and Utilities shined today so it was important that I include one "Diamond in the Rough" from each sector. The market is looking weak and as I suspected, defensive groups are beginning to see action.
I already mentioned Healthcare last Friday as the Sector to Watch, but ultimately I opted not to include a Healthcare stock. The one that did look interesting Friday and today is Eli Lilly (LLY)--definitely worth a look.
Staples and Utilities are far from sexy and upside potential isn't that exciting. However, if the market is weak these are areas that will likely outperform the market. We can rotate back into the more growth-y sectors when the pullback or correction is over.
Carl and I talked about the market this morning and he sees a possible correction on the horizon, but he also said that stops are the best protection right now; it may not be necessary to go on a selling spree unless you want to lock in some profits. Neither of us were too excited about adding hedges at this time, but it is on my radar.
Good Luck & Good Trading,
Erin
Today's "Diamonds in the Rough": LMT, MET, PG and WEC.
Runner-ups: HSY, RLI, THS, LLY, RNR, UNH, CASY, CHD, GIS, MGM and NI.

RECORDING & DOWNLOAD LINK (12/29/2023):
Topic: DecisionPoint Diamond Mine (12/29/2023) LIVE Trading Room
Recording & Download Link HERE
Passcode: December#29
REGISTRATION for 1/5/2024:
When: Jan 5, 2024 09:00 AM Pacific Time (US and Canada)
Topic: DecisionPoint Diamond Mine (1/5/2024) LIVE Trading Room
Register in advance for this webinar HERE.
After registering, you will receive a confirmation email containing information about joining the webinar.

Here is the last recording from 12/18 (no recording on 12/25 or 1/1):
Welcome to DecisionPoint Diamonds, wherein I highlight ten "Diamonds in the Rough" per week. These are selected from the results of my DecisionPoint Scans which search for stocks that could benefit from the trend and condition of the market. Remember, these are not recommendations to buy or sell, but are the most interesting of the stocks that surfaced in my scans. My objective is to save you the work of the initial, tedious culling process, but you need to apply your own analysis to see if these stocks pique your interest as well. There are no guaranteed winners here!
"Predefined Scans Triggered" are taken from StockCharts.com using the "Symbol Summary" option instead of a "SharpChart" on the workbench.
Stop levels are all rounded down.
Lockheed Martin Corp. (LMT)
EARNINGS: 01/23/2024 (BMO)
Lockheed Martin Corp. is a global security and aerospace company, which engages in the research, design, development, manufacture, integration, and sustainment of technology systems, products, and services. It operates through the following business segments: Aeronautics, Missiles and Fire Control (MFC), Rotary and Mission Systems (RMS), and Space. The Aeronautics segment researches, designs, develops, manufactures, integrates, sustains, supports, and upgrades advanced military aircraft, including combat and air mobility aircraft, unmanned air vehicles, and related technologies. The MFC segment is involved in air and missile defense systems, tactical missiles and air-to-ground precision strike weapon systems, logistics, fire control systems, mission operations support, readiness, engineering support and integration services, manned and unmanned ground vehicles, and energy management solutions. The RMS segment designs, manufactures, services, and supports various military and commercial helicopters, surface ships, sea and land-based missile defense systems, radar systems, sea and air-based mission and combat systems, command and control mission solutions, cyber solutions, and simulation and training solutions. The Space segment includes the production of satellites, space transportation systems, and strategic, advanced strike, and defensive systems. The company was founded in 1912 and is headquartered in Bethesda, MD.
Predefined Scans Triggered: Moved Above Upper Bollinger Band, Moved Above Upper Price Channel, P&F Double Top Breakout, P&F Triple Top Breakout, Bullish 50/200-day MA Crossovers and Shooting Star.
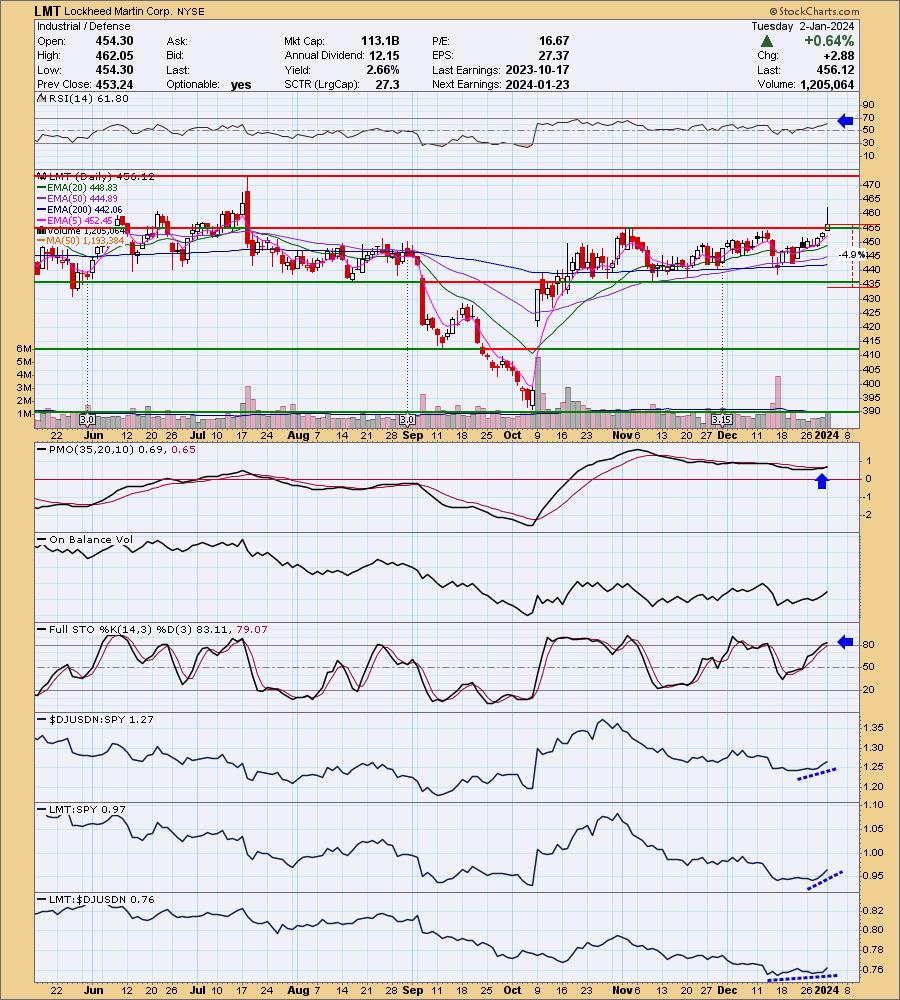
LMT is unchanged in after hours trading. Today's candlestick is a bearish shooting star, but it is also a nice breakout from an intermediate-term trading range. The RSI is positive and not at all overbought. The PMO just triggered a Crossover BUY Signal above the zero line. Stochastics are back above 80. Relative strength is only just beginning to rise for the group against the SPY. LMT outperforms the group and is now beginning to outperform the SPY. I've set the stop below the last trading range at 4.9% or $433.77.
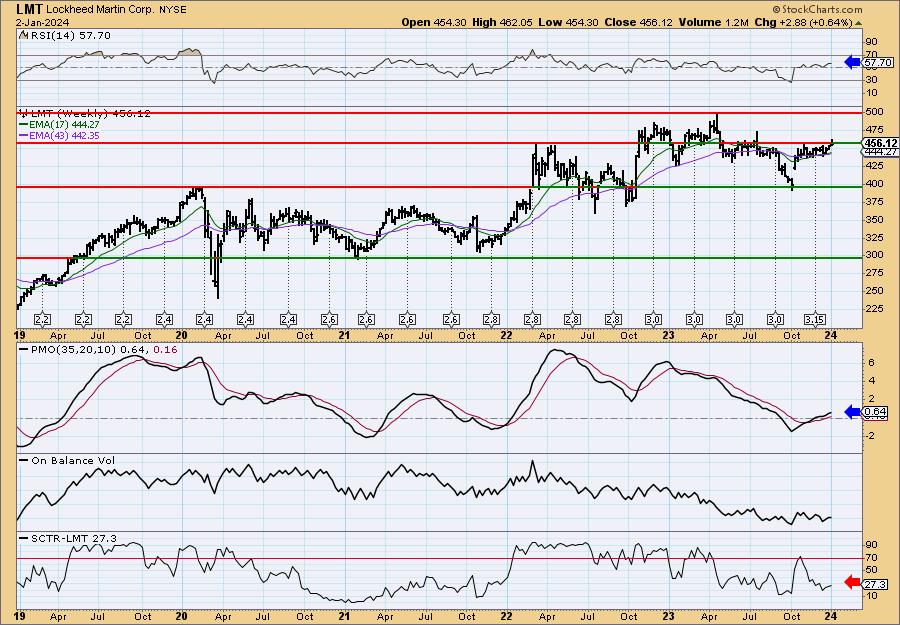
This is a fairly important breakout as it is bringing price above the early 2022 top. The rest of the chart is going well with the weekly RSI positive and not overbought and the weekly PMO rising on a Crossover BUY Signal. I do have a complaint that StockCharts Technical Rank (SCTR) is well below the hot zone* above 70. Should it continue to rally, consider an upside target of about 17% to $533.66.
*If a stock is in the "hot zone" above 70, it implies that it is stronger than 70% of its universe (large-, mid-, small-caps and ETFs) primarily in the intermediate to long terms.
Metlife, Inc. (MET)
EARNINGS: 01/31/2024 (AMC)
MetLife, Inc. provides insurance and financial services to individual and institutional customers. It offers life insurance, annuities, automobile and homeowner's insurance and retail banking services to individuals as well as group insurance, reinsurance and retirement and savings products and services. The firm operates through the following segments: U.S., Asia, Latin America, EMEA, MetLife Holdings and Corporate & Other. The U.S. segment offers a broad range of protection products and services aimed at serving the financial needs of customers throughout their lives. The U.S. segment is organized into three businesses: Group Benefits, Retirement and Income Solutions and Property & Casualty. The Asia segment offers a broad range of products to individuals and corporations, as well as other institutions and their respective employees, which include whole life, term life, variable life, universal life, accident & health insurance, fixed and variable annuities and endowment products. The Latin America segment offers a broad range of products to individuals and corporations, as well as other institutions and their respective employees, which include life insurance, accident & health insurance, credit insurance and retirement and savings products. The EMEA segment offers a broad range of products to individuals and corporations, as well as other institutions and their respective employees, which include life, accident & health, credit insurance and retirement and savings products. The MetLife Holdings segment consists of operations relating to products and businesses, such as variable, universal, term and whole life insurance, variable, fixed and index-linked annuities, long-term care insurance, as well as the assumed variable annuity guarantees. The Corporate & Other segment contains the excess capital, as well as certain charges and activities, not allocated to the segments. The company was founded on March 24, 1868 and is headquartered in New York, NY.
Predefined Scans Triggered: Elder Bar Turned Green, New CCI Buy Signals and P&F Double Top Breakout.
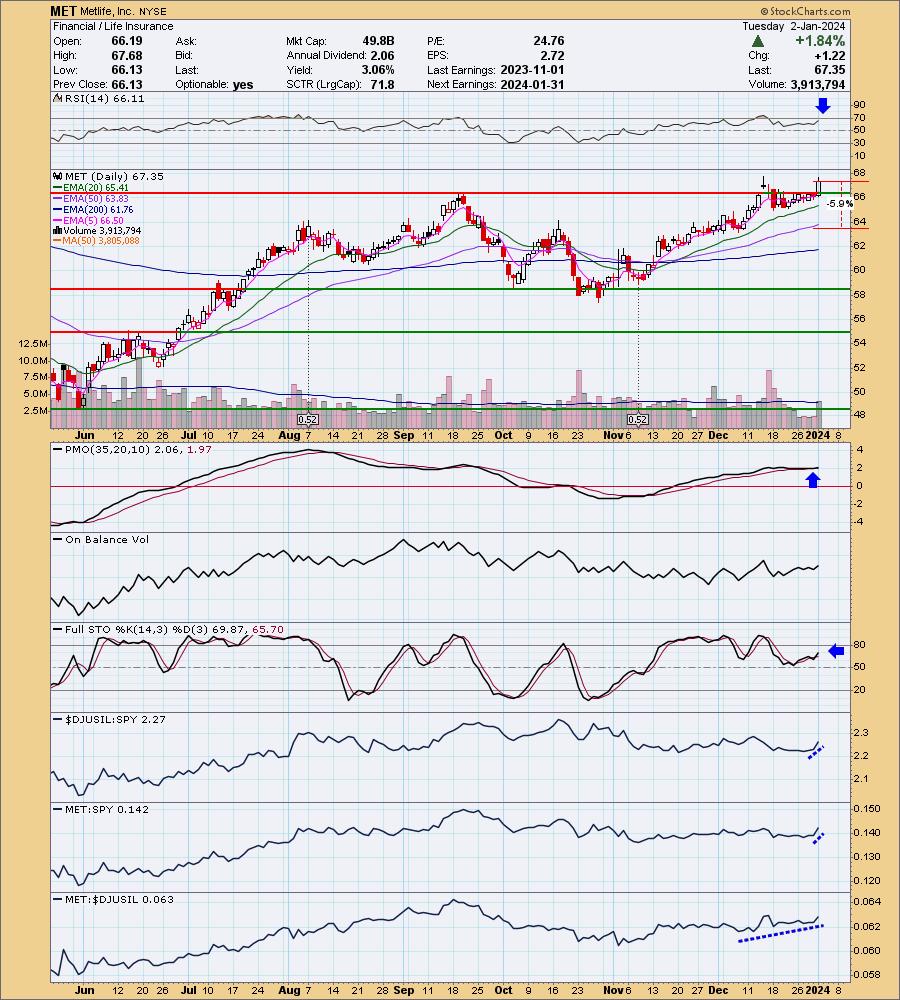
MET is down -0.58% in after hours trading. Today saw a nice breakout from a congestion area. This does have the look of a Bull Flag and this breakout could be signaling another leg up. The RSI is positive and not overbought. The PMO is rising after a recent Crossover BUY Signal. Stochastics turned up in positive territory and are headed to territory above 80. The group has been performing in line with the SPY but it is starting to outperform again. MET is a clear leader within the group and is just beginning to outperform the SPY on its own. The stop is set beneath the 50-day EMA around 5.9% or $63.37.
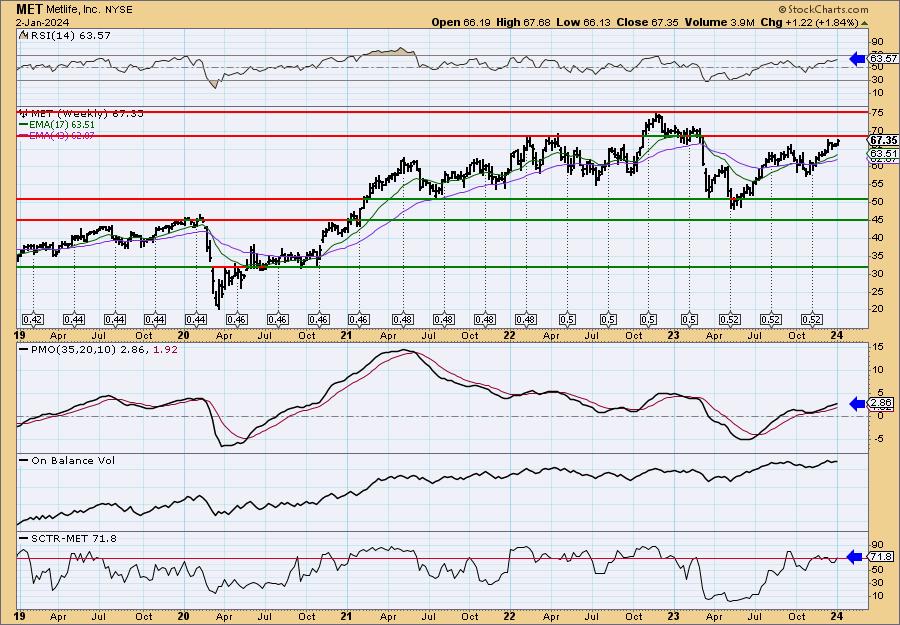
Price is arriving at resistance in the long term, but the indicators are configured positively enough to look for a breakout. The weekly RSI is positive and the weekly PMO is rising on a Crossover BUY Signal after bottoming above the zero line. The SCTR is just now reaching the hot zone. Consider a 17% upside target to around $78.80.
Procter & Gamble Co. (PG)
EARNINGS: 01/23/2024 (BMO)
Procter & Gamble Co. engages in the provision of branded consumer packaged goods. It operates through the following segments: Beauty, Grooming, Health Care, Fabric and Home Care, and Baby, Feminine and Family Care. The Beauty segment offers hair, skin, and personal care. The Grooming segment consists of shave care like female and male blades and razors, pre and post shave products, and appliances. The Health Care segment includes oral care products like toothbrushes, toothpaste, and personal health care such as gastrointestinal, rapid diagnostics, respiratory, and vitamins, minerals, and supplements. The Fabric and Home care segment consists of fabric enhancers, laundry additives and detergents, and air, dish, and surface care. The Baby, Feminine and Family Care segment sells baby wipes, diapers, and pants, adult incontinence, feminine care, paper towels, tissues, and toilet paper. The company was founded by William Procter and James Gamble in 1837 and is headquartered in Cincinnati, OH.
Predefined Scans Triggered: New CCI Buy Signals and Entered Ichimoku Cloud.
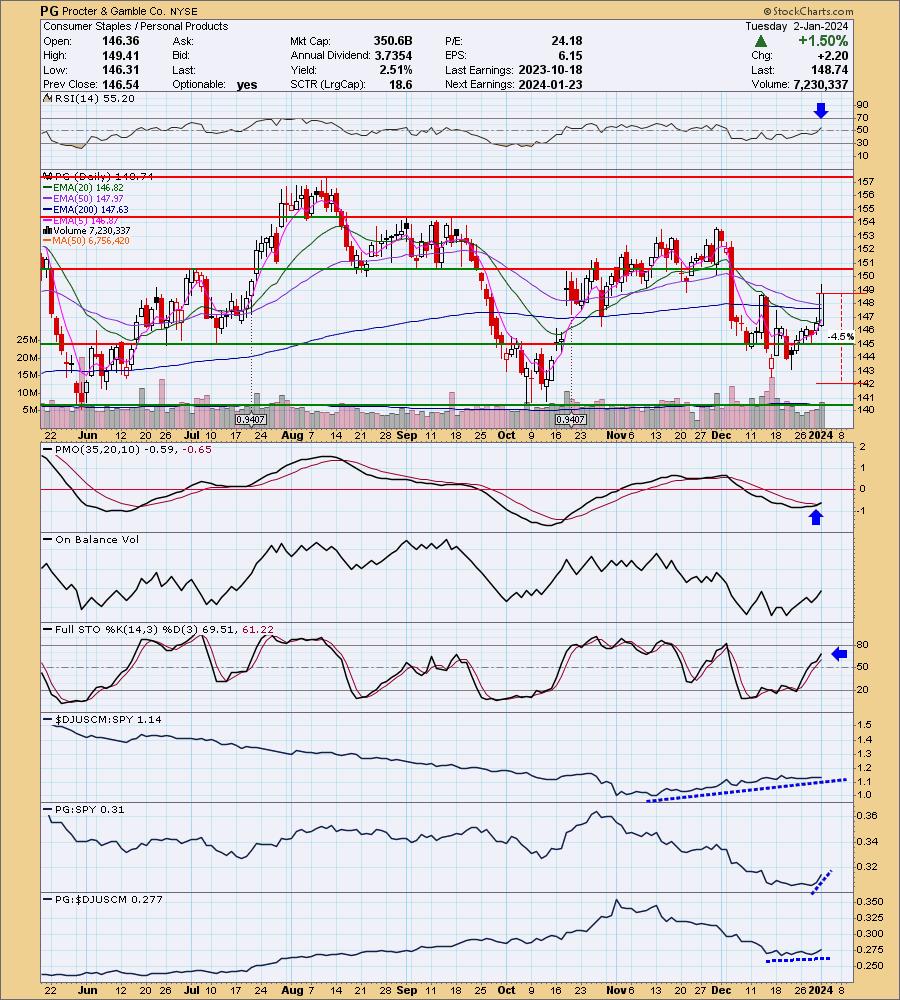
PG is up +0.17% in after hours trading. PG is a standard bearer for the Consumer Staples sector. I was happy to see it in today's scan results. The RSI is now positive and is far from being overbought. There is a brand new PMO Crossover BUY Signal. Stochastics are rising and should hit territory above 80 soon. The group is showing some outperformance and PG is a leader in the group. It is beginning to outperform the SPY. The stop is set beneath support at 4.5% or $142.04.
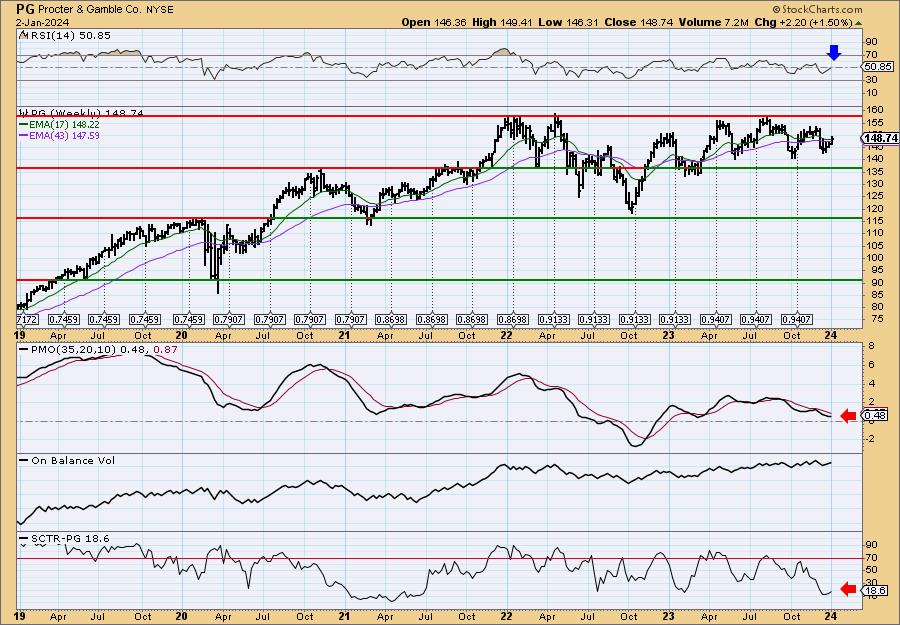
This is a rather boring trading range stock, but it does look ready to at least get to overhead resistance. The weekly RSI has reentered positive territory. The weekly PMO needs help, but it is decelerating. The SCTR is rising, but still remains well outside the hot zone. Keep this one short-term for now. Consider an upside target around 17% or $174.03.
WEC Energy Group, Inc. (WEC)
EARNINGS: 02/01/2024 (BMO)
WEC Energy Group, Inc. is a holding company, which engages in the generation and distribution of electricity and natural gas. It operates through the following segments: Wisconsin, Illinois, Other States, Electric Transmission, Non-Utility Energy Infrastructure and Corporate & Other. The Wisconsin segment refers to the electric and gas utility operations. The Illinois segment deals with natural gas utility and non-utility activities. The Other States segment pertains to natural gas operations of the firm's subsidiaries. The Electric Transmission segment holds interests in state regulatory commissions. The Non-Utility Energy Infrastructure segment includes Wisconsin Electric Power, which owns and leases generating facilities. The Corporate and Other segment refers to the firm's administrative and holding activities. The company was founded in 1981 and is headquartered in Milwaukee, WI.
Predefined Scans Triggered: New CCI Buy Signals and Parabolic SAR Buy Signals.
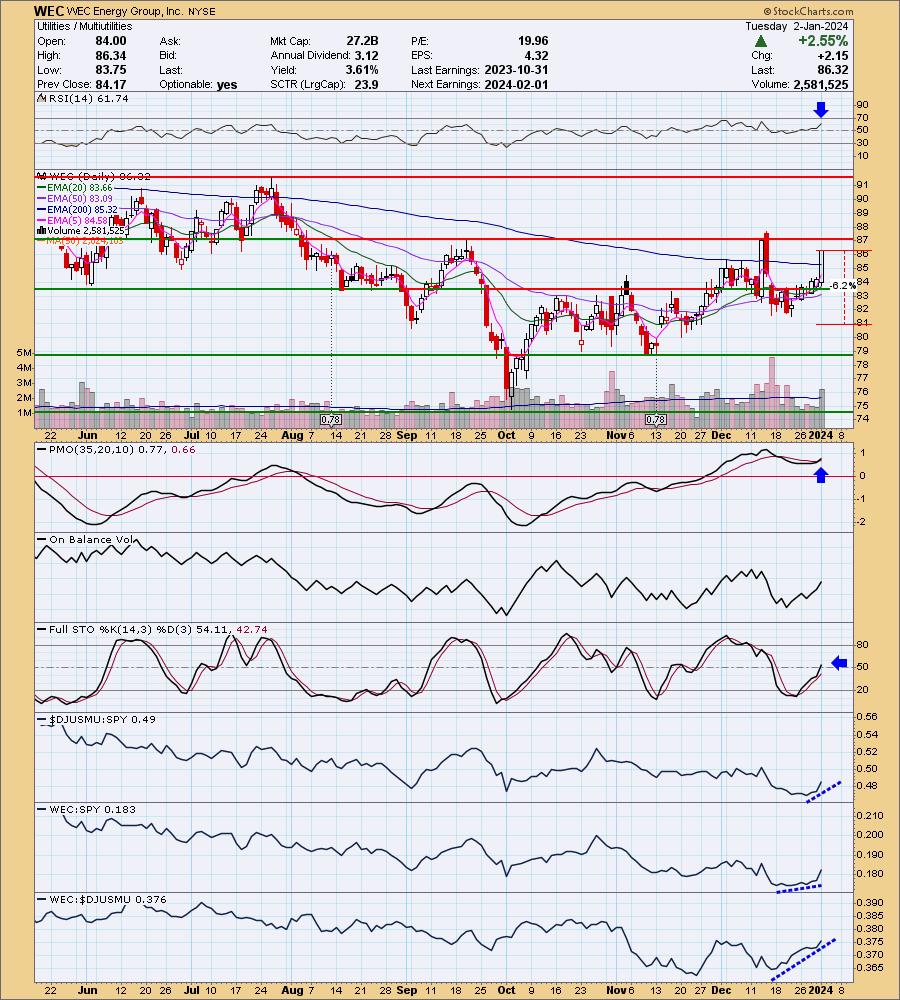
WEC is up +0.06% in after hours trading. Today saw a very strong upward thrust. It pushed price well above the 200-day EMA. This looks like a good rally that will see follow through. The RSI is positive, rising and not overbought. There is a new PMO Crossover BUY Signal that occurred well above the zero line which signifies pure strength. Stochastics just moved above net neutral (50). WEC is a leader in an industry group that is really starting to outperform. We should see more outperformance from WEC against the SPY. The stop is set beneath support at 6.2% or $80.96.
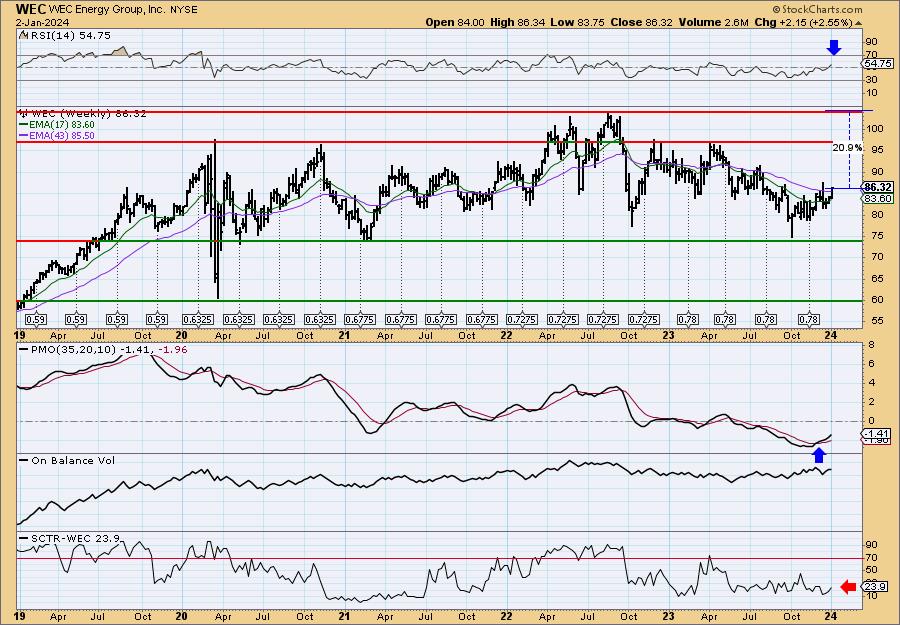
This looks like a typical Utilities stock--large trading range. Price is headed back up toward the top of the range again. The weekly RSI is positive and is not at all overbought. The weekly PMO is rising on a Crossover BUY Signal. I'd like to see a better SCTR, but at least it is rising right now.
Don't forget, on Thursdays I look at reader-requested symbols, click HERE to send me an email. I read every email I receive and try to answer them all!
Current Market Outlook:
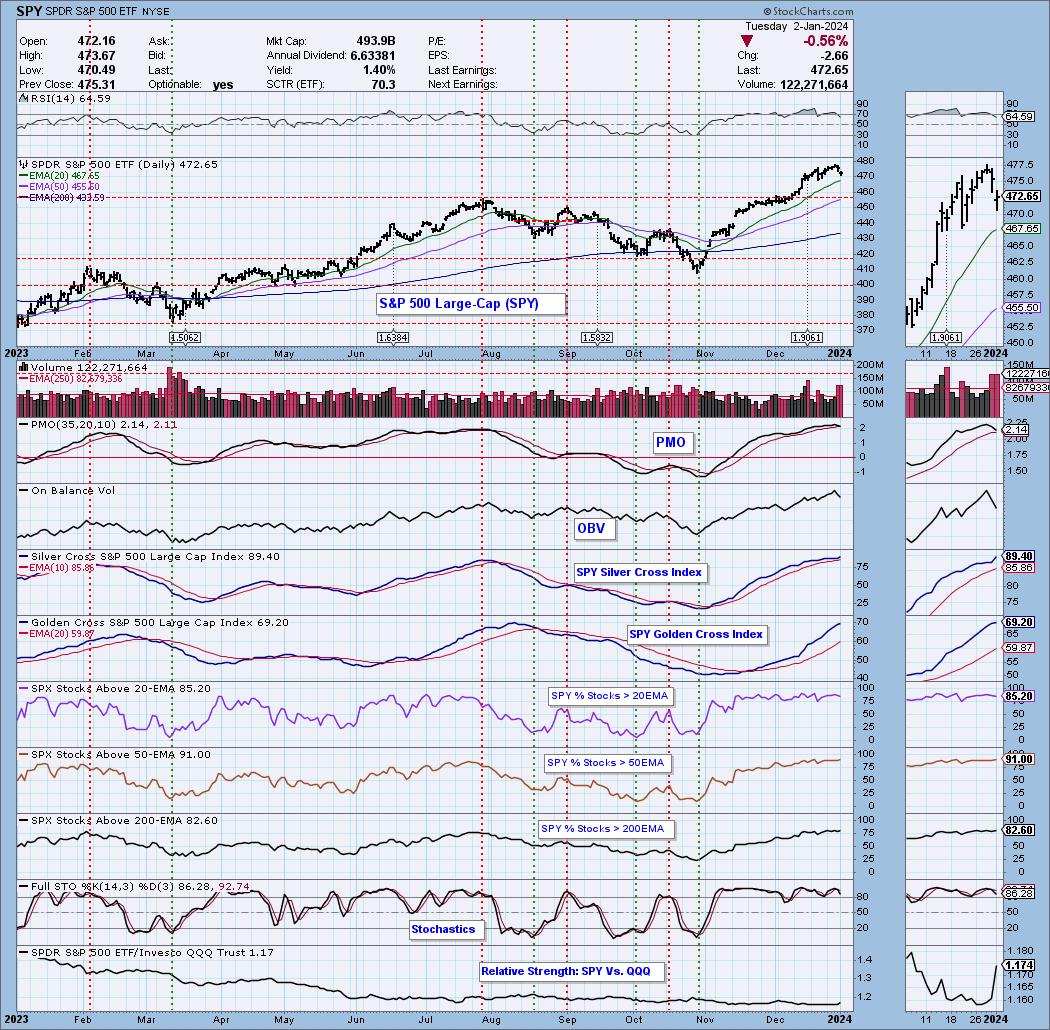
Market Environment: It is important to consider the odds for success by assessing the market tides. The following chart uses different methodologies for objectively showing the depth and trend of participation for intermediate- and long-term time frames.
- The Silver Cross Index (SCI) shows the percentage of SPX stocks on IT Trend Model BUY signals (20-EMA > 50-EMA)
- The Golden Cross Index (GCI) shows the percentage of SPX stocks on LT Trend Model BUY signals (50-EMA > 200-EMA)
Don't forget that as a "Diamonds" member, you have access to our GCI/SCI curated ChartList on DecisionPoint.com. You'll find it under "Members Only" links on the left side on the Blogs and Links Page.
Here is the current chart:
Full Disclosure: I am 75% long, 0% short.
I'm required to disclose if I currently own a stock I mention and/or may buy/short it within the next 72 hours.
"Technical Analysis is a windsock, not a crystal ball." - Carl Swenlin
(c) Copyright 2024 DecisionPoint.com
Watch the latest episode of DecisionPoint Trading Room with Carl & Erin Swenlin on Mondays 3:00p EST or on the DecisionPoint playlist on the StockCharts TV YouTube channel here!
NOTE: The stocks reported herein are from mechanical trading model scans that are based upon moving average relationships, momentum and volume. DecisionPoint analysis is then applied to get five selections from the scans. The selections given should prompt readers to do a chart review using their own analysis process. This letter is not a call for a specific action to buy, sell or short any of the stocks provided. There are NO sure things or guaranteed returns on the daily selection of "Diamonds in the Rough."
Regarding BUY/SELL Signals: The signal status reported herein is based upon mechanical trading model signals and crossovers. They define the implied bias of the price index/stock based upon moving average relationships and momentum, but they do not necessarily call for a specific action. They are information flags that should prompt chart review. Further, they do not call for continuous buying or selling during the life of the signal. For example, a BUY signal will probably (but not necessarily) return the best results if action is taken soon after the signal is generated. Additional opportunities for buying may be found as price zigzags higher, but the trader must look for optimum entry points. Conversely, exit points to preserve gains (or minimize losses) may be evident before the model mechanically closes the signal.
Helpful DecisionPoint Links:
Price Momentum Oscillator (PMO)
Swenlin Trading Oscillators (STO-B and STO-V)
For more links, go to DecisionPoint.com