
There were plenty of scan results to choose from today with one theme showing through. Today, the Software Industry Group was prevalent in today's scans. Additionally, I noticed Food Retailers showing strong. I opted not to present a Staples stock today. Instead I opted for two Software stocks.
The other two stocks I chose are from industry groups that are performing very well, Business Support Services and Medical Equipment. Let's see if these stocks can take advantage of that relative strength.
Good Luck & Good Trading,
Erin
Today's "Diamonds in the Rough": FCN, MANH, NOW and PEN.
Runner-ups: FCFS, MAA, CBOE and CDNS.

RECORDING & DOWNLOAD LINK (1/12/2024):
Topic: DecisionPoint Diamond Mine (1/12/2024) LIVE Trading Room
Recording & Download Link HERE.
Passcode: January#12
(Expires 1/26/2024)
REGISTRATION for 1/19/2024:
When: Jan 19, 2024 09:00 AM Pacific Time (US and Canada)
Topic: DecisionPoint Diamond Mine (1/19/2024) LIVE Trading Room
Register in advance for this webinar HERE.
After registering, you will receive a confirmation email containing information about joining the webinar.

Here is the recording link for 1/5 (not posted to YouTube this week, link expires in two weeks):
Passcode: January#8
Welcome to DecisionPoint Diamonds, wherein I highlight ten "Diamonds in the Rough" per week. These are selected from the results of my DecisionPoint Scans which search for stocks that could benefit from the trend and condition of the market. Remember, these are not recommendations to buy or sell, but are the most interesting of the stocks that surfaced in my scans. My objective is to save you the work of the initial, tedious culling process, but you need to apply your own analysis to see if these stocks pique your interest as well. There are no guaranteed winners here!
"Predefined Scans Triggered" are taken from StockCharts.com using the "Symbol Summary" option instead of a "SharpChart" on the workbench.
Stop levels are all rounded down.
FTI Consulting, Inc. (FCN)
EARNINGS: 02/22/2024 (BMO)
FTI Consulting, Inc. engages in the provision of financial, legal, operational, political and regulatory, reputational and transactional advisory services. It operates through the following segments: Corporate Finance and Restructuring, Forensic and Litigation Consulting, Economic Consulting, Technology, and Strategic Communications. The Corporate Finance and Restructuring segment focuses on the strategic, operational, financial, and capital needs of clients. The Forensic and Litigation Consulting segment offers law firms, companies, government clients, and other interested parties with multidisciplinary, independent dispute advisory, investigations, data analytics, forensic accounting, business intelligence, risk mitigation services and interim management services for health solutions practice clients. The Economic Consulting segment consists of the analysis of complex economic issues for use in legal, regulatory and international arbitration proceedings, strategic decision making, and public policy debates for law firms, companies, government entities and other interested parties. The Technology segment includes a portfolio of information governance, e-discovery and data analytics software, services, and consulting support to corporations, law firms, courts and government agencies. The Strategic Communications segment designs and executes communications strategies for management teams and boards of directors relating to managing financial, regulatory and reputational challenges, navigating market disruptions, articulating brand, staking a competitive position, and preserving and growing operations. The company was founded by Dan Luczak and Joseph Reynolds in 1982 and is headquartered in Washington, DC.
Predefined Scans Triggered: None.
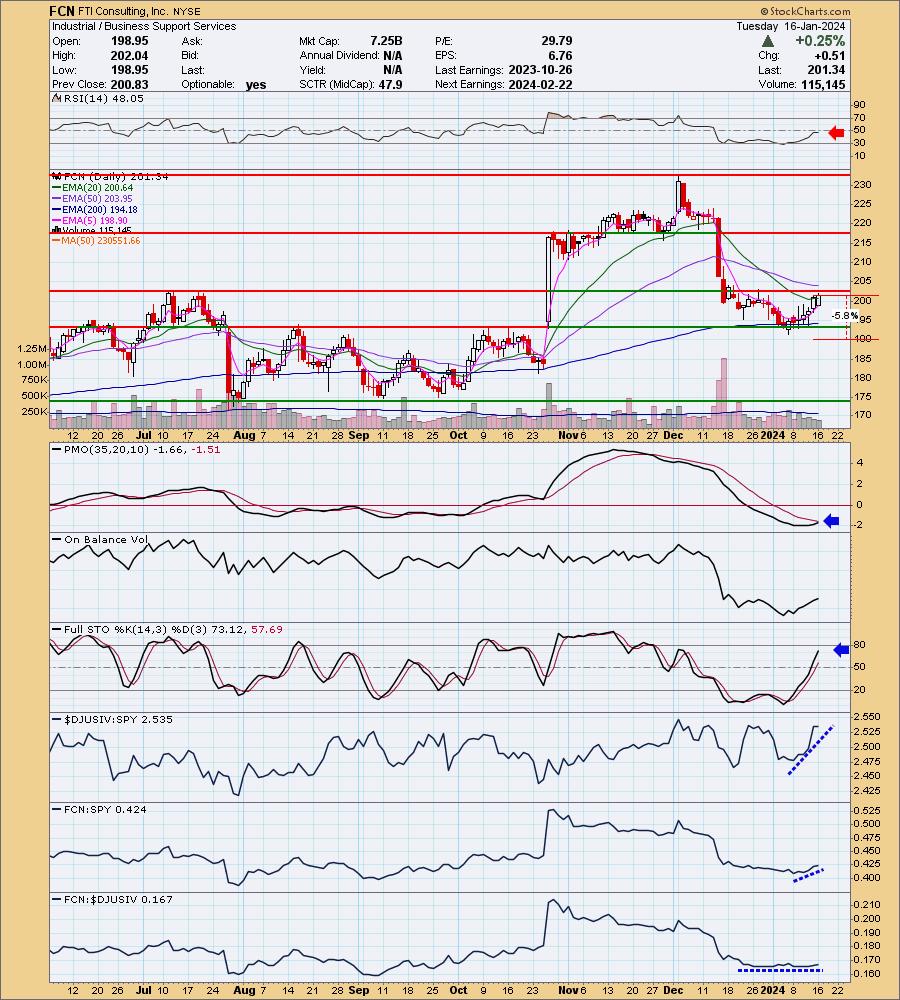
FCN is down -0.67% in after hours trading. We are getting in somewhat early on the move based primarily on the RSI being in negative territory currently. This reversal is occurring right on support at prior tops and the 200-day EMA. The PMO is nearing a Crossover BUY Signal. Stochastics are rising strongly toward 80. The industry group is on fire as of last week. FCN is performing in line with the group so consequently it is outperforming the SPY. Resistance is nearing so we could be in for a small pullback before a breakout move. The stop is set beneath support at 5.8% or $189.66.
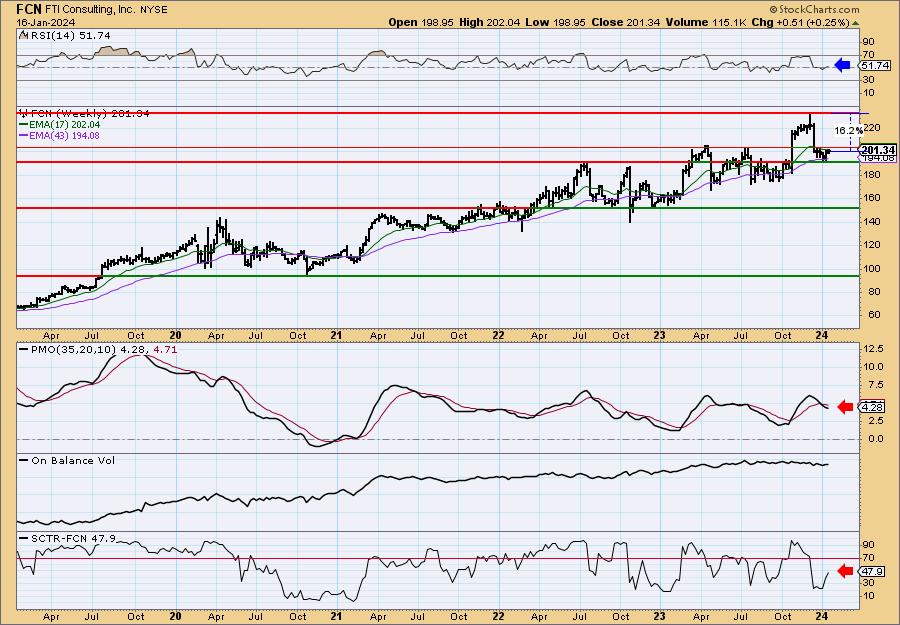
The weekly chart needs some work. The weekly RSI looks good, but the weekly PMO is still in decline. If it were to turn up I'd say this could be intermediate-term, but until then keep it short-term. The StockCharts Technical Rank (SCTR) is not in the hot zone* but it is moving up quickly. Should it reach prior all-time highs it would be an over 16% gain.
*If a stock is in the "hot zone" above 70, it implies that it is stronger than 70% of its universe (large-, mid-, small-caps and ETFs) primarily in the intermediate to long terms.
Manhattan Associates, Inc. (MANH)
EARNINGS: 01/30/2024 (AMC)
Manhattan Associates, Inc. engages in developing, selling, deploying, servicing, and maintaining software solutions. Its solutions focus on supply chains, inventory, and omnichannel for retailers, wholesalers, manufacturers, logistics providers and other organizations. It operates through the following geographical segments: The Americas, Europe, Middle East and Africa, and Asia Pacific. The company was founded by Deepak Raghavan in October 1990 and is headquartered in Atlanta, GA.
Predefined Scans Triggered: Bullish MACD Crossovers.
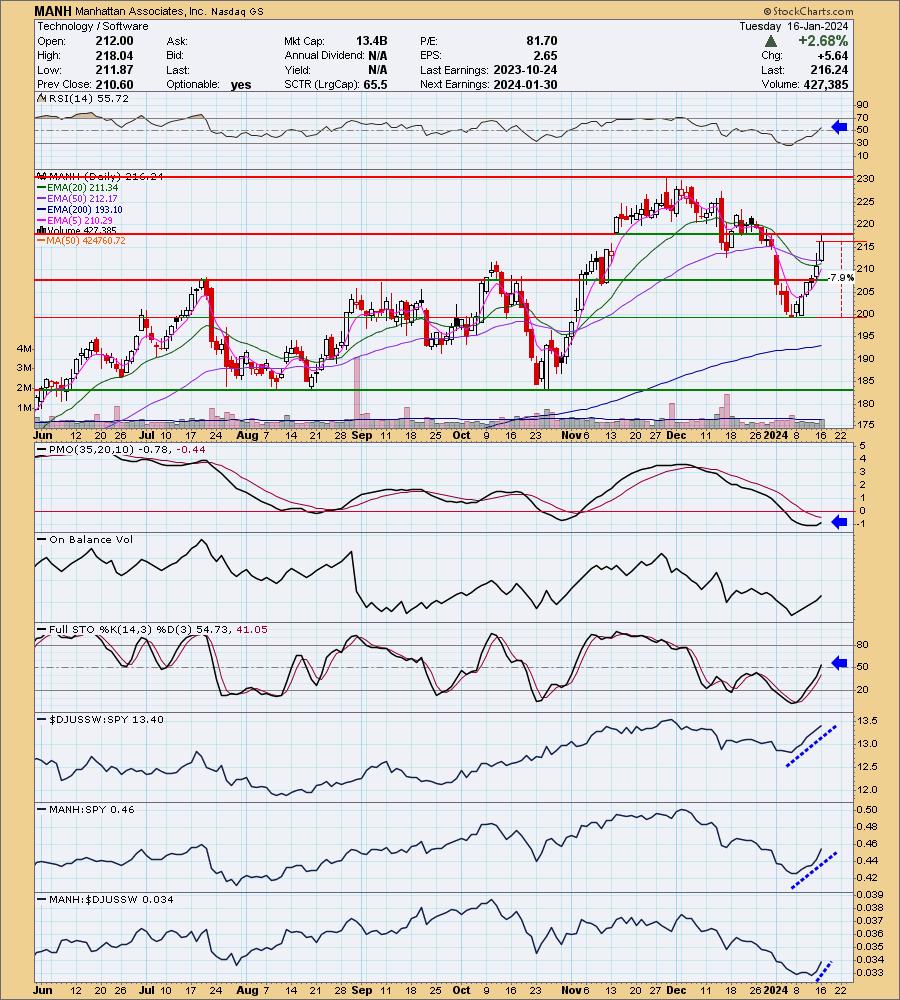
MANH is unchanged in after hours trading. It has been on a strong rally and it has reached some gap resistance so a pullback before a breakout would make sense here. The RSI is back in positive territory. The PMO has begun to rise. Stochastics just pushed into positive territory above net neutral (50). As noted in the opening, the group is really outperforming right now. MANH is outperforming both the group and the SPY. I've set a 7.9% stop below support around $199.15.
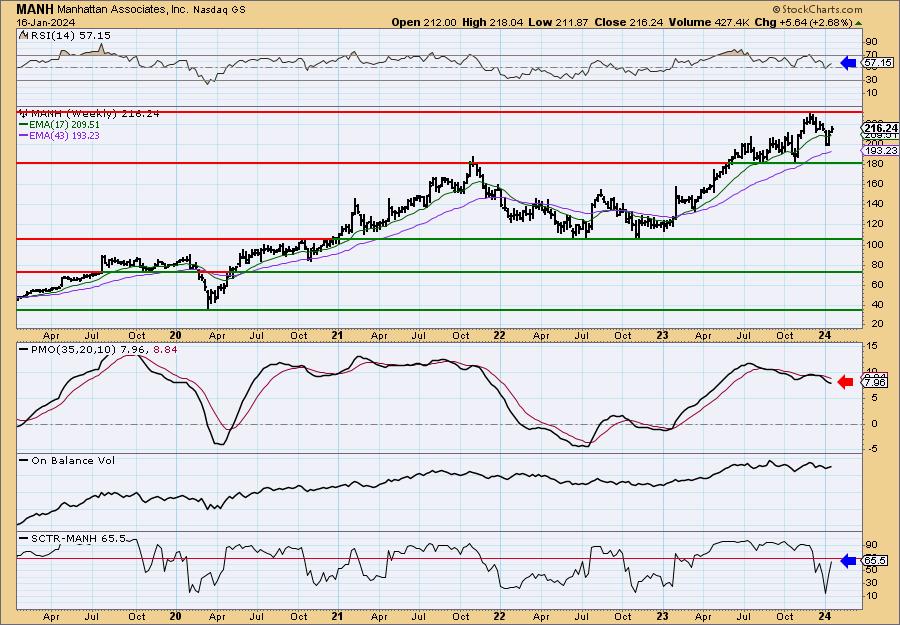
The weekly chart needs to only see the weekly PMO turn back up. It is decelerating in preparation. The weekly RSI is positive and although the SCTR isn't in the hot zone, it is rising very quickly. I would suggest an upside target of about 17% to $253.00.
ServiceNow, Inc. (NOW)
EARNINGS: 01/24/2024 (AMC)
ServiceNow, Inc. engages in the provision of enterprise cloud computing solutions. The firm delivers digital workflows on a single enterprise cloud platform called the Now Platform. Its product portfolio is focused on providing Information Technology, Employee and Customer workflows. The company was founded by Frederic B. Luddy in June 2004 and is headquartered in Santa Clara, CA.
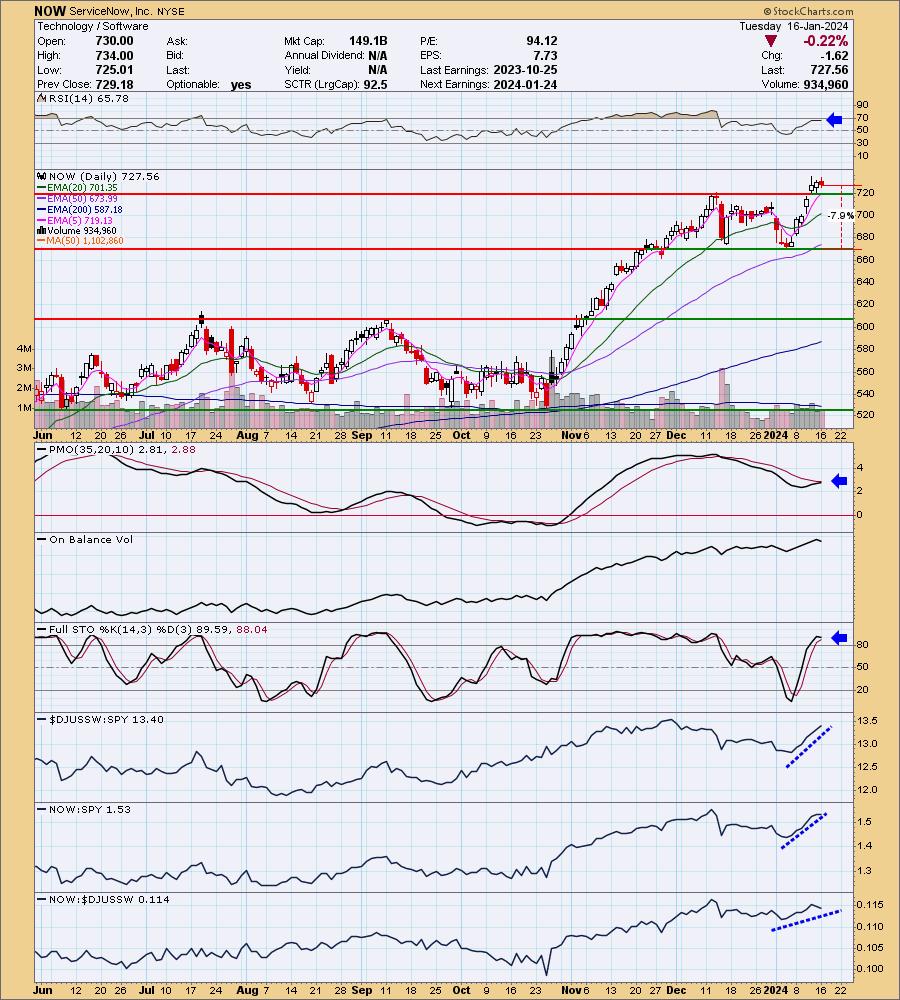
Predefined Scans Triggered: P&F Double Top Breakout.
NOW is up +0.20% in after hours trading. I really like this chart given the recent breakout and price's ability to stay above prior resistance. The RSI is positive and not yet overbought. The PMO is nearing a Crossover BUY Signal. Volume is solid based on the rising OBV. Stochastics are above 80. Relative strength is improving for NOW against both the group and the SPY. I've suggested a 7.9% stop around $670.08.
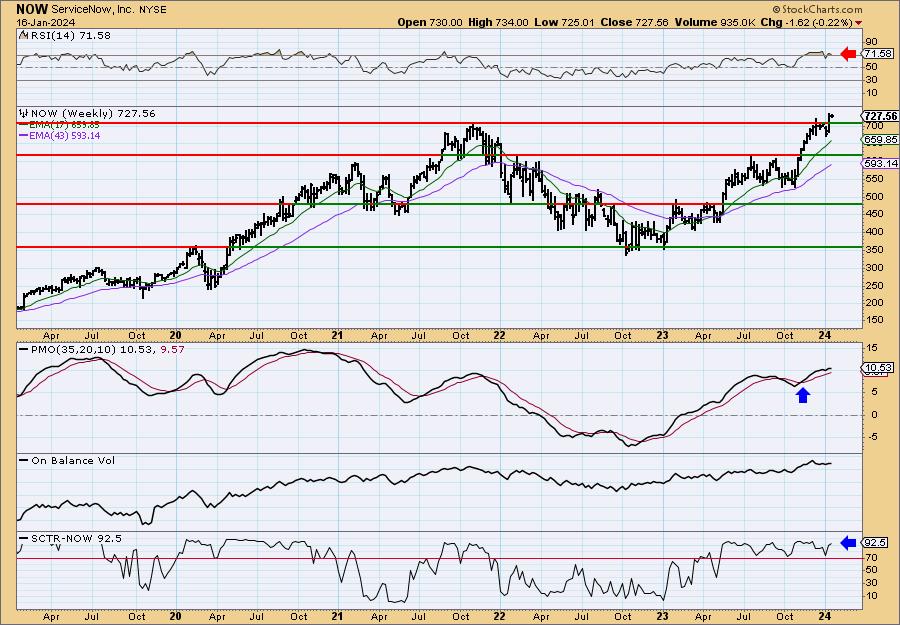
The weekly chart is good. The only complaint I have is the overbought weekly RSI and that condition can persist given the nice rally out of 2022 lows. The weekly PMO is rising on a Crossover BUY Signal and is not overbought. The SCTR has taken up residence in the hot zone for months. Consider a 17% upside target to around $851.24.
Penumbra, Inc. (PEN)
EARNINGS: 02/22/2024 (AMC)
Penumbra, Inc. engages in the design, development, manufacture, and marketing of innovative medical devices. It offers neurovascular thrombectomy and embolization and access technologies, neurosurgical tools, Penumbra LANTERN Delivery Microcatheter, and Penumbra Occlusion Device (POD) system. The company was founded by Arani Bose and Adam Elsesser on June 21, 2004, and is headquartered in Alameda, CA.
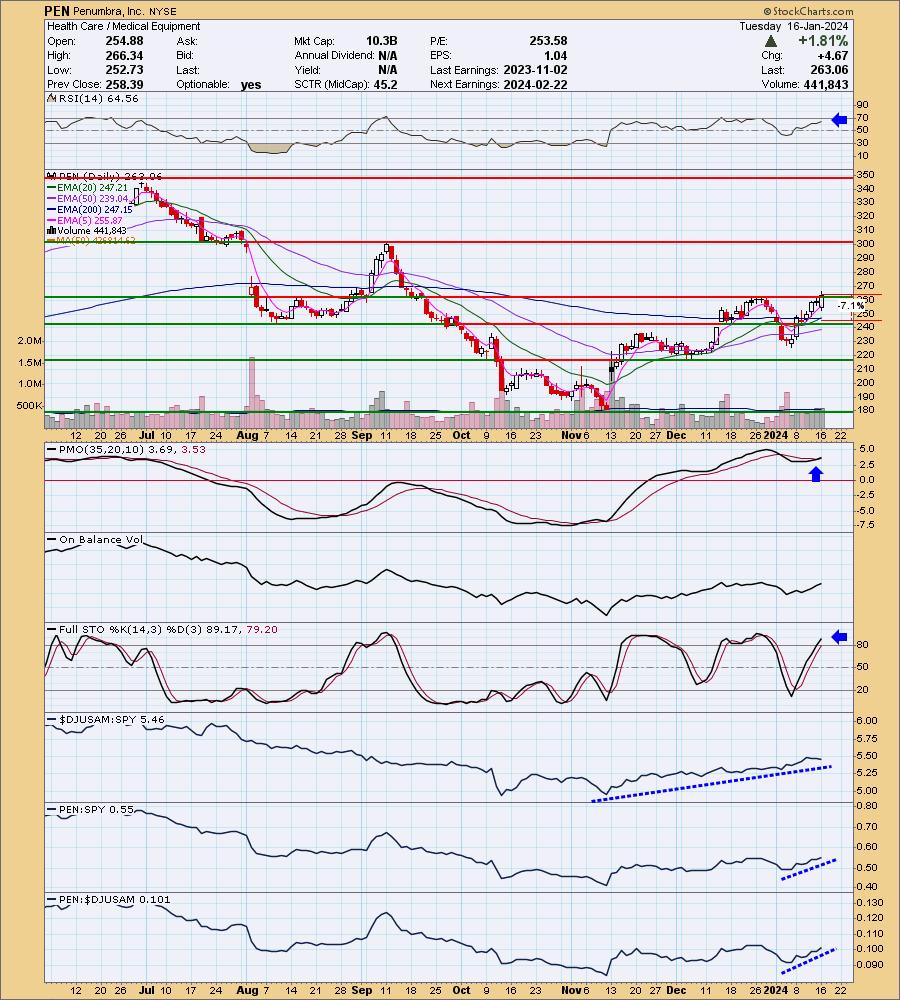
Predefined Scans Triggered: Moved Above Upper Price Channel, P&F Ascending Triple Top Breakout and P&F Double Top Breakout.
PEN is unchanged in after hours trading. Price closed above overhead resistance today after experiencing a strong rally. This is a "V" bottom that suggests we will see price breakaway further from prior resistance. The PMO has given us a Crossover BUY Signal well above the zero line signaling strength. Stochastics are above 80. Relative strength for the group has been excellent since November. PEN is now becoming an outperformer which should really work to its advantage. The stop is set at 7.1% or $244.38.
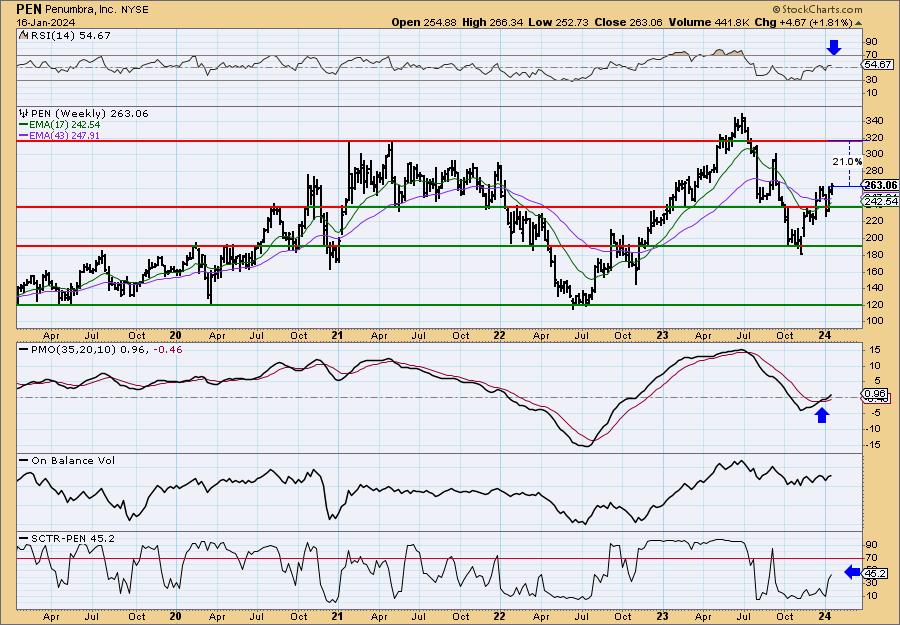
I think the weekly chart is strong enough to look to this as a possible intermediate-term investment, not just a short-term trade. The weekly RSI is now in positive territory and the weekly PMO is rising on a Crossover BUY Signal. The weekly PMO is not at all overbought. The SCTR may not be in the hot zone, but it is headed there quickly. I've marked upside potential to 21% but price could certainly test all-time highs.
Don't forget, on Thursdays I look at reader-requested symbols, click HERE to send me an email. I read every email I receive and try to answer them all!
Current Market Outlook:
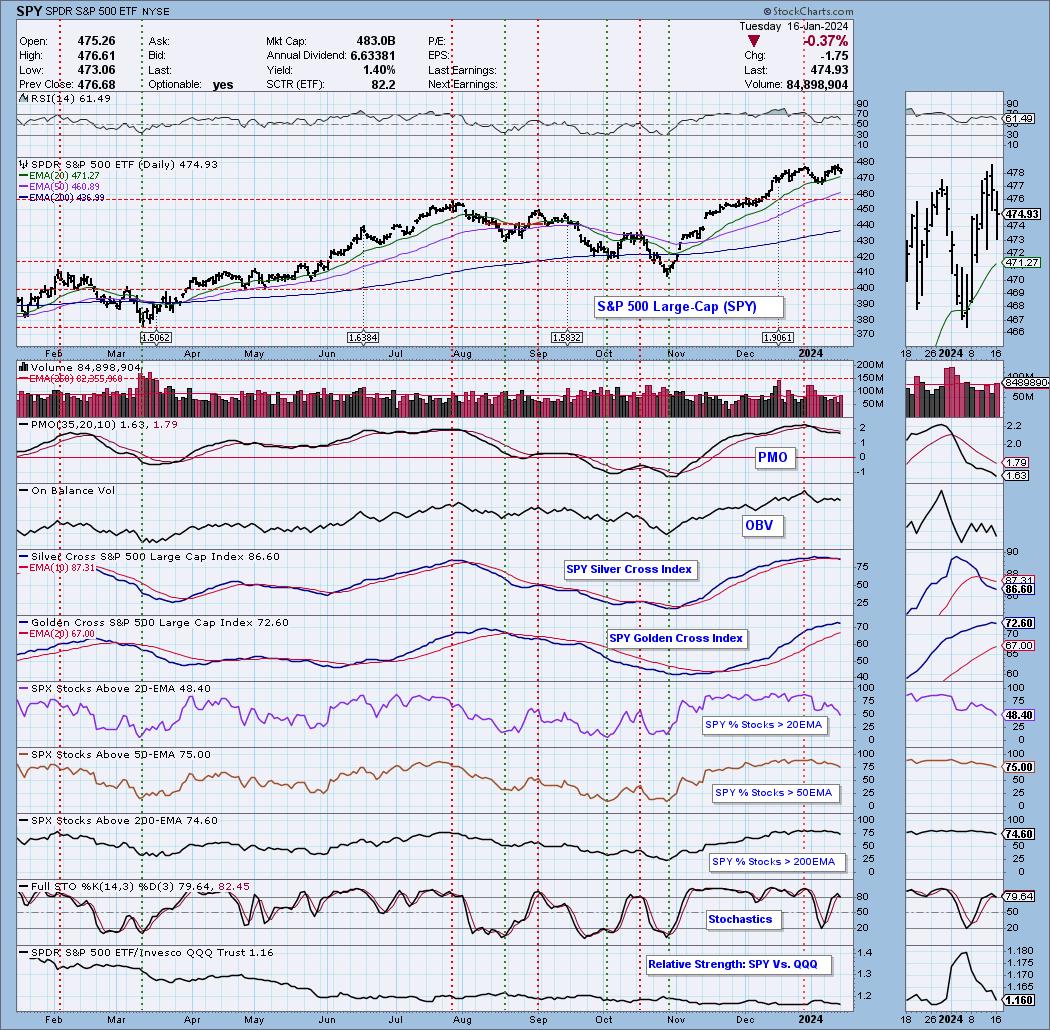
Market Environment: It is important to consider the odds for success by assessing the market tides. The following chart uses different methodologies for objectively showing the depth and trend of participation for intermediate- and long-term time frames.
- The Silver Cross Index (SCI) shows the percentage of SPX stocks on IT Trend Model BUY signals (20-EMA > 50-EMA)
- The Golden Cross Index (GCI) shows the percentage of SPX stocks on LT Trend Model BUY signals (50-EMA > 200-EMA)
Don't forget that as a "Diamonds" member, you have access to our GCI/SCI curated ChartList on DecisionPoint.com. You'll find it under "Members Only" links on the left side on the Blogs and Links Page.
Here is the current chart:
Full Disclosure: I am 75% long, 0% short.
I'm required to disclose if I currently own a stock I mention and/or may buy/short it within the next 72 hours.
"Technical Analysis is a windsock, not a crystal ball." - Carl Swenlin
(c) Copyright 2024 DecisionPoint.com
Watch the latest episode of DecisionPoint Trading Room with Carl & Erin Swenlin on Mondays 3:00p EST or on the DecisionPoint playlist on the StockCharts TV YouTube channel here!
NOTE: The stocks reported herein are from mechanical trading model scans that are based upon moving average relationships, momentum and volume. DecisionPoint analysis is then applied to get five selections from the scans. The selections given should prompt readers to do a chart review using their own analysis process. This letter is not a call for a specific action to buy, sell or short any of the stocks provided. There are NO sure things or guaranteed returns on the daily selection of "Diamonds in the Rough."
Regarding BUY/SELL Signals: The signal status reported herein is based upon mechanical trading model signals and crossovers. They define the implied bias of the price index/stock based upon moving average relationships and momentum, but they do not necessarily call for a specific action. They are information flags that should prompt chart review. Further, they do not call for continuous buying or selling during the life of the signal. For example, a BUY signal will probably (but not necessarily) return the best results if action is taken soon after the signal is generated. Additional opportunities for buying may be found as price zigzags higher, but the trader must look for optimum entry points. Conversely, exit points to preserve gains (or minimize losses) may be evident before the model mechanically closes the signal.
Helpful DecisionPoint Links:
Price Momentum Oscillator (PMO)
Swenlin Trading Oscillators (STO-B and STO-V)
For more links, go to DecisionPoint.com