
I only had one person send in Reader Requests and all were presentable, but today I added one of my own. There were plenty of scan results so I do have some runner-ups for you to take a look at.
Two themes that came through were Industrial Machinery and Auto Parts. I opted to look at the four auto parts stocks and pick the one I liked the best using relative strength. The choice was pretty clear. We'll see how it does.
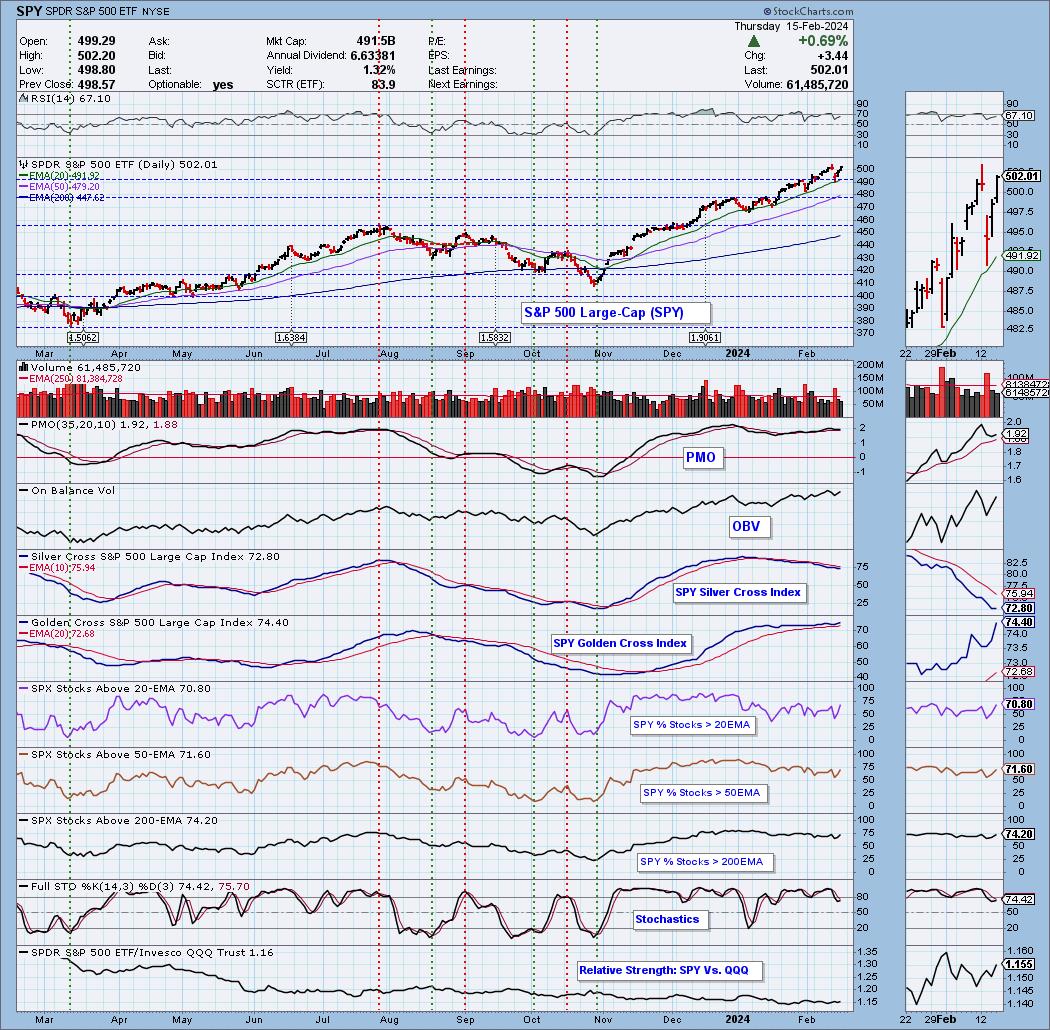
The market is still making its way up with small-caps enjoying the most action. As I said before and I'll continue to say, let the market stop you out. I don't see any reason to sell when the market is doing what it is. The exception to that rule would be a chart that is beginning to sour with a declining PMO and Stochastics. Tighten your stops on those or let them go. I've opted to go with trailing stops as I was getting frustrated having to continually move them up.
I was asked if I could narrow down my "Diamonds in the Rough" and actually pick just one as my overall pick. It is so hard to cull the lists as it is and deciding on my favorite is tough. I also don't want to imply that you should definitely pick a particular "Diamond in the Rough". I'm open to your email comments. Would you like fewer picks per week? Or a favorite pick? I'm open to suggestions.
Tomorrow is the Diamond Mine trading room! Bring your picks and see what we come up with in our scans!
Good Luck & Good Trading,
Erin
Today's "Diamonds in the Rough": BKD, FRO and PHIN.
Runner-ups: ALV, OTIS, PPG, SPXC, VBTX, AIN, AORT, AXL, PRU, USPH and XPEL.
Other requests: TWST, ITCI and ESI.

RECORDING & DOWNLOAD LINK (2/9/2024):
Topic: DecisionPoint Diamond Mine (2/9/2024) LIVE Trading Room
Recording & Download Link HERE
Passcode: February#9
REGISTRATION for 2/16/2024:
When: Feb 16, 2024 09:00 AM Pacific Time (US and Canada)
Topic: DecisionPoint Diamond Mine (2/16/2024) LIVE Trading Room
Register in advance for this webinar HERE
After registering, you will receive a confirmation email containing information about joining the webinar.

Here is the latest recording from February 12th. Click HERE to subscribe to the DecisionPoint YouTube Channel to be notified when new content is available.
Welcome to DecisionPoint Diamonds, wherein I highlight ten "Diamonds in the Rough" per week. These are selected from the results of my DecisionPoint Scans which search for stocks that could benefit from the trend and condition of the market. Remember, these are not recommendations to buy or sell, but are the most interesting of the stocks that surfaced in my scans. My objective is to save you the work of the initial, tedious culling process, but you need to apply your own analysis to see if these stocks pique your interest as well. There are no guaranteed winners here!
"Predefined Scans Triggered" are taken from StockCharts.com using the "Symbol Summary" option instead of a "SharpChart" on the workbench.
Stop levels are all rounded down.
Brookdale Senior Living, Inc. (BKD)
EARNINGS: 02/20/2024 (AMC)
Brookdale Senior Living, Inc. engages in the operation of senior living communities. The firm manages independent living, assisted living and dementia-care communities and continuing care retirement centers. It operates through the following segments: Independent Living Assisted Living & Memory Care, CCRCs, Health Care Services and Management Services. The Independent Living segment is primarily designed for middle to upper income seniors who desire an upscale residential environment providing the highest quality of service. The Assisted Living & Memory Care segment offer housing and 24-hour assistance with ADLs to mid-acuity frail and elderly residents. The CCRCs segment offers a variety of living arrangements and services to accommodate all levels of physical ability and health. The Healthcare Services segment provides home health, hospice and outpatient therapy services, as well as education and wellness programs, to residents of many communities and to seniors living outside communities. The Management Services segment composes of communities operated by the company pursuant to management agreements. The company was founded in 1978 and is headquartered in Brentwood, TN.
Predefined Scans Triggered: Improving Chaikin Money Flow, Moved Above Upper Keltner Channel, New 52-week Highs, P&F Ascending Triple Top Breakout and P&F Double Top Breakout.
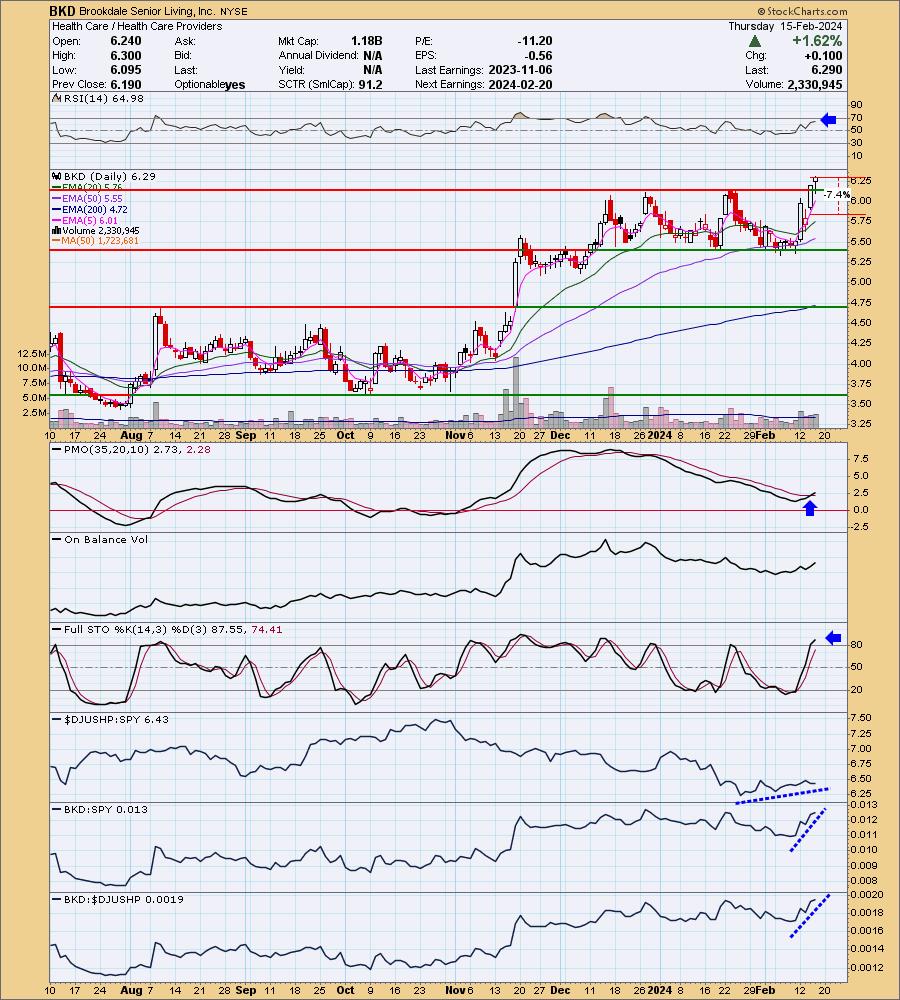
BKD is unchanged in after hours trading. I liked today's continuation of yesterday's breakout move. It is coming out of a trading range that has been intact for over a month. The RSI is positive and the PMO just gave us a Crossover BUY Signal. Stochastics are above 80. We also have rising On Balance Volume (OBV) confirming the rally. Relative strength is rising strongly for BKD against the group and the SPY. I've set the stop at 7.4% around where the 20-day EMA might be later at $5.82. Also be careful as this is low-priced, position size wisely.
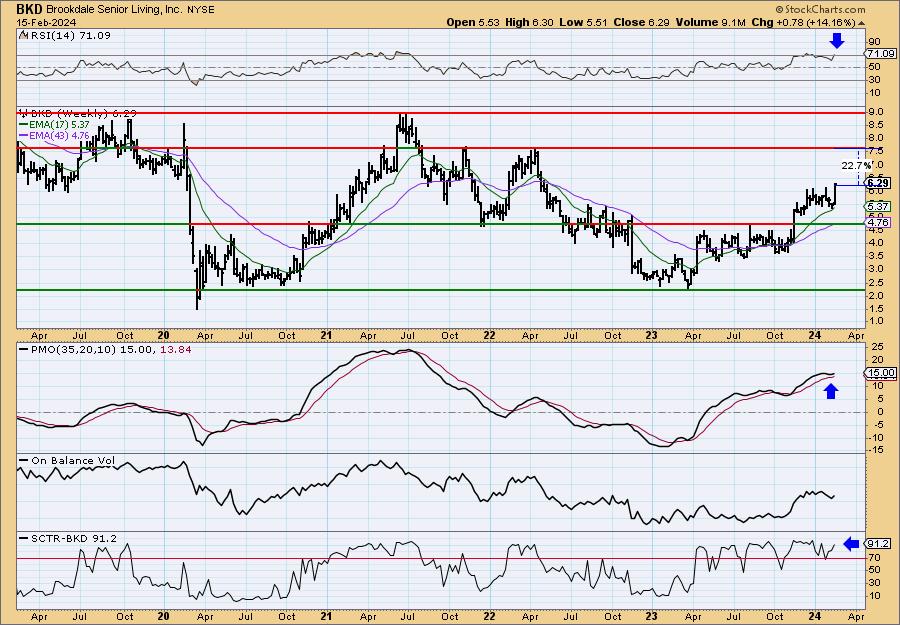
The weekly RSI is overbought now, but not terribly so. The weekly PMO is surging above the signal line and well above the zero line. The StockCharts Technical Rank (SCTR) is well within the hot zone* above 70. This could be considered for an intermediate-term investment. Upside potential to the next level of resistance is over 22%.
*If a stock is in the "hot zone" above 70, it implies that it is stronger than 70% of its universe (large-, mid-, small-caps and ETFs) primarily in the intermediate to long terms.
Frontline Ltd. (FRO)
EARNINGS: 02/29/2024 (BMO)
Frontline Plc is an international shipping company, which engages in the ownership and operation of oil and product tankers. It also offers the seaborne transportation of crude oil and oil products. The company was founded in 1985 and is headquartered in Limmasol, Cyprus.
Predefined Scans Triggered: New 52-week Highs, Moved Above Upper Bollinger Band, Moved Above Upper Price Channel, P&F Ascending Triple Top Breakout and P&F Double Top Breakout.
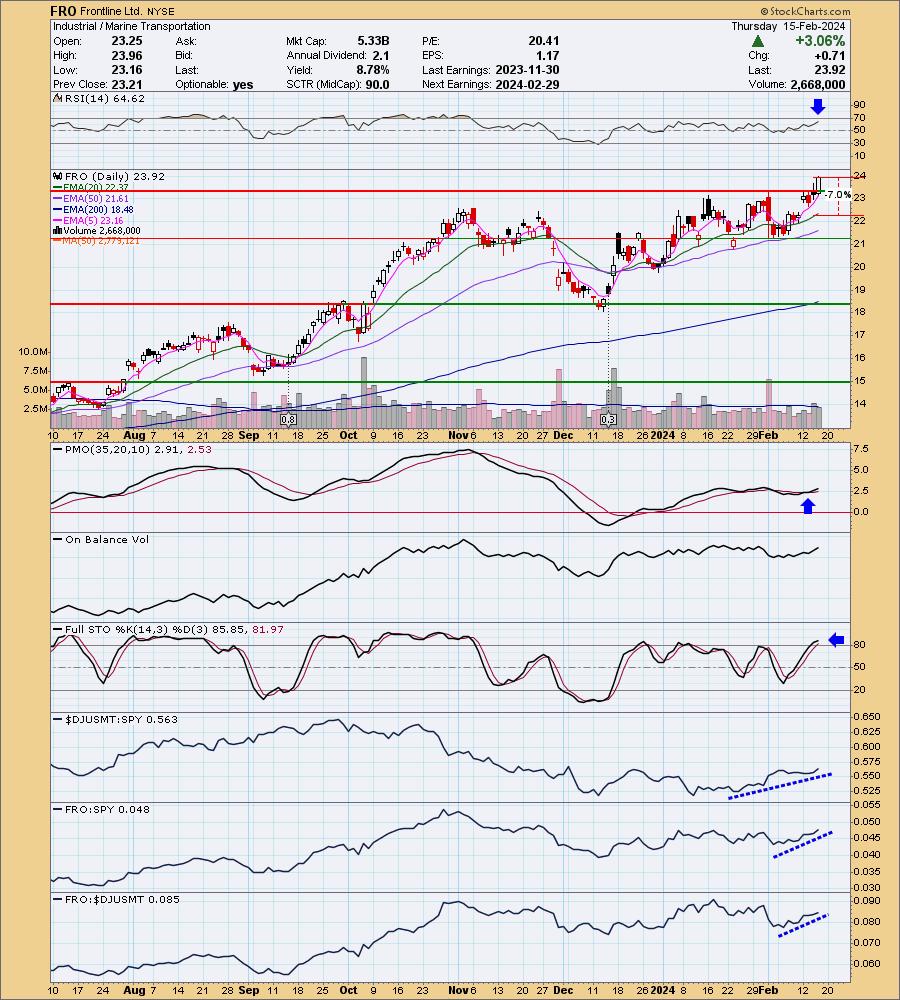
FRO is up +0.33% in after hours trading. I liked today's breakout move to new 52-week highs. The RSI is in positive territory and there is a PMO Crossover BUY Signal well above the zero line. The OBV is rising and confirming the rising trend. Stochastics are above 80 and relative strength lines are all moving higher. I am looking for this rising trend to continue further. I've set the stop at the 20-day EMA around 7% or $22.24.
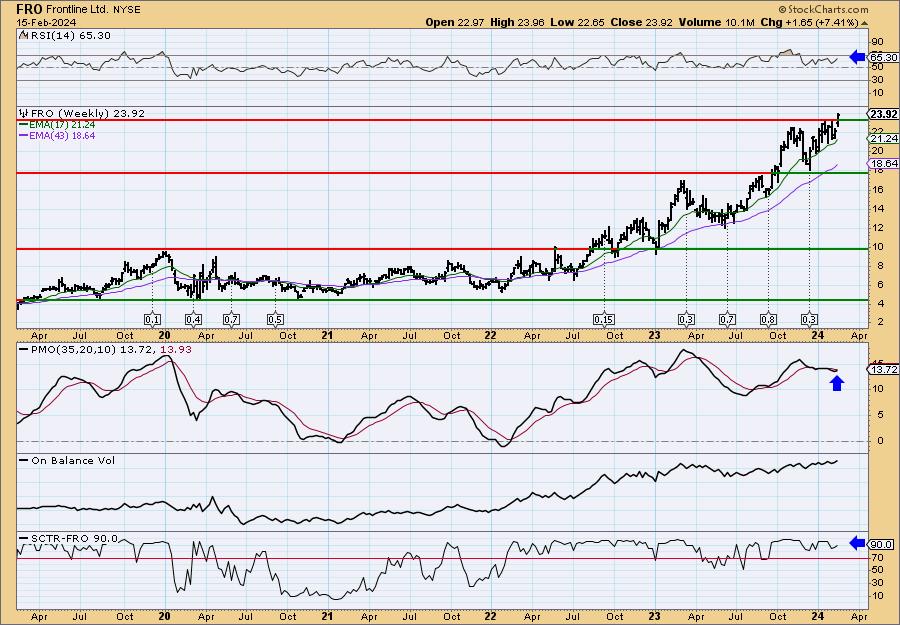
We're not just looking at new 52-week highs, this is an all-time high. The weekly RSI is positive and not overbought. The weekly PMO has turned up and is going in for a Crossover BUY Signal. The OBV is rising and confirming the rising trend. The SCTR is in the hot zone above 70.
PHINIA (PHIN)
EARNINGS: 02/21/2024 (BMO)
PHINIA, Inc. engages in the development, design, and manufacture of integrated components and systems that optimize performance, increase efficiency and reduce emissions in combustion and hybrid propulsion for commercial vehicles, industrial applications, and light vehicles. It operates through Fuel Systems and Aftermarket segments. The Fuel Systems segment provides advanced fuel injection systems, fuel delivery modules, canisters, sensors, electronic control modules, and associated software. The Aftermarket segment sells products to independent aftermarket customers and OES customers. Its product portfolio includes a wide range of solutions covering the fuel injection, starters, alternators, electronics, engine management, maintenance, test equipment, and vehicle diagnostics categories. The company is headquartered in Auburn Hills, MI.
Predefined Scans Triggered: New CCI Buy Signals, Moved Above Upper Bollinger Band and Moved Above Upper Price Channel.
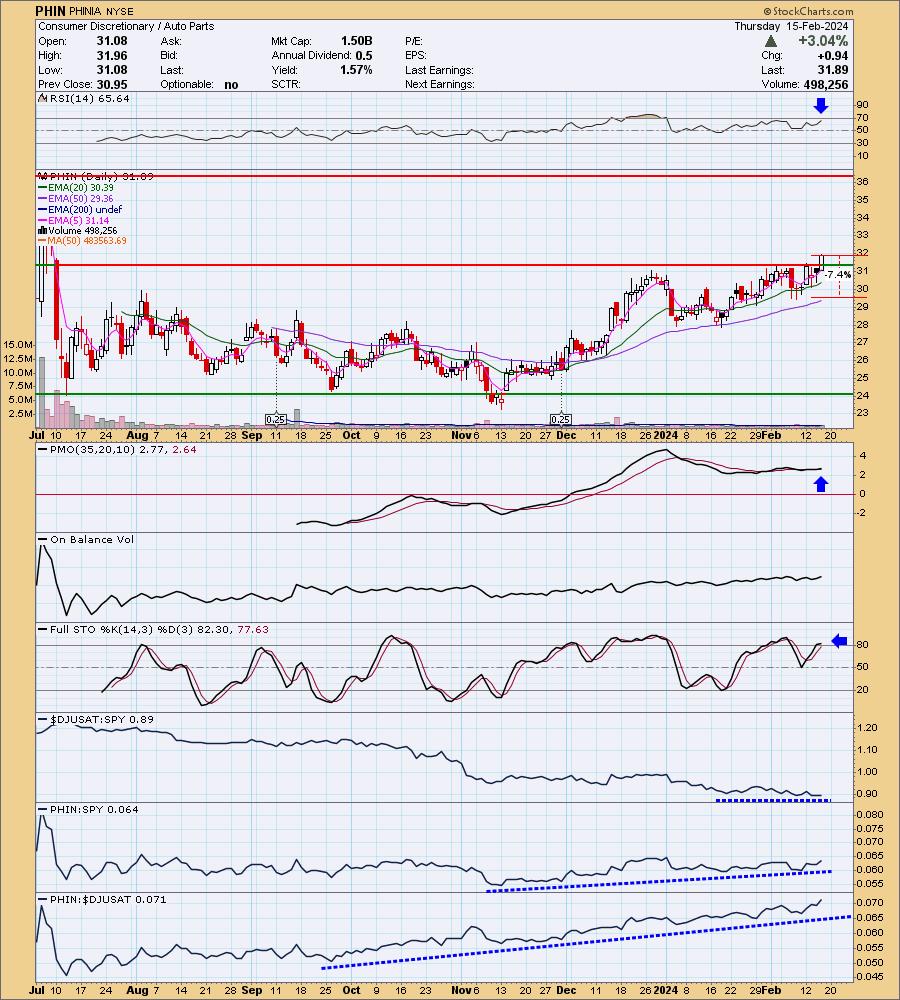
PHIN is unchanged in after hours trading. I liked today's breakout move. Overhead resistance is a mile away so there is plenty of upside potential. The PMO is flat above the zero line which implies strength. A flat PMO means we have a rally that is maintaining a steady rising trend. The PMO is on a Crossover BUY signal and the RSI is not overbought. Stochastics are above 80. I was surprised to see the group not outperforming, but if the scan results are right, we should see it begin to outperform soon. PHIN is showing considerable rising relative strength and that was the reason I picked it over the other Auto Parts stocks that I saw. The stop is set at the 50-day EMA or $29.53.
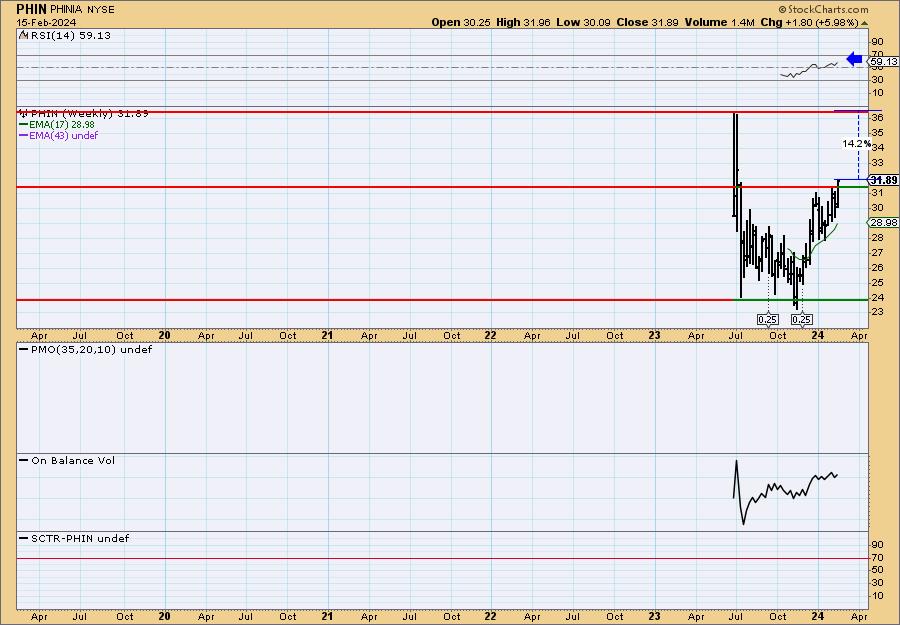
There isn't enough data to have a weekly PMO yet, but we do see that the weekly RSI is in positive territory and not overbought. The OBV is rising to confirm the rally. I think you'll see an eventual breakout.
Don't forget, on Thursdays I look at reader-requested symbols, click HERE to send me an email. I read every email I receive and try to answer them all!
Current Market Outlook:
Market Environment: It is important to consider the odds for success by assessing the market tides. The following chart uses different methodologies for objectively showing the depth and trend of participation for intermediate- and long-term time frames.
- The Silver Cross Index (SCI) shows the percentage of SPX stocks on IT Trend Model BUY signals (20-EMA > 50-EMA)
- The Golden Cross Index (GCI) shows the percentage of SPX stocks on LT Trend Model BUY signals (50-EMA > 200-EMA)
Don't forget that as a "Diamonds" member, you have access to our GCI/SCI curated ChartList on DecisionPoint.com. You'll find it under "Members Only" links on the left side on the Blogs and Links Page.
Here is the current chart:
Full Disclosure: I am 70% long, 0% short.
I'm required to disclose if I currently own a stock I mention and/or may buy/short it within the next 72 hours.
"Technical Analysis is a windsock, not a crystal ball." - Carl Swenlin
(c) Copyright 2024 DecisionPoint.com
Watch the latest episode of DecisionPoint Trading Room with Carl & Erin Swenlin Mondays on the DecisionPoint YouTube channel here!
NOTE: The stocks reported herein are from mechanical trading model scans that are based upon moving average relationships, momentum and volume. DecisionPoint analysis is then applied to get five selections from the scans. The selections given should prompt readers to do a chart review using their own analysis process. This letter is not a call for a specific action to buy, sell or short any of the stocks provided. There are NO sure things or guaranteed returns on the daily selection of "Diamonds in the Rough."
Regarding BUY/SELL Signals: The signal status reported herein is based upon mechanical trading model signals and crossovers. They define the implied bias of the price index/stock based upon moving average relationships and momentum, but they do not necessarily call for a specific action. They are information flags that should prompt chart review. Further, they do not call for continuous buying or selling during the life of the signal. For example, a BUY signal will probably (but not necessarily) return the best results if action is taken soon after the signal is generated. Additional opportunities for buying may be found as price zigzags higher, but the trader must look for optimum entry points. Conversely, exit points to preserve gains (or minimize losses) may be evident before the model mechanically closes the signal.
Helpful DecisionPoint Links:
Price Momentum Oscillator (PMO)
Swenlin Trading Oscillators (STO-B and STO-V)
For more links, go to DecisionPoint.com