
The scans did produce today. The themes I found present were in Technology as a whole with Software and Computer Services seeing some play. We also had a return theme from the Food Products industry group.
Cal-Maine (CALM) was a prior "Diamond in the Rough" from the Food Products industry group. The chart is worth a revisit. It hasn't done much since it was picked on 2/20, but given Food Products did make an appearance today, it may be worth another look.
Not much more to say! Enjoy the current rally!
Good Luck & Good Trading,
Erin
Today's "Diamonds in the Rough": ADBE, ALLY, PSX and RNR.
Runner-ups: CALM, THS, DFS, EHC, IBM, IT and PBF.

RECORDING & DOWNLOAD LINK (3/8/2024):
Topic: DecisionPoint Diamond Mine (3/8/2024) LIVE Trading Room
Recording & Download LINK
Passcode: March#8th
REGISTRATION for 3/15/2024:
When: Mar 15, 2024 09:00 AM Pacific Time (US and Canada)
Topic: DecisionPoint Diamond Mine (3/15/2024) LIVE Trading Room
Register in advance for this webinar HERE
After registering, you will receive a confirmation email containing information about joining the webinar.

Here is the latest recording from 3/11. Click HERE to subscribe to the DecisionPoint YouTube Channel to be notified when new content is available.
Welcome to DecisionPoint Diamonds, wherein I highlight ten "Diamonds in the Rough" per week. These are selected from the results of my DecisionPoint Scans which search for stocks that could benefit from the trend and condition of the market. Remember, these are not recommendations to buy or sell, but are the most interesting of the stocks that surfaced in my scans. My objective is to save you the work of the initial, tedious culling process, but you need to apply your own analysis to see if these stocks pique your interest as well. There are no guaranteed winners here!
"Predefined Scans Triggered" are taken from StockCharts.com using the "Symbol Summary" option instead of a "SharpChart" on the workbench.
Stop levels are all rounded down.
Adobe Systems, Inc. (ADBE)
EARNINGS: 03/14/2024 (AMC) ** Reports on Thursday! **
Adobe, Inc. engages in the provision of digital marketing and media solutions. It operates through the following segments: Digital Media, Digital Experience, and Publishing and Advertising. The Digital Media segment offers creative cloud services, which allow members to download and install the latest versions of products, such as Adobe Photoshop, Adobe Illustrator, Adobe Premiere Pro, Adobe Photoshop Lightroom and Adobe InDesign, as well as utilize other tools, such as Adobe Acrobat. The Digital Experience segment provides solutions, including analytics, social marketing, targeting, media optimization, digital experience management, and cross-channel campaign management, as well as premium video delivery and monetization. The Publishing and Advertising segment includes legacy products and services for eLearning solutions, technical document publishing, web application development, and high-end printing. The company was founded by Charles M. Geschke and John E. Warnock in December 1982 and is headquartered in San Jose, CA.
Predefined Scans Triggered: None.
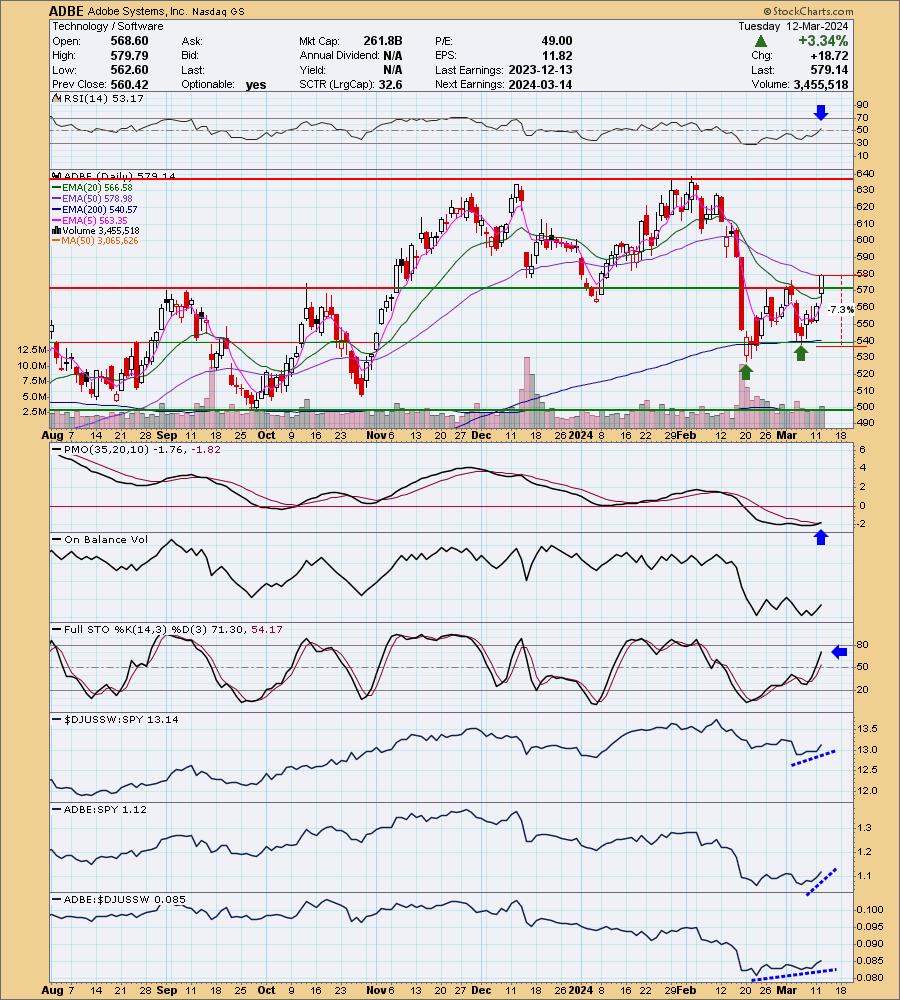
ADBE is up +0.18% in after hours trading. This is a beautiful double bottom setup. Today's breakout confirmed the pattern. The minimum upside target of the pattern would be around $610. Note it is the "minimum" upside target. They do report on Thursday which is a bother, but this looks pretty good to take the chance. Price also closed above the 50-day EMA. The RSI just moved into positive territory and there is a brand new PMO Crossover BUY Signal. Stochastics are rising toward 80 in positive territory. The group is beginning to outperform again and ADBE is outperforming the group. The stop is set beneath support at 7.3% or $536.86.
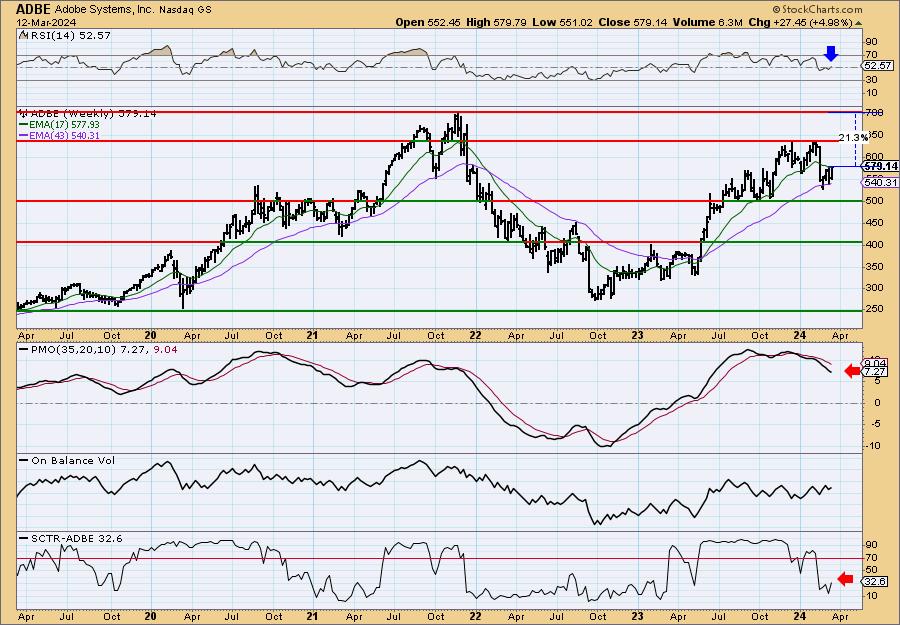
The weekly chart needs help so consider this a short-term timeframe trade not an intermediate-term investment. The weekly RSI did reach positive territory, but the weekly PMO is still declining on a Crossover SELL Signal. The StockCharts Technical Rank (SCTR) is well outside the hot zone* above 70. If it does get going in the intermediate term, I've set an upside target around 21%.
*If a stock is in the "hot zone" above 70, it implies that it is stronger than 70% of its universe (large-, mid-, small-caps and ETFs) primarily in the intermediate to long terms.
Ally Financial Inc. (ALLY)
EARNINGS: 04/17/2024 (BMO)
Ally Financial, Inc. engages in the provision of online banking, securities brokerage, and investment advisory services. It operates through the following segments: Automotive Finance Operations, Insurance Operations, Mortgage Finance Operations, Corporate Finance Operations, and Corporate and Other. The Automotive Finance Operations segment offers retail installment sales contracts, loans, and operating leases, offering term loans to dealers, financing dealer floor plans and other lines of credit to dealers, warehouse lines to automotive retailers, fleet financing, providing financing to companies and municipalities for the purchase or lease of vehicles, and vehicle-remarketing services. The Insurance Operations segment focuses on consumer financial and insurance products such as vehicle service and vehicle maintenance contracts, and guaranteed asset protection. The Mortgage Finance Operations segment includes Ally Home Mortgage (ALM) offering and bulk purchases of high-quality jumbo and low-to-moderate income mortgage loans. The Corporate Finance Operations segment provides senior secured leveraged asset-based and cash flow loans to middle-market companies, with a focus on businesses owned by private equity sponsors. The Corporate and Other segment is involved in centralized corporate treasury activities such as management of the cash and corporate investment securities and loan portfolios, short- and long-term debt, retail and brokered deposit liabilities, derivative instruments, original issue discount, and the residual impacts of corporate funds-transfer pricing and treasury ALM activities. The company was founded in 1919 and is headquartered in Detroit, MI.
Predefined Scans Triggered: New 52-week Highs, Moved Above Upper Bollinger Band, Moved Above Upper Price Channel and P&F Double Top Breakout.
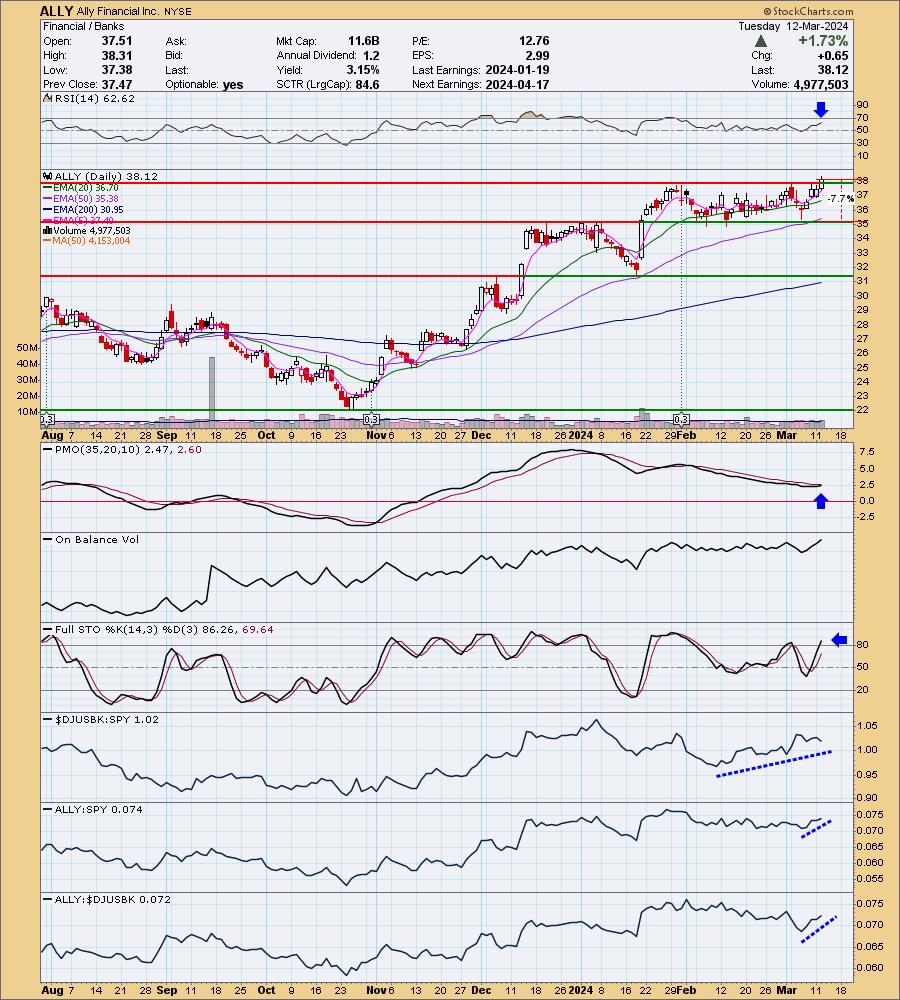
ALLY is up +0.16% in after hours trading. I like the breakout from the trading range. Looks like it is ready for the next leg up. The RSI is positive and not overbought. There is an imminent PMO Crossover BUY Signal and Stochastics are above 80. Relative strength is quite good for the Banks and ALLY is showing new leadership within the group. It's also beginning to outperform the SPY. I've set the stop beneath support at 7.7% or $35.18.
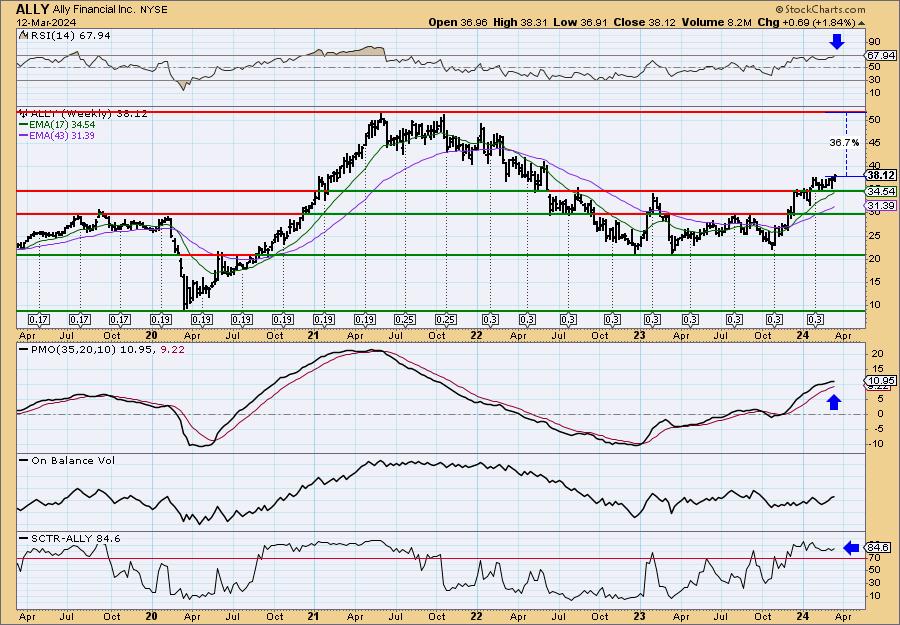
The weekly chart is favorable enough to consider this one in the intermediate-term timeframe. The weekly RSI is positive and not overbought. The weekly PMO is rising on a Crossover BUY Signal and the SCTR is in the hot zone. My upside target would take price to 2021 highs at 36.7%.
Phillips 66 (PSX)
EARNINGS: 05/01/2024 (BMO)
Phillips 66 engages in the processing, transportation, storage, and marketing of fuels and other related products. The company operates through the following segments: Midstream, Chemicals, Refining and Marketing & Specialties. The Midstream segment provides crude oil and refined products transportation, terminaling and processing services, as well as natural gas, natural gas liquids and liquefied petroleum gas transportation, storage, processing and marketing services. The Chemicals segment produces and markets petrochemicals and plastics on a worldwide basis. The Refining segment Refines crude oil and other feedstocks into petroleum products such as gasoline, distillates and aviation fuels. The Marketing and Specialties segment purchases for resale and markets refined petroleum products such as base oils and lubricants, as well as power generation operations. The company was founded in 1875 and is headquartered in Houston, TX.
Predefined Scans Triggered: New 52-week Highs.
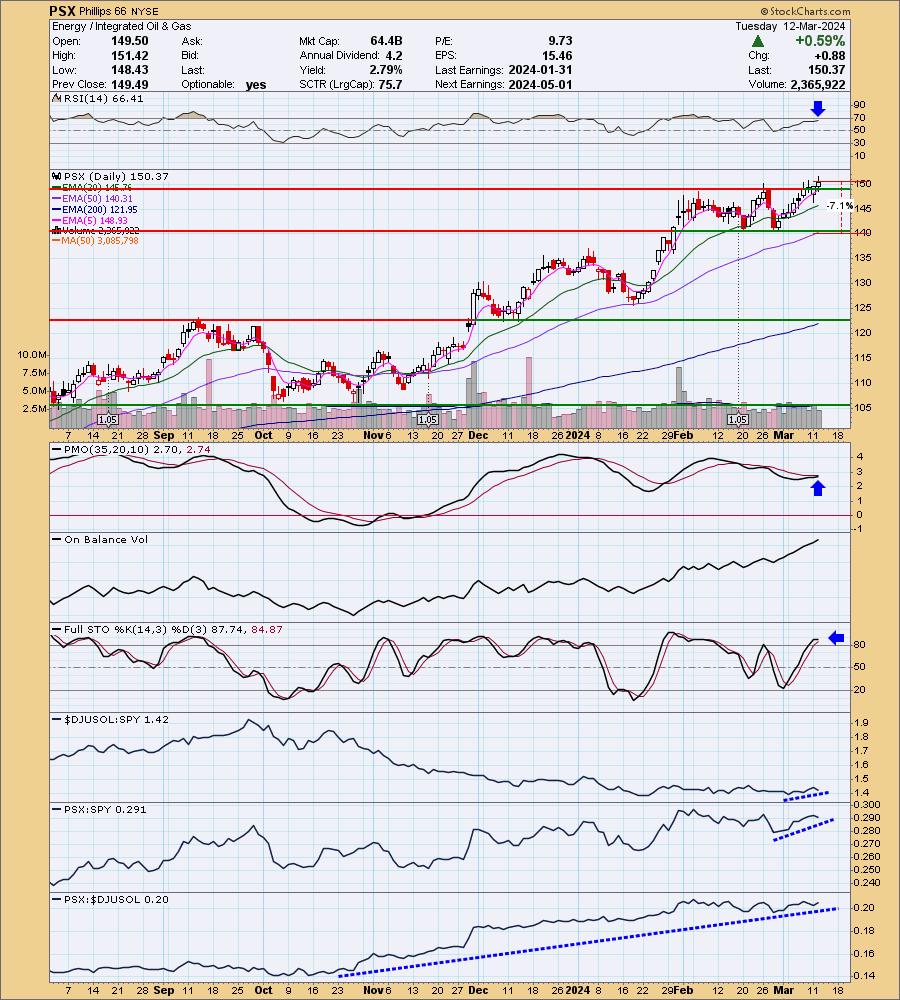
PSX is unchanged in after hours trading. I like the breakout from the previous trading range. Crude isn't doing much right now, but that hasn't stopped PSX from rallying consistently all month. The RSI is not overbought and there is a pending PMO Crossover BUY Signal. Stochastics have moved above 80 and relative strength is picking up for the group and PSX. The stop is set beneath support at 7.1% or $139.69.
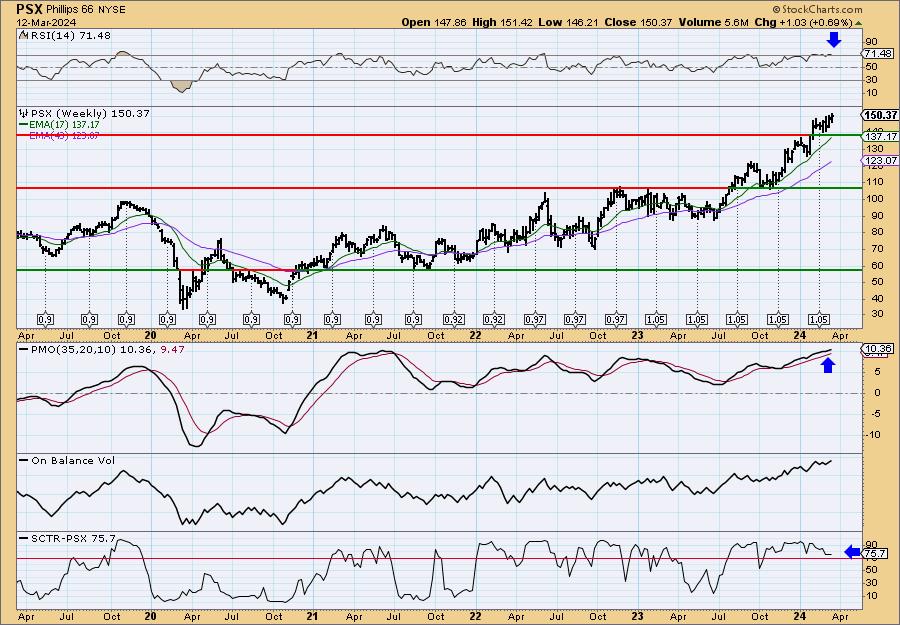
The weekly chart is very positive and suggests we could hold this one into the intermediate term. The weekly RSI is overbought, but it has been and we haven't seen any issues. The weekly PMO is rising strongly, though it is overbought. The SCTR is in the hot zone above 70.
Renaissance RE Holdings Ltd. (RNR)
EARNINGS: 04/30/2024 (AMC)
RenaissanceRe Holdings Ltd. engages in the provision of reinsurance and insurance services. It operates through the following business segments: Property, Casualty and Specialty, and Other. The Property segment focuses on catastrophe, and other property reinsurance and insurance. The Casualty and Specialty segment deals with casualty and specialty reinsurance, and insurance. The Other segment includes strategic investments, investments unit, corporate expense, capital servicing costs, and non-controlling interests. The company was founded by Neill Alexander Currie on June 7, 1993, and is headquartered in Pembroke, Bermuda.
Predefined Scans Triggered: New 52-week Highs, P&F Ascending Triple Top Breakout and P&F Double Top Breakout.
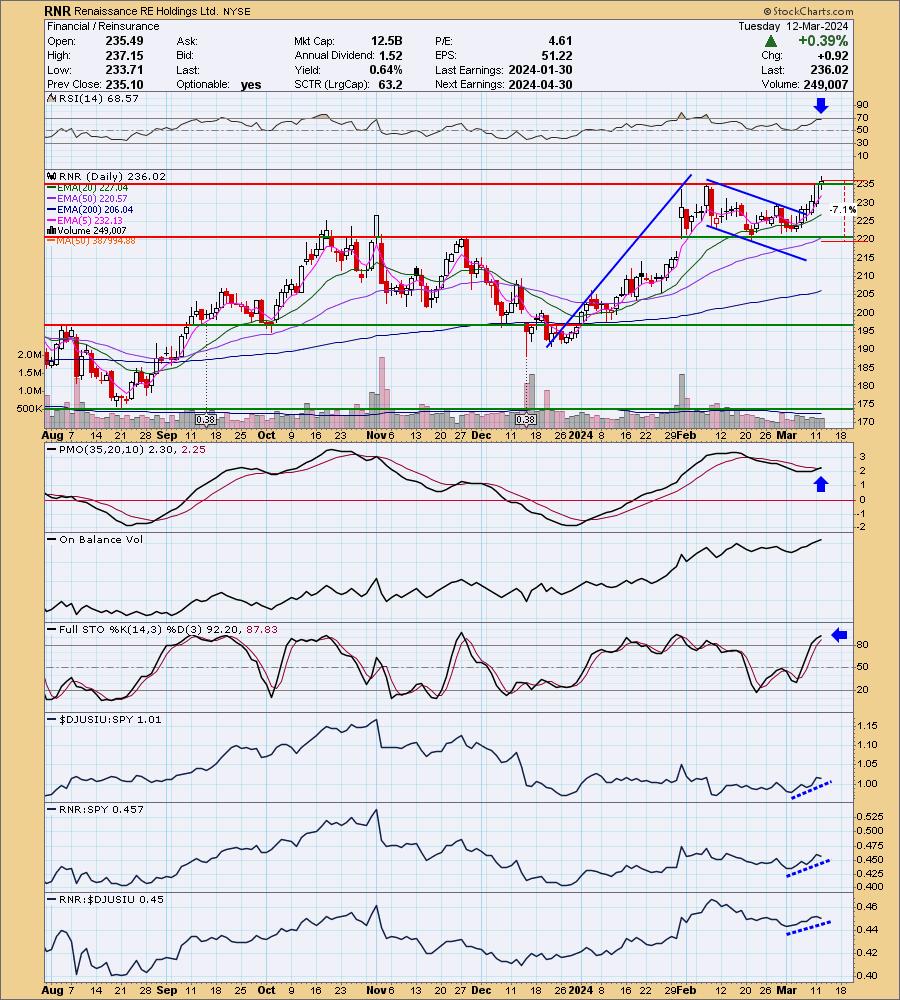
RNR is up +0.01% in after hours trading. We saw a breakout to new 52-week highs today that confirmed a large bullish flag formation that would suggest a minimum upside target of $280. The RSI is positive and not yet overbought. There is a new PMO Crossover BUY Signal and Stochastics are above 80. Relative strength is picking up as we like. I've set the stop beneath support at 7.1% or $219.26.
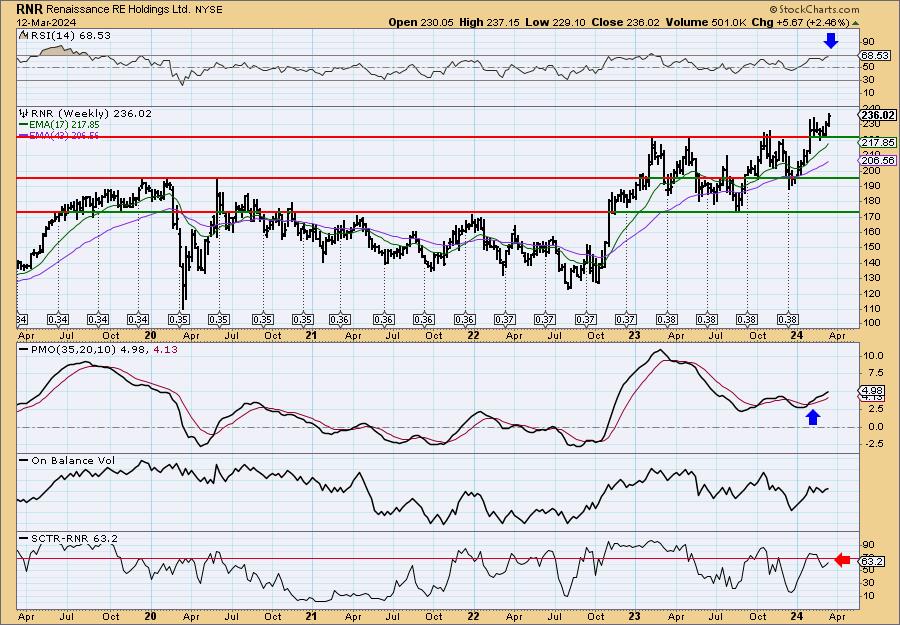
The weekly chart is favorable enough to consider this in the intermediate term. The weekly RSI is positive and not overbought. The weekly PMO is rising on a Crossover BUY Signal and is not overbought. The SCTR is outside the hot zone, but it is rising and could get in there soon. It's at an acceptable level for now.
Don't forget, on Thursdays I look at reader-requested symbols, click HERE to send me an email. I read every email I receive and try to answer them all!
Current Market Outlook:
Market Environment: It is important to consider the odds for success by assessing the market tides. The following chart uses different methodologies for objectively showing the depth and trend of participation for intermediate- and long-term time frames.
- The Silver Cross Index (SCI) shows the percentage of SPX stocks on IT Trend Model BUY signals (20-EMA > 50-EMA)
- The Golden Cross Index (GCI) shows the percentage of SPX stocks on LT Trend Model BUY signals (50-EMA > 200-EMA)
Don't forget that as a "Diamonds" member, you have access to our GCI/SCI curated ChartList on DecisionPoint.com. You'll find it under "Members Only" links on the left side on the Blogs and Links Page.
Here is the current chart:
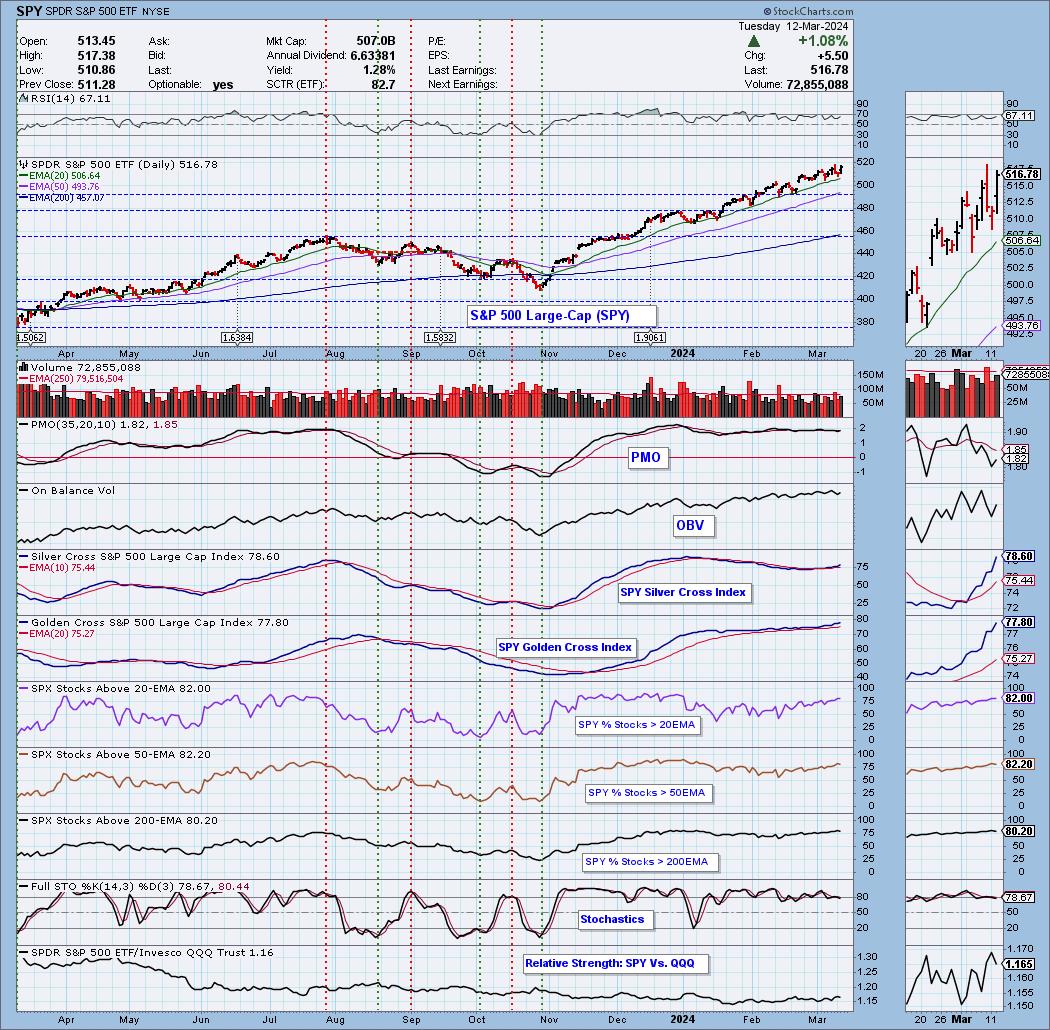
Full Disclosure: I am 75% long, 0% short. I added ALLY and ADBE today.
I'm required to disclose if I currently own a stock I mention and/or may buy/short it within the next 72 hours.
"Technical Analysis is a windsock, not a crystal ball." - Carl Swenlin
(c) Copyright 2024 DecisionPoint.com
Watch the latest episode of DecisionPoint Trading Room with Carl & Erin Swenlin Mondays on the DecisionPoint YouTube channel here!
NOTE: The stocks reported herein are from mechanical trading model scans that are based upon moving average relationships, momentum and volume. DecisionPoint analysis is then applied to get five selections from the scans. The selections given should prompt readers to do a chart review using their own analysis process. This letter is not a call for a specific action to buy, sell or short any of the stocks provided. There are NO sure things or guaranteed returns on the daily selection of "Diamonds in the Rough."
Regarding BUY/SELL Signals: The signal status reported herein is based upon mechanical trading model signals and crossovers. They define the implied bias of the price index/stock based upon moving average relationships and momentum, but they do not necessarily call for a specific action. They are information flags that should prompt chart review. Further, they do not call for continuous buying or selling during the life of the signal. For example, a BUY signal will probably (but not necessarily) return the best results if action is taken soon after the signal is generated. Additional opportunities for buying may be found as price zigzags higher, but the trader must look for optimum entry points. Conversely, exit points to preserve gains (or minimize losses) may be evident before the model mechanically closes the signal.
Helpful DecisionPoint Links:
Price Momentum Oscillator (PMO)
Swenlin Trading Oscillators (STO-B and STO-V)
For more links, go to DecisionPoint.com