
The market is continuing to climb higher, but if my scans are any indication, it is quite vulnerable to decline right now. Scans will usually produce upwards to 100 stocks or more when the market is clicking. I notice that the results tighten up near market turns. The PMO Bullish Crossover Scan was the most productive, handing me over 50 results to review while the other scans only saw a handful of results.
I'll be writing about Energy in the DP Alert today. There is a large bull flag forming and participation under the surface is improving somewhat, overall it isn't that bad considering the declining trend channel that makes up the flag had price retreating quite a bit. I found two Energy stocks for you today that are already doing well, but an upswing in that sector could mean even more upside for them.
The other two today are Industrials. I didn't see a theme regarding this sector, but I did like the two "Diamonds in the Rough".
Keep your stops in play and be careful extending yourself too much given the market could finally swing lower.
Good Luck & Good Trading,
Erin
Today's "Diamonds in the Rough": CAT, CRK, GNRC and OKE.
Runners-up: MU, IBKR, EQT and AA.

RECORDING & DOWNLOAD LINK (5/10/2024):
Topic: DecisionPoint Diamond Mine (5/10/2024) LIVE Trading Room
Recording & Download Link HERE
Passcode: May#10th
REGISTRATION for 5/17/2024:
When: May 17, 2024 09:00 AM Pacific Time (US and Canada)
Topic: DecisionPoint Diamond Mine (5/17/2024) LIVE Trading Room
Register in advance for this webinar HERE
After registering, you will receive a confirmation email containing information about joining the webinar.

Here is the latest recording from 5/13. Click HERE to subscribe to the DecisionPoint YouTube Channel to be notified when new content is available.
Welcome to DecisionPoint Diamonds, wherein I highlight ten "Diamonds in the Rough" per week. These are selected from the results of my DecisionPoint Scans which search for stocks that could benefit from the trend and condition of the market. Remember, these are not recommendations to buy or sell, but are the most interesting of the stocks that surfaced in my scans. My objective is to save you the work of the initial, tedious culling process, but you need to apply your own analysis to see if these stocks pique your interest as well. There are no guaranteed winners here!
"Predefined Scans Triggered" are taken from StockCharts.com using the "Symbol Summary" option instead of a "SharpChart" on the workbench.
Stop levels are all rounded down.
Caterpillar, Inc. (CAT)
EARNINGS: 07/30/2024 (BMO)
Caterpillar, Inc. engages in the business of manufacturing construction and mining equipment, off-highway diesel and natural gas engines, industrial gas turbines, and diesel-electric locomotives. It operates through the following segments: Construction Industries, Resource Industries, Energy and Transportation, Financial Products, and All Other. The Construction Industries segment is involved in supporting customers using machinery in infrastructure and building construction applications. The Resource Industries segment offers machinery in mining, heavy construction, quarry, and aggregates. The Energy and Transportation segment focuses on reciprocating engines, turbines, diesel-electric locomotives, and related services across industries serving oil and gas, power generation, industrial, and transportation applications including marine- and rail-related businesses. The Financial Products segment provides financing alternatives to customers and dealers for Caterpillar products and services, as well as financing for power generation facilities. The All Other segment includes activities such as the business strategy, product management, and development, and manufacturing filters and fluids, undercarriage, tires and rims, engaging tools, and fluid transfers. The company was founded on April 15, 1925 and is headquartered in Irving, TX.
Predefined Scans Triggered: P&F Double Top Breakout.
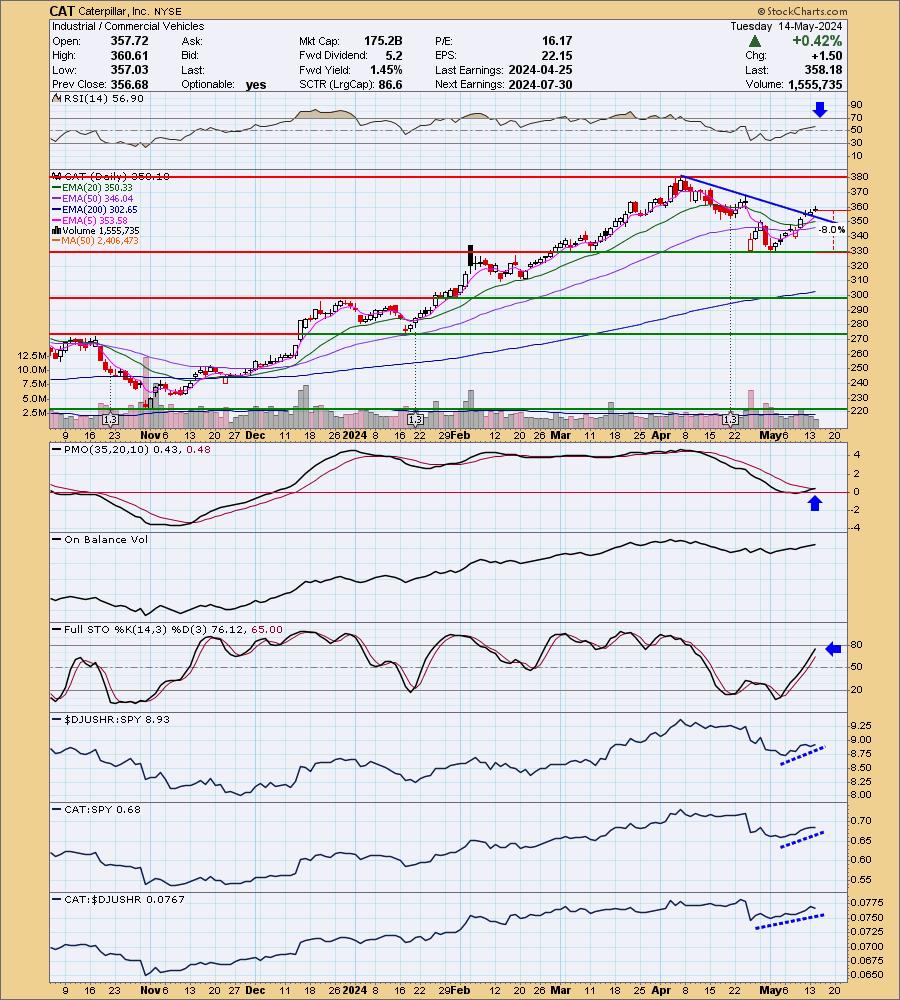
CAT is up +0.08% in after hours trading. We have a nice rally that has broken the short-term declining trend. The RSI is in positive territory and is not at all overbought yet. The PMO has triggered a Crossover BUY Signal above the zero line. Stochastics are rising strongly and relative strength studies show all in rising trends. I hated to set the stop so deep, but given the support level it really is the right place for it. I've set it at 8% or $329.52.
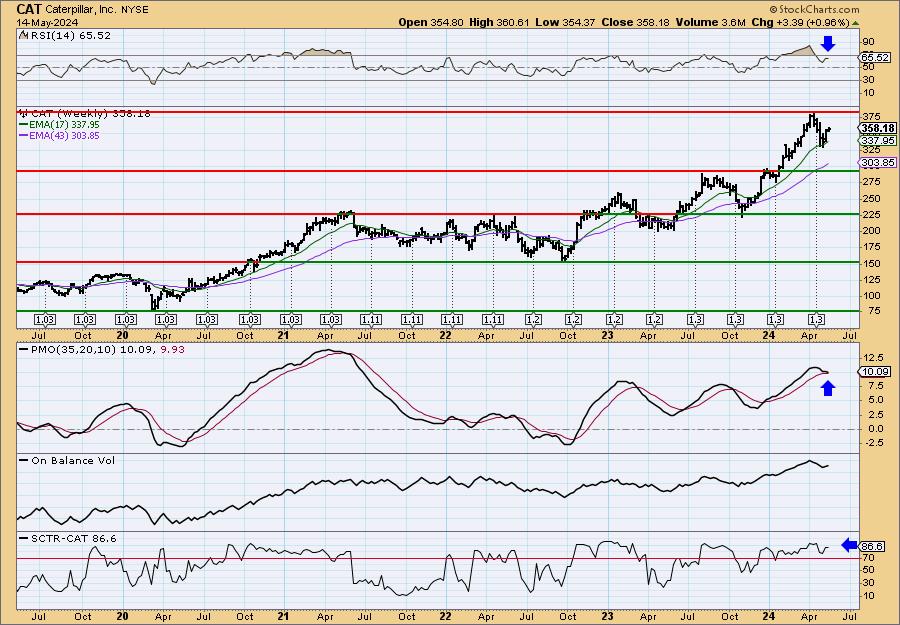
We have a textbook bull flag on the weekly chart that implies a breakout ahead. The weekly RSI is positive and the StockCharts Technical Rank (SCTR) is in the hot zone* above 70. The weekly PMO is near a Crossover SELL Signal after the recent decline, but it is already trying to turn back up. Consider a 17% upside target to $419.07.
*If a stock is in the "hot zone" above 70, it implies that it is stronger than 70% of its universe (large-, mid-, small-caps and ETFs) primarily in the intermediate to long terms.
Comstock Resources, Inc. (CRK)
EARNINGS: 07/29/2024 (AMC)
Comstock Resources, Inc. engages in the acquisition, development, and exploration of oil and natural gas. The firm operations concentrated in the Haynesville shale, a premier natural gas basin located in East Texas. The company was founded in 1919 and is headquartered in Frisco, TX.
Predefined Scans Triggered: New CCI Buy Signals, Moved Above Upper Price Channel and P&F Low Pole.
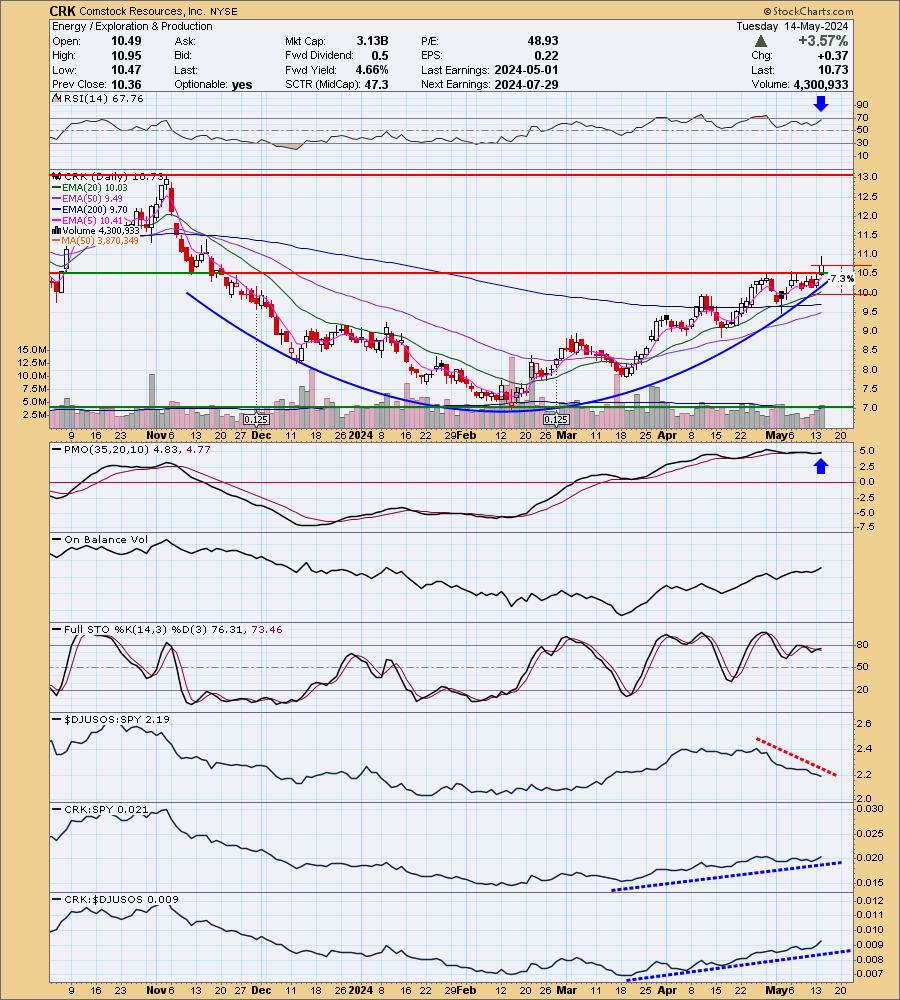
CRK is up +0.28% in after hours trading. What caught my eye was the beautiful cup shaped basing pattern that it has built. Price is breaking out from here. The RSI is positive and not yet overbought. The PMO has just triggered a Crossover BUY Signal and is flat above the zero line implying pure strength. Stochastics don't look great, but they are rising and are seated in positive territory. The industry group is clearly underperforming, but CRK is doing just fine against the SPY. I've set the stop below the 20-day EMA at 7.3% or $9.94.
I like the small breakout on the weekly chart. We also have a positive and not overbought weekly RSI and the weekly PMO just hit positive territory while on a Crossover BUY Signal. The SCTR is not in the hot zone, but it is rising quickly now and I'll take that. I've marked upside potential to the next level of overhead resistance.

Generac Holdings Inc. (GNRC)
EARNINGS: 07/31/2024 (BMO)
Generac Holdings, Inc. engages in the business of designing and manufacturing energy technology solutions. It operates under the Domestic and International segments. The Domestic segment includes the legacy Generac business and the acquisitions that are based in the United States and Canada. The International segment focuses on Generac business' Latin American export operations. The company was founded in 1959 and is headquartered in Waukesha, WI.
Predefined Scans Triggered: P&F Double Top Breakout.
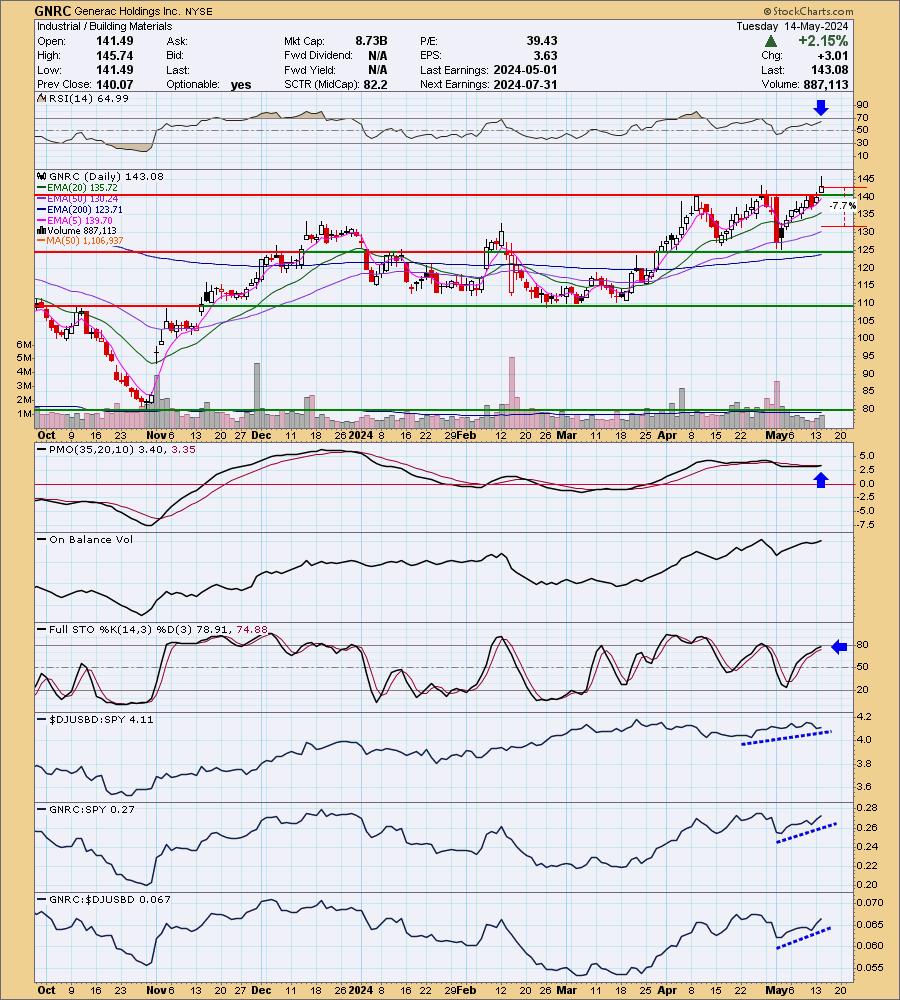
GNRC is down -0.76% in after hours trading. Today's breakout is what guided my eyes to this chart. That and the flat PMO well above the zero line which indicates pure strength. The RSI is positive and not overbought yet. Stochastics are rising and are near 80. Relative strength is rising for the group and we also see relative strength continuing to build for GNRC against the group and the SPY. The stop is set near the 50-day EMA at 7.7% or $132.06.
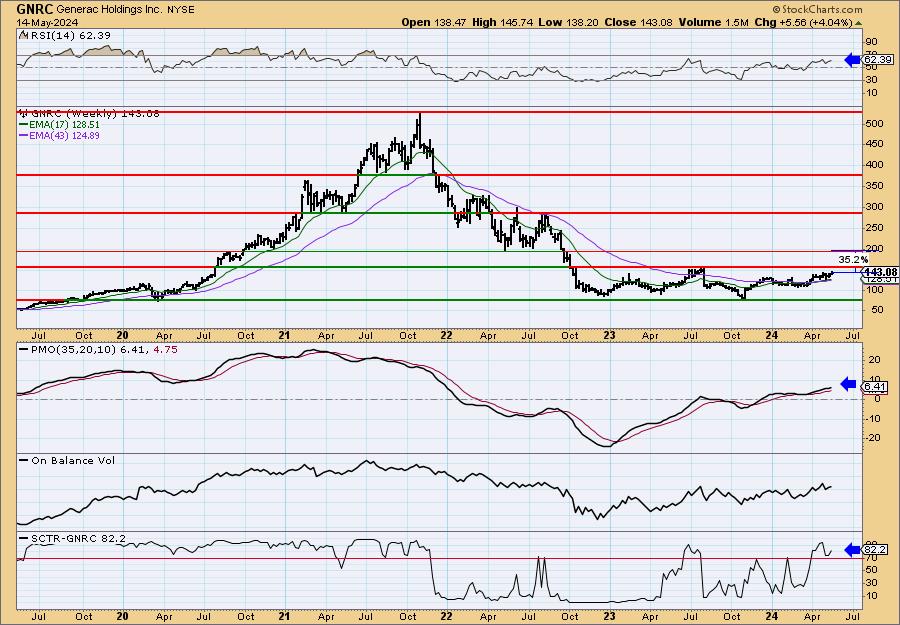
The weekly chart is bullish. I do see that overhead resistance is arriving and could be a problem. However, the indicators suggest we will see a breakout. The weekly RSI is positive and not overbought. The weekly PMO is rising above the zero line on a Crossover BUY Signal. The SCTR is in the hot zone. Upside potential is great should we get the breakout.
Oneok, Inc. (OKE)
EARNINGS: 08/05/2024 (AMC)
ONEOK, Inc. engages in gathering, processing, fractionating, transporting, storing and marketing of natural gas. It operates through the following segments: Natural Gas Gathering and Processing, Natural Gas Liquids and Natural Gas Pipelines. The Natural Gas Gathering and Processing segment offers midstream services to producers in North Dakota, Montana, Wyoming, Kansas and Oklahoma. The Natural Gas Liquids segment owns and operates facilities that gather, fractionate, treat and distribute NGLs and store NGL products, in Oklahoma, Kansas, Texas, New Mexico and the Rocky Mountain region, which includes the Williston, Powder River and DJ Basins, where it provides midstream services to producers of NGLs and deliver those products to the two market centers, one in the Mid-Continent in Conway, Kansas and the other in the Gulf Coast in Mont Belvieu, Texas. The Natural Gas Pipelines segment provides transportation and storage services to end users. The company was founded in 1906 and is headquartered in Tulsa, OK.
Predefined Scans Triggered: New 52-week Highs, Moved Above Upper Price Channel, P&F Ascending Triple Top Breakout and P&F Double Top Breakout.
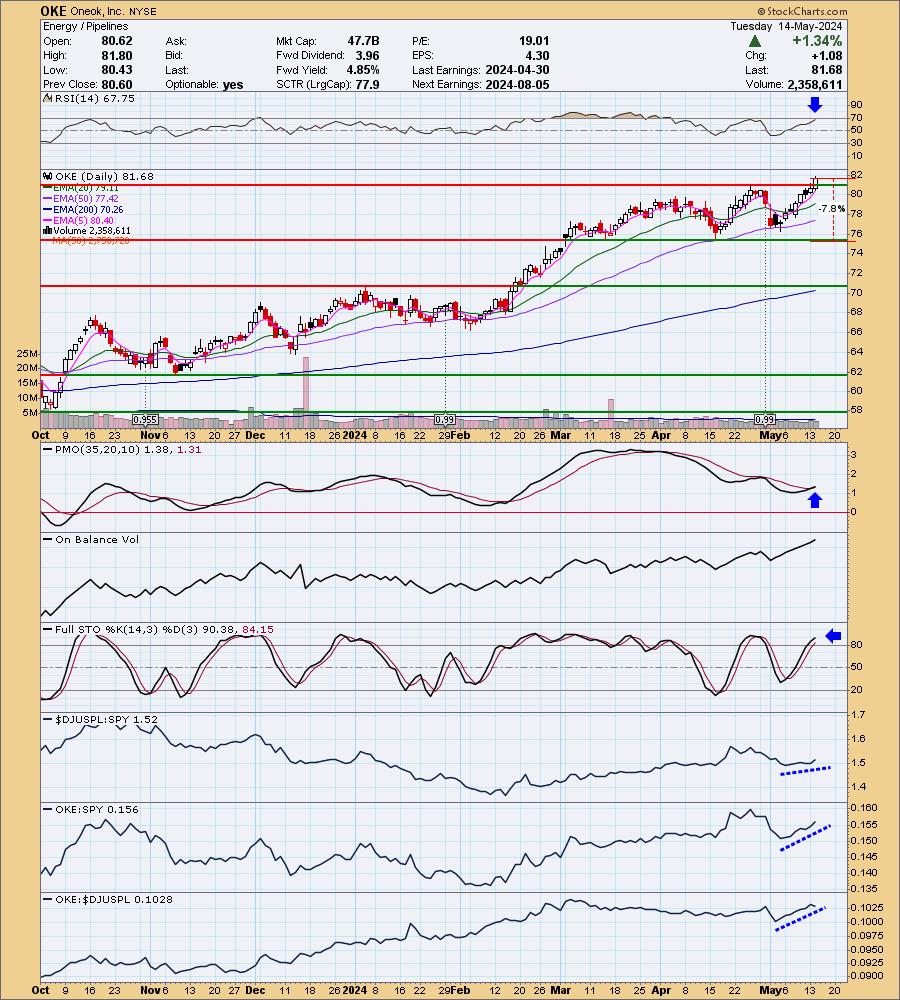
OKE is unchanged in after hours trading. I really liked today's breakout move combined with the positive indicators. The RSI is not quite overbought yet. The PMO is on a new Crossover BUY Signal. Look at the OBV marching higher, confirming the rally. Stochastics are above 80 and rising. Relative strength for this Energy group has been alright considering the sector itself has had tough times of late. This one is a leader within the group based on rising relative strength against the group so consequently it is outperforming the SPY too. The stop is set beneath support at 7.8% or $75.30.
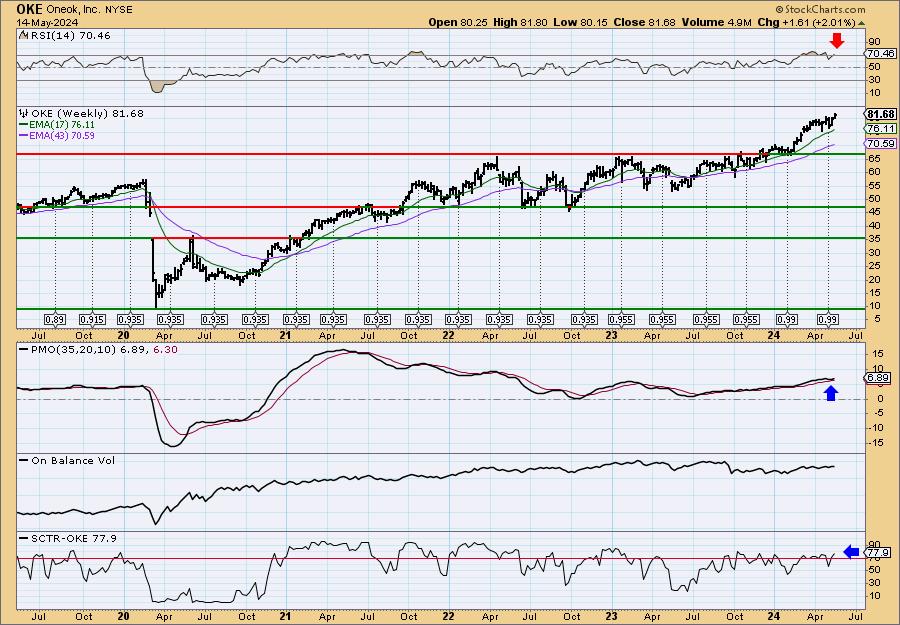
The one problem with the weekly chart is the overbought weekly RSI. However, we do see that of late this condition hasn't been a big problem. The weekly PMO has surged above the signal line and the SCTR is in the hot zone. Consider a 17% upside target around $95.57.
Don't forget, on Thursdays I look at reader-requested symbols, click HERE to send me an email. I read every email I receive and try to answer them all!
Current Market Outlook:
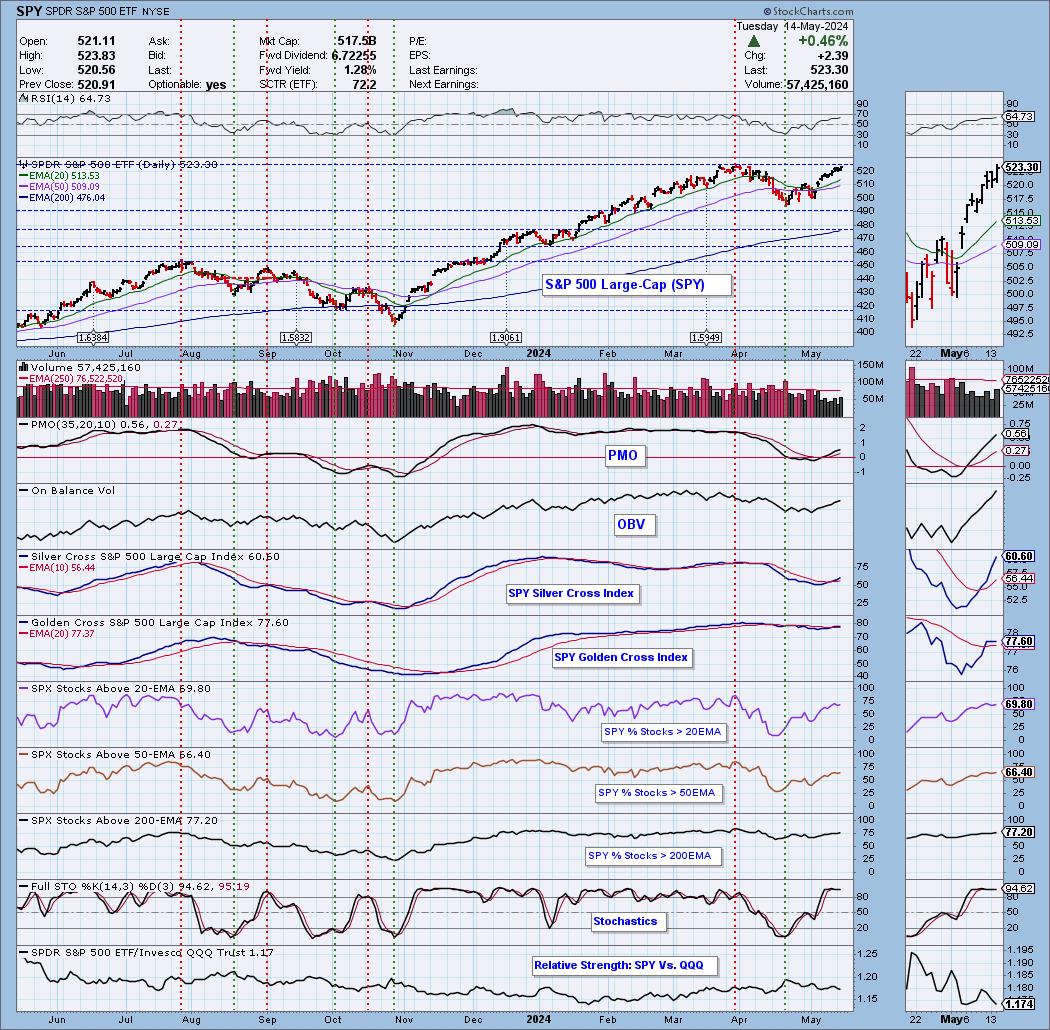
Market Environment: It is important to consider the odds for success by assessing the market tides. The following chart uses different methodologies for objectively showing the depth and trend of participation for intermediate- and long-term time frames.
- The Silver Cross Index (SCI) shows the percentage of SPX stocks on IT Trend Model BUY signals (20-EMA > 50-EMA)
- The Golden Cross Index (GCI) shows the percentage of SPX stocks on LT Trend Model BUY signals (50-EMA > 200-EMA)
Don't forget that as a "Diamonds" member, you have access to our GCI/SCI curated ChartList on DecisionPoint.com. You'll find it under "Members Only" links on the left side on the Blogs and Links Page.
Here is the current chart:
Full Disclosure: I am 40% long, 0% short. I like all four of these for an add, but still hesitating to add exposure.
I'm required to disclose if I currently own a stock I mention and/or may buy/short it within the next 72 hours.
"Technical Analysis is a windsock, not a crystal ball." - Carl Swenlin
(c) Copyright 2024 DecisionPoint.com
Watch the latest episode of DecisionPoint Trading Room with Carl & Erin Swenlin Mondays on the DecisionPoint YouTube channel here!
NOTE: The stocks reported herein are from mechanical trading model scans that are based upon moving average relationships, momentum and volume. DecisionPoint analysis is then applied to get five selections from the scans. The selections given should prompt readers to do a chart review using their own analysis process. This letter is not a call for a specific action to buy, sell or short any of the stocks provided. There are NO sure things or guaranteed returns on the daily selection of "Diamonds in the Rough."
Regarding BUY/SELL Signals: The signal status reported herein is based upon mechanical trading model signals and crossovers. They define the implied bias of the price index/stock based upon moving average relationships and momentum, but they do not necessarily call for a specific action. They are information flags that should prompt chart review. Further, they do not call for continuous buying or selling during the life of the signal. For example, a BUY signal will probably (but not necessarily) return the best results if action is taken soon after the signal is generated. Additional opportunities for buying may be found as price zigzags higher, but the trader must look for optimum entry points. Conversely, exit points to preserve gains (or minimize losses) may be evident before the model mechanically closes the signal.
Helpful DecisionPoint Links:
Price Momentum Oscillator (PMO)
Swenlin Trading Oscillators (STO-B and STO-V)
For more links, go to DecisionPoint.com