
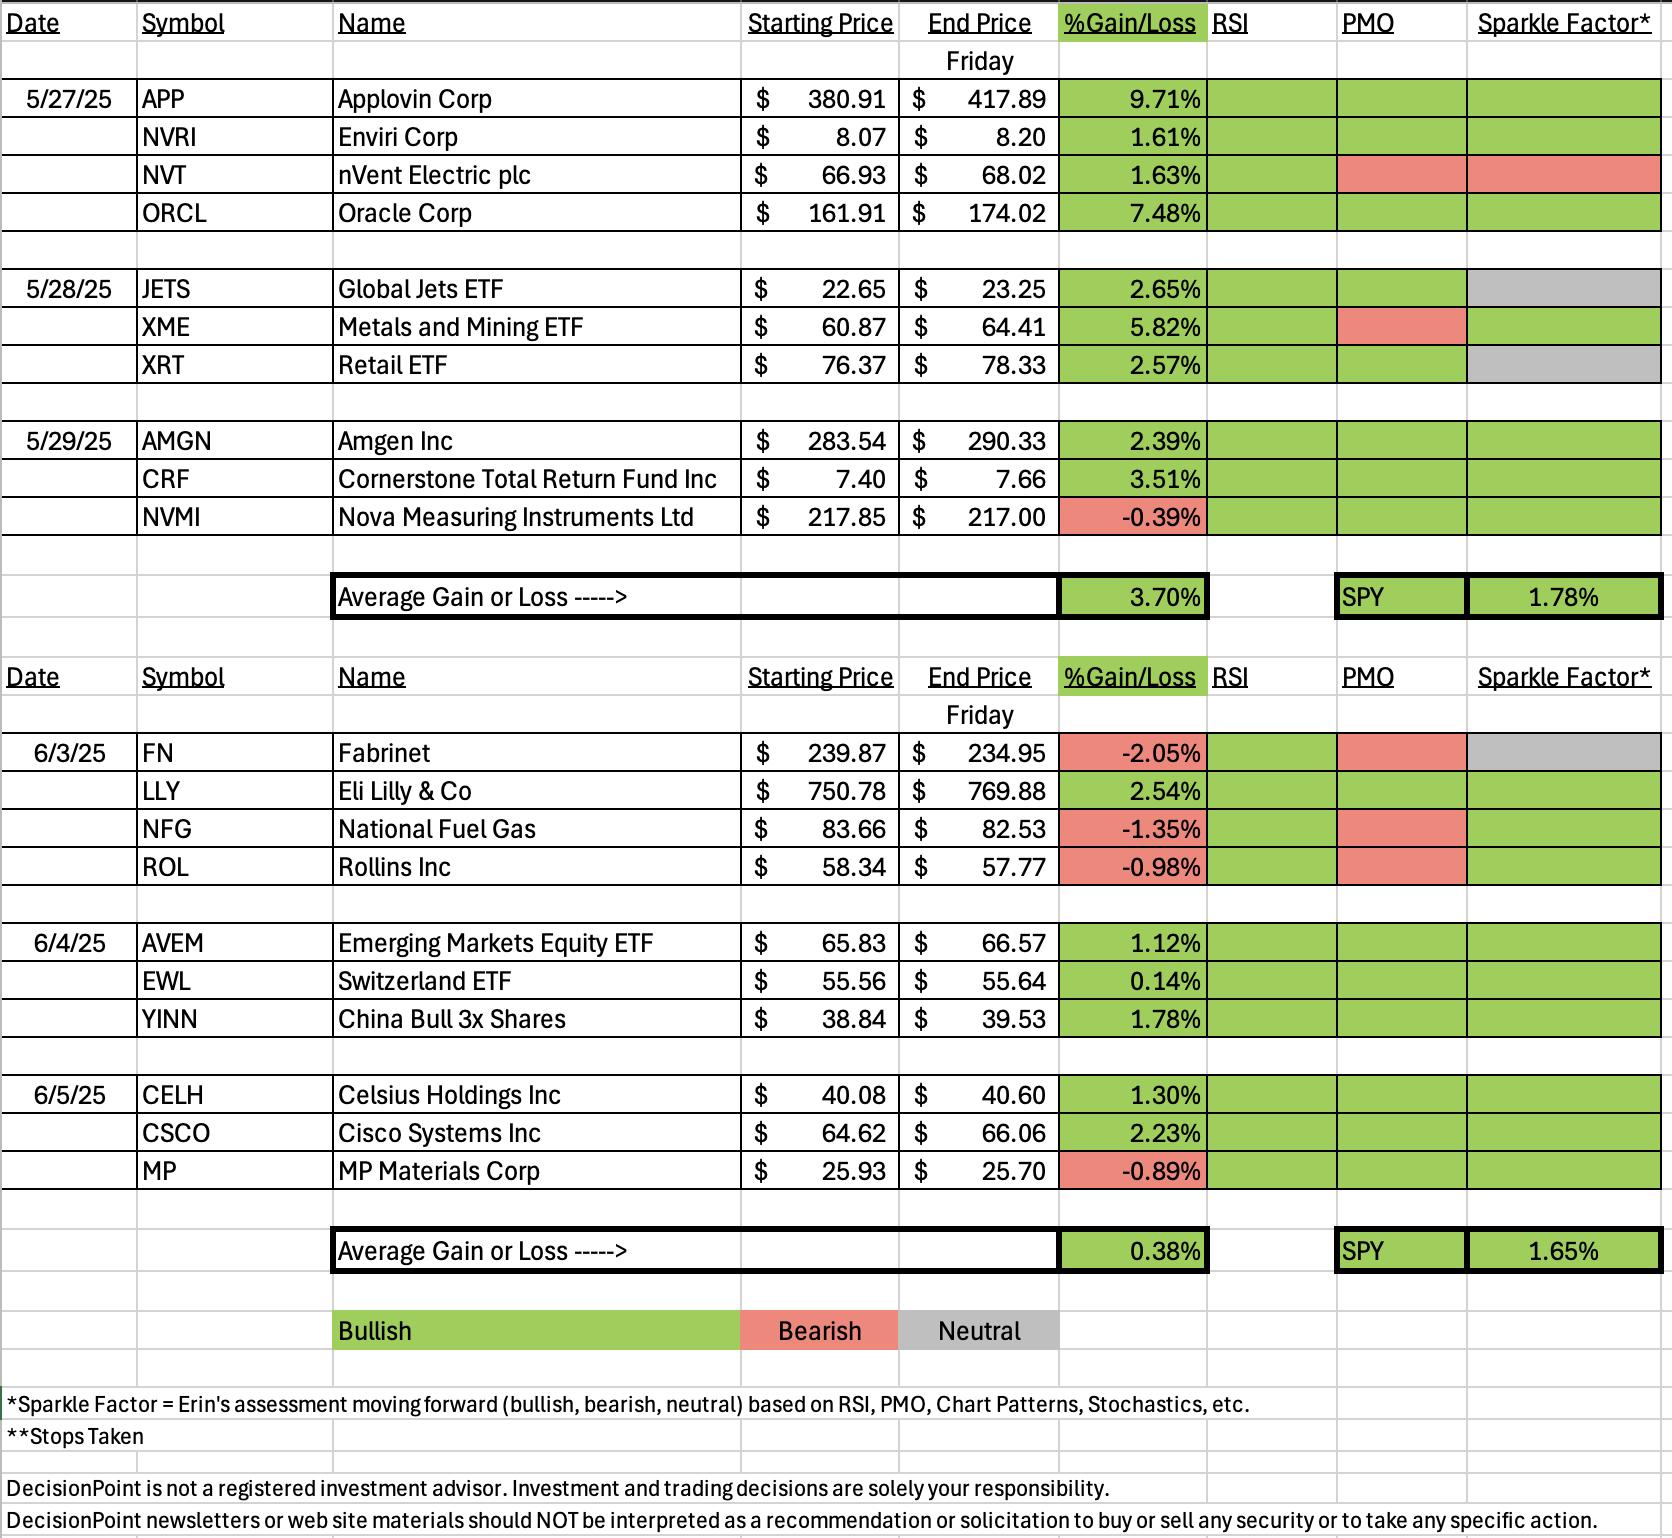
As I updated the spreadsheet this week I was pleased to see last week really shaping up. Nine of the ten stocks/ETFs are up with some up quite a bit. This week also saw the majority of "Diamonds in the Rough" in the green. I have a feeling they will mature well too. The market doesn't seem that interested in declining right now and that will have a positive effect.
The "Darling" this week was Eli Lilly (LLY) which was up 2.54% since being picked on Tuesday. The "Dud" was Fabrinet (FN) which was down -2.05% since being picked on Tuesday. We'll review these charts and determine why one was successful and the other was not.
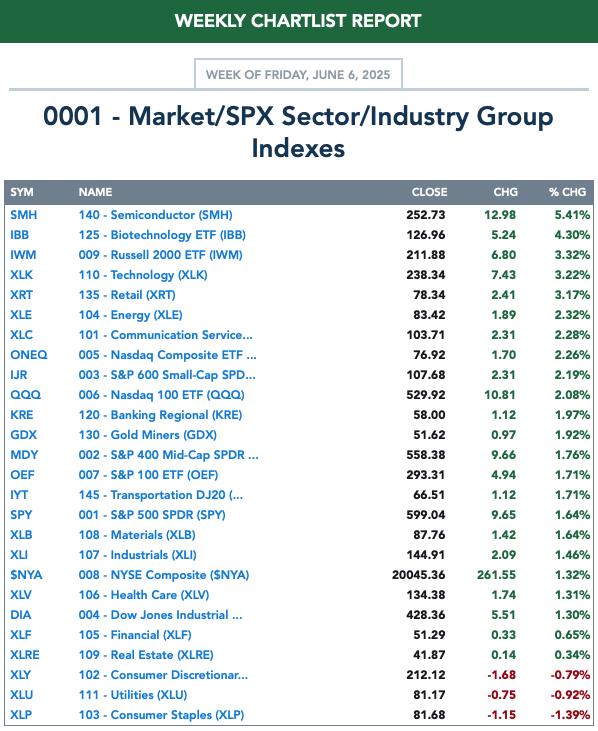
The Sector to Watch is Healthcare (XLV). It is showing new momentum and has broken its declining trend so I think it is finally time for this sector to wake up. It is defensive so even a market downturn should be okay for next week. Runner-ups were XLC, XLI and XLK, all of which look good moving into next week.
The Industry Group to Watch was Pharmaceuticals. Given the success of LLY I thought this would be a good place to concentrate. I was able to find a handful of symbols from this area that do look good moving forward: CPIX, CMPX, LQDA, GHRS, ACB and TGTX.
We had time to run two scans at the end of the trading room. While I wasn't thoroughly impressed by the results, I did find a few that are worth watching next week: VYX, EVR, GVA and AROC. A few of them are overbought, but the price patterns really suggest they will continue moving higher.
Have a great weekend! See you next week!
Good Luck & Good Trading,
Erin

Diamond Mine Trading Room:
RECORDING & DOWNLOAD LINK (6/6/2025):
Topic: DecisionPoint Diamond Mine (6/6/2025) LIVE Trading Room
Download and Recording LINK
Passcode: June#6th
REGISTRATION for 6/13/2025:
When: June 13, 2025 09:00 AM Pacific Time (US and Canada)
Topic: DecisionPoint Diamond Mine LIVE Trading Room
Register in advance for this webinar HERE
After registering, you will receive a confirmation email containing information about joining the webinar.
A few items about the spreadsheet: I've put on the spreadsheet whether the RSI is positive (green) or negative (red). The PMO column tells you if it is rising (green) or falling (red). Finally I've added my own "Sparkle Factor" that gives you my assessment going forward, bullish (green), bearish (red) or neutral (gray). The Sparkle Factor is basically my thoughts on whether I expect it to rise or fall. A neutral means it could really go either way so it could be added to a watch list. If you're in a stock I consider "neutral" going forward, the ball is in your court.
Darling:
Eli Lilly & Co. (LLY)
EARNINGS: 2025-08-07 (BMO)
Eli Lilly & Co. engages in the discovery, development, manufacture, and sale of pharmaceutical products. The firm's products consist of diabetes, oncology, immunology, neuroscience, and other products and therapies. The company was founded by Eli Lilly in May 1876 and is headquartered in Indianapolis, IN.
Predefined Scans Triggered: P&F Double Top Breakout.
Below are the commentary and chart from Tuesday, 6/3:
"LLY is down -0.10% in after-hours trading. I spotted the bullish double bottom in the CandleGlance when I was reviewing what stocks to pick. It is trading range bound, but it is now coming off the bottom of the range with plenty of upside potential. The RSI is still negative, but it is on its way higher. The PMO is on a new Crossover BUY Signal. Relative strength is rising for both the group and LLY. I've set the stop beneath support at 6.6% or $701.22."
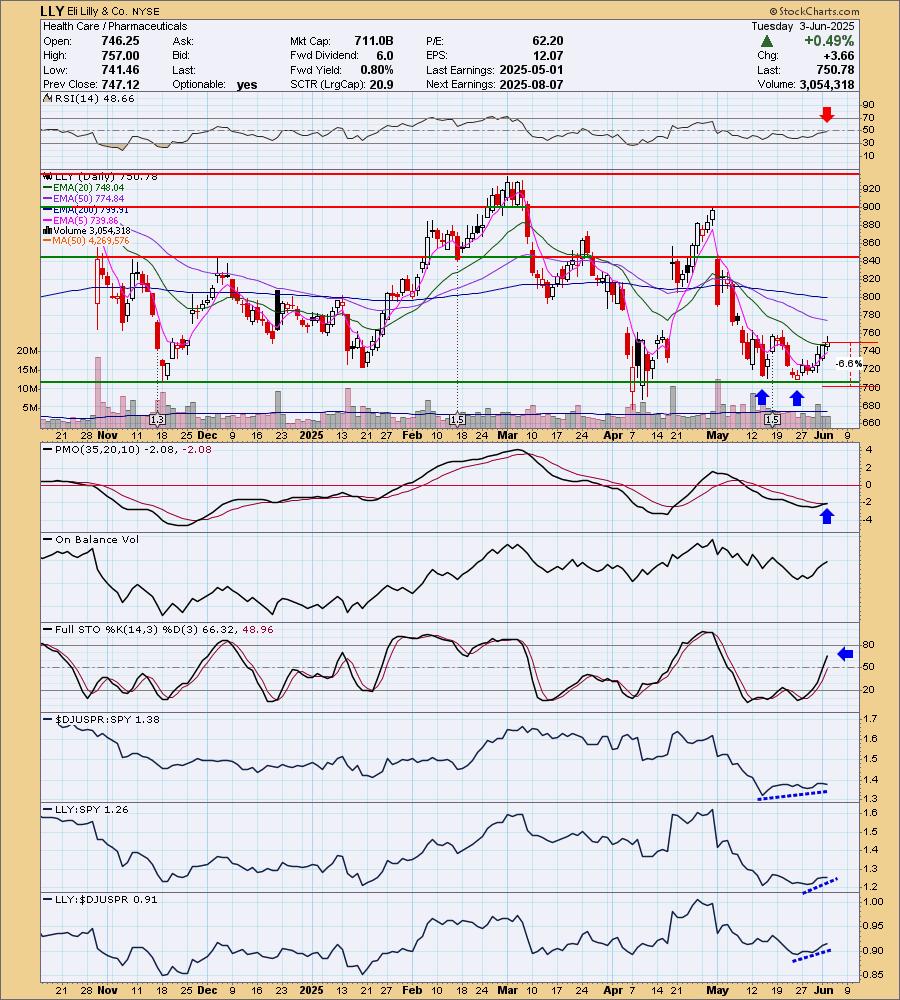
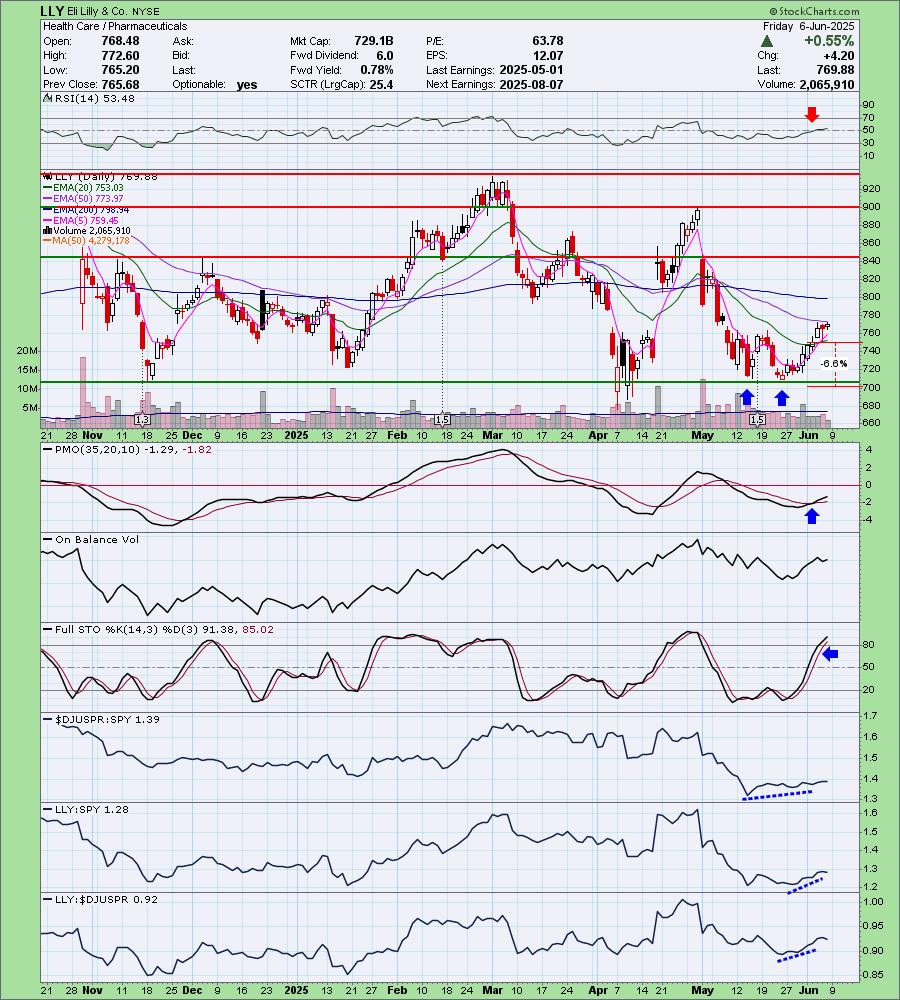
Here is today's chart:
The chart looks very bullish. The bullish double bottom has now been confirmed. I like that it is coming off the bottom of a wide trading range that implies we'll see even more upside. Stochastics are now above 80. The best part about this one is that it is not at all overbought based on the RSI. It can accommodate far more upside here. I did take a chance on this one given the negative RSI at the time, but the other indicators made it worthwhile. It looks early for this rally so again I do see more upside ahead.
Don't forget, on Thursdays I look at reader-requested symbols, so shoot me an email at erin@decisionpoint.com. I read every email I receive and try to answer them all!
Dud:
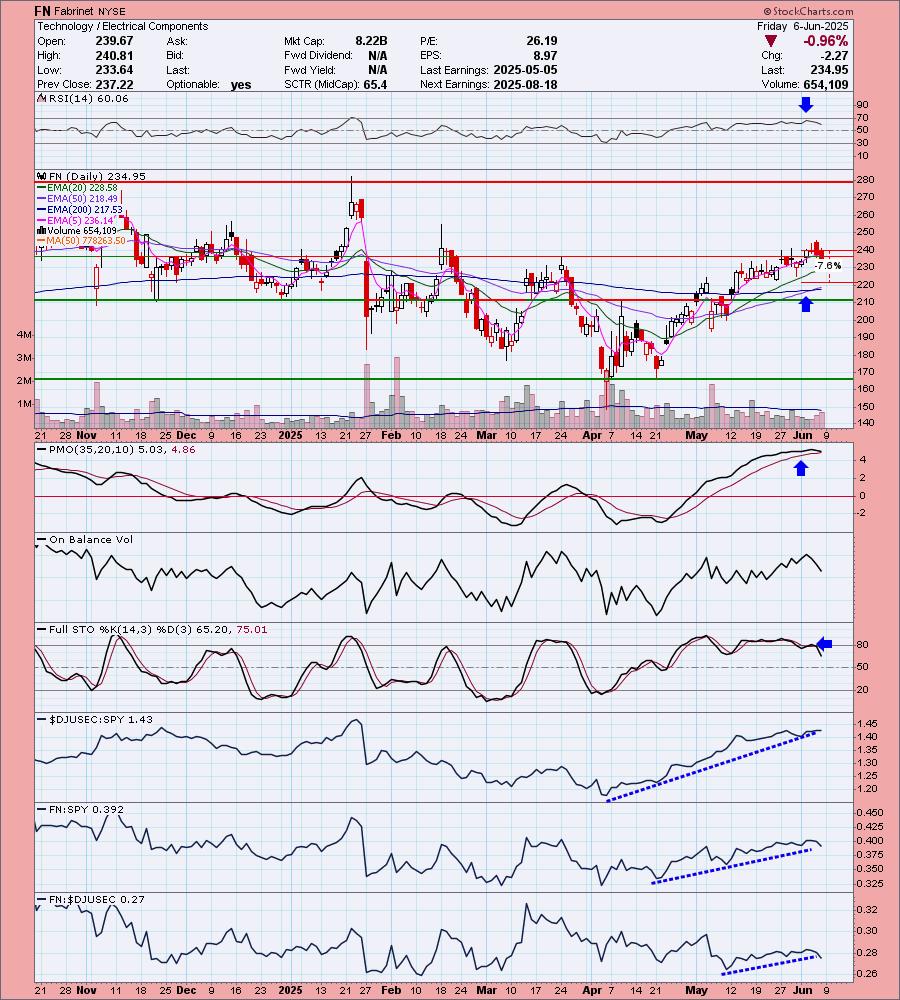
Fabrinet (FN)
EARNINGS: 2025-08-18 (AMC)
Fabrinet engages in the provision of optical packaging and electronic manufacturing services to original equipment manufacturers. The firm's engineering services include process design, failure analysis, reliability testing, tooling design, and real-time traceability system. Its manufacturing operations offer sensors, subsystems, customized optics, and optical modules and components. The company was founded by David Thomas Mitchell on August 12, 1999 and is headquartered in George Town, Cayman Islands.
Predefined Scans Triggered: Elder Bar Turned Green and New CCI Buy Signals.
Below are the commentary and chart from Tuesday, 6/3:
"FN is down -0.15% in after-hours trading. Price is coming out of a bullish double bottom and hasn't quite hit the upside target of the pattern. We have a breakout above the March high and there is a Golden Cross nearing of the 50/200-day EMAs. The RSI is positive and not overbought. The PMO surged above the signal line. Stochastics have reversed higher and are almost above 80. I definitely like relative strength studies. All three relative strength lines have been rising for some time. The stop is set between the 20/50-day EMAs at 7.6% or $221.63."
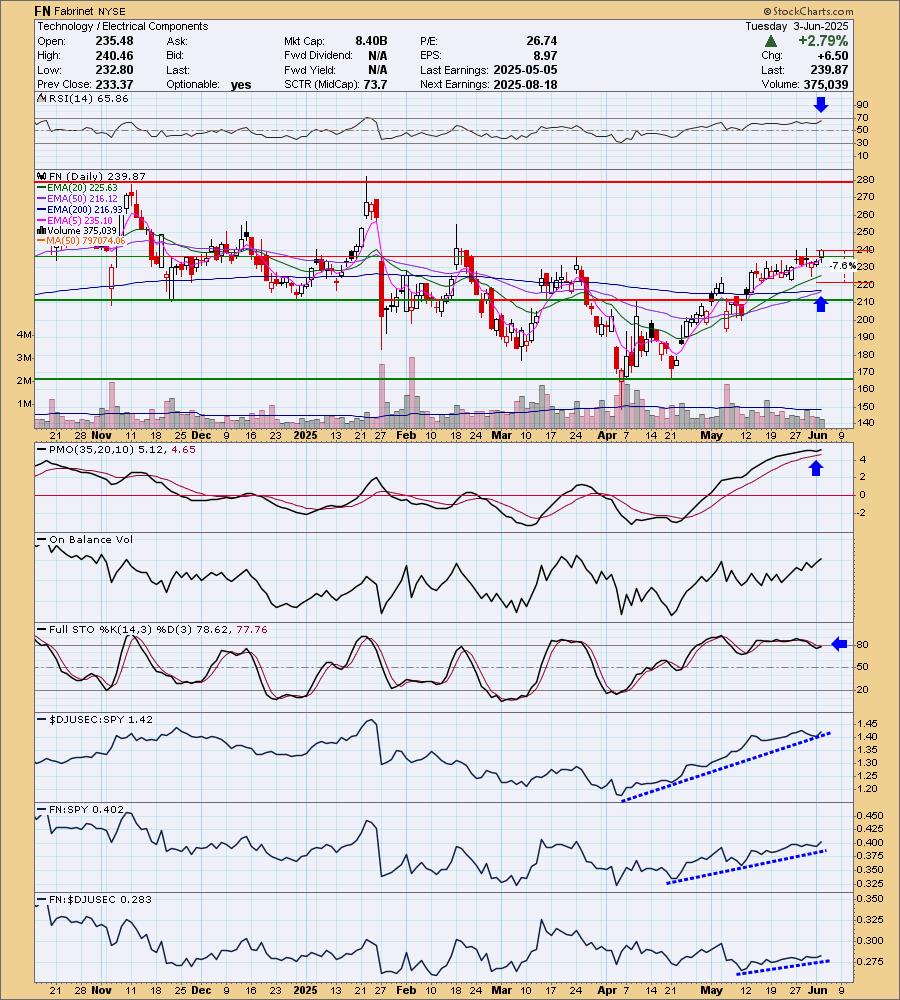
Here is today's chart:
I would say that this one still has merit. The big problem is the topping PMO that is nearing a Crossover SELL Signal. Still, the rising trend is still intact. This looks like a mechanical pullback after a breakout and those aren't always negative. Stochastics did take a turn for the worse so I'm listing this one with a 'Neutral' Sparkle Factor. I'm not sure what went wrong here. Like I said it isn't a deep decline and the rising trend is intact so there is still some possibilities here.
THIS WEEK's Performance:
DecisionPoint Market Scoreboard (Mechanical Trend Model Signals):
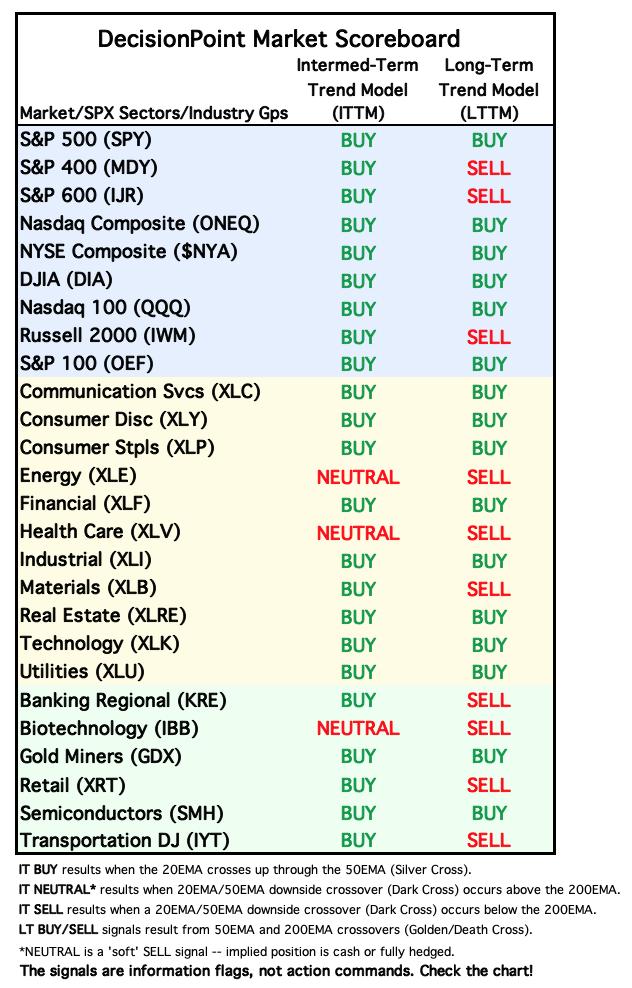
Friday signal changes are outlined in purple.
Click Here to view Carl's annotated "Under the Hood" ChartList!
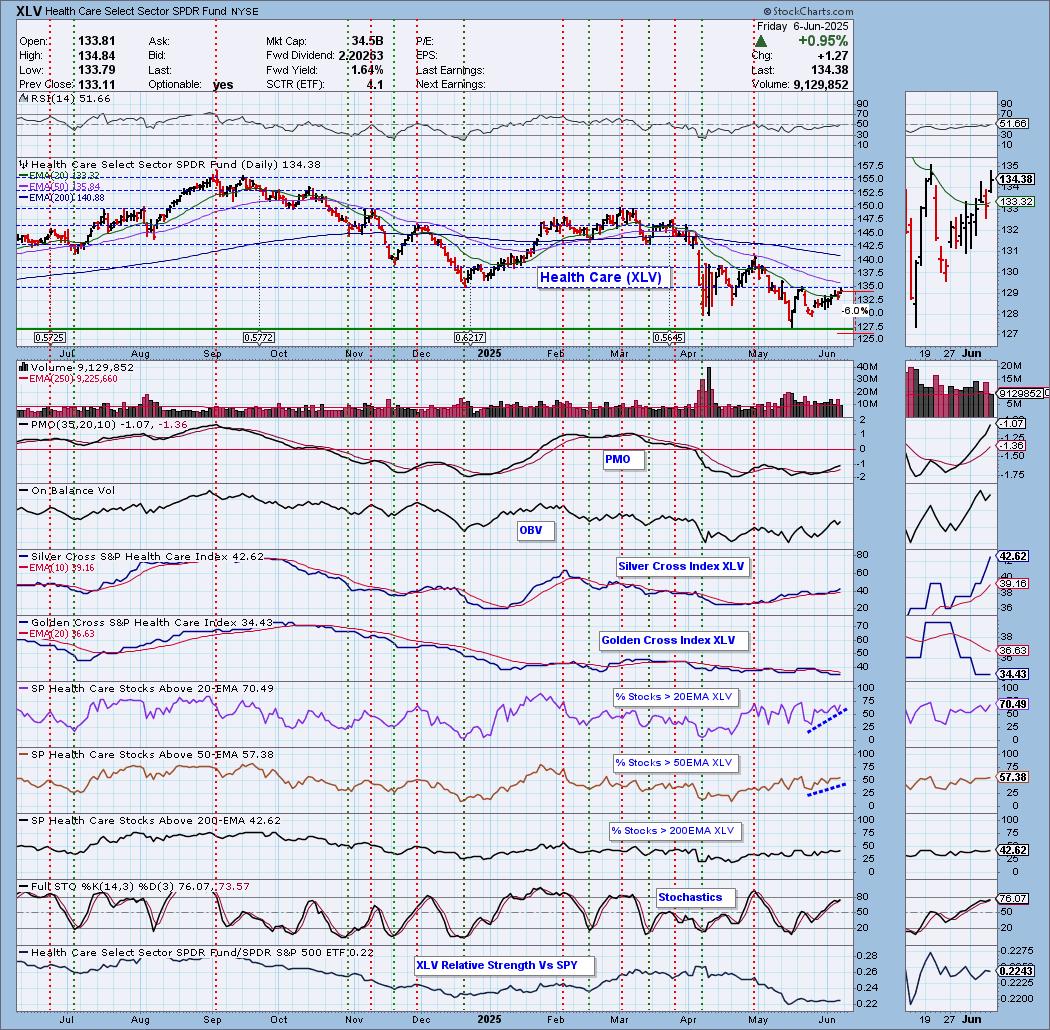
Sector to Watch: Health Care (XLV)
We're getting in on this early so it could see a reversal of fortune on Monday, but I think this one is going to build back up from here. The RSI just moved into positive territory. The PMO is rising on a fairly new Crossover BUY Signal. The OBV is rising to confirm this rally. The Silver Cross Index could read higher than this, but it is going the right direction and is above its signal line for a BULLISH IT Bias. The Golden Cross Index is trying to bottom. I'd like to see it get back above its signal line, but like I said this is early and that indicator needs lots of time to bake. Participation readings are in rising trends and %Stocks > 20/50EMAs are above our bullish 50% threshold. Stochastics are rising strongly. Relative strength hasn't picked up, but it is traveling in line with the benchmark SPY. I'm looking for a breakout here with follow-through.
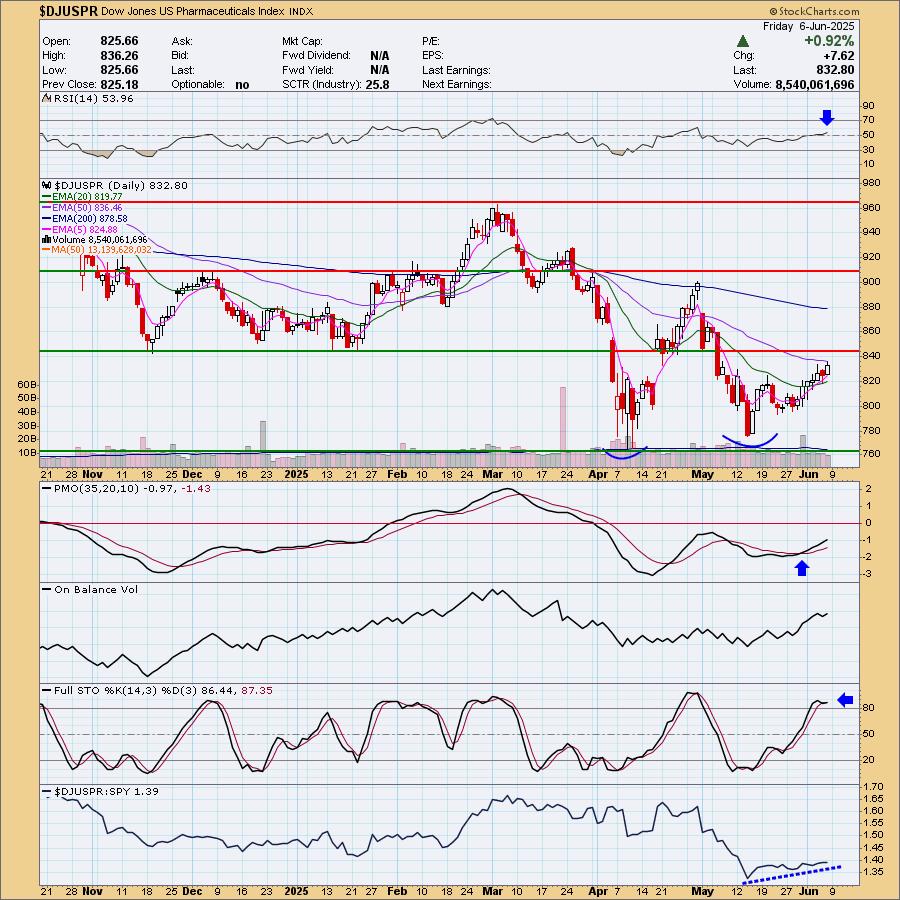
Industry Group to Watch: Pharmaceuticals ($DJUSPR)
I like the big bullish double bottom pattern on the chart that suggests we will see price climb above the April high. The RSI is positive and not overbought. The PMO is rising nicely on a Crossover BUY Signal. It is below the zero line still, but the price pattern overrides any concern there. The OBV is rising with price. Stochastics have bottomed above 80 and we see good relative strength. Here are a few symbols of interest from this group: CPIX, CMPX, LQDA, GHRS, ACB and TGTX.
Go to our Under the Hood ChartList on DecisionPoint.com to get an in-depth view of all the sectors. On StockCharts.com you can find the Industry Summary.
Good Luck & Good Trading!
- Erin
erin@decisionpoint.com
Full Disclosure: I'm 60% long, 0% short.
Watch the latest episode of the DecisionPoint Trading Room with Carl & Erin Swenlin HERE!
Technical Analysis is a windsock, not a crystal ball. --Carl Swenlin
NOTE: The stocks reported herein are from mechanical trading model scans that are based upon moving average relationships, momentum and volume. DecisionPoint analysis is then applied to get selections from the scans. The selections given should prompt readers to do a chart review using their own analysis process. This letter is not a call for a specific action to buy, sell or short any of the stocks provided. There are NO sure things or guaranteed returns on the selection of "diamonds in the rough."
Helpful DecisionPoint Links:
DecisionPoint Shared ChartList and DecisionPoint Chart Gallery
Price Momentum Oscillator (PMO)
Swenlin Trading Oscillators (STO-B and STO-V)
(c) Copyright 2025 DecisionPoint.com