
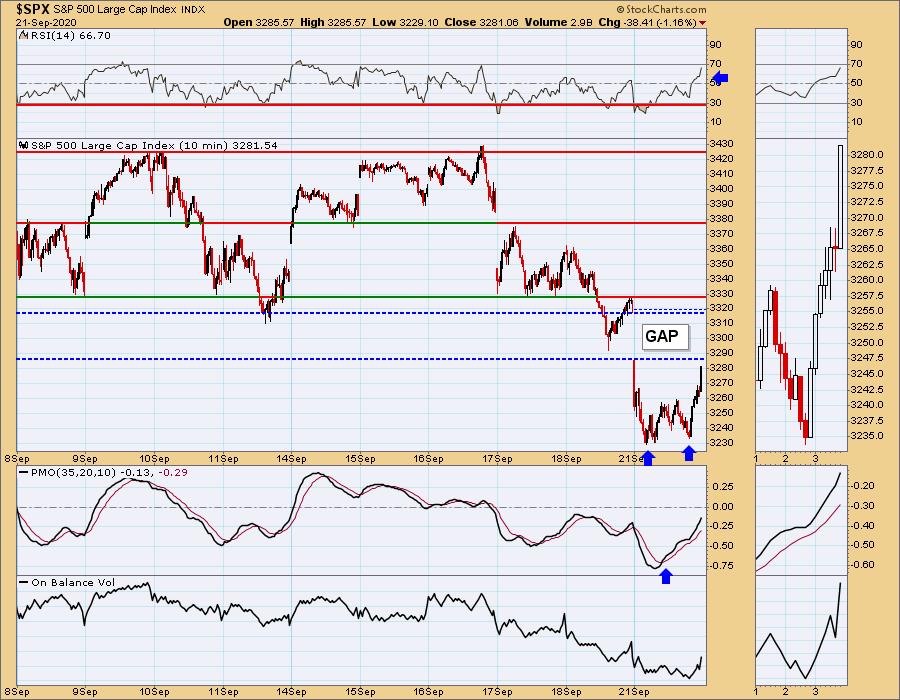
Before I get into the bullish implications of the market, I want to say that overall, I am not bullish on the market. However, there are some very interesting climactic and short-term indications that we have just experienced a selling exhaustion which is bullish. Below is the 10-minute bar chart. Note the possible double-bottom formation. The only problem is that it already burst above the confirmation line and has nearly fulfilled the upside target of the pattern. I say "nearly". Seeing today's action and the hints at a selling exhaustion, I would look for price to continue higher to fulfill that pattern. The question remains now is if it can push past the gap resistance that was formed this morning. I suspect we will see it rebound, but not enough to get back into the consolidation zone above 3330. The RSI is very positive, but getting overbought. Momentum is swinging higher which is bullish.

Click here to register in advance for the recurring free DecisionPoint Trading Room (Next one is 9/21)!
Did you miss today's (9/14) trading room? Here is a link to the recording (password: 3^aXxCJ2).
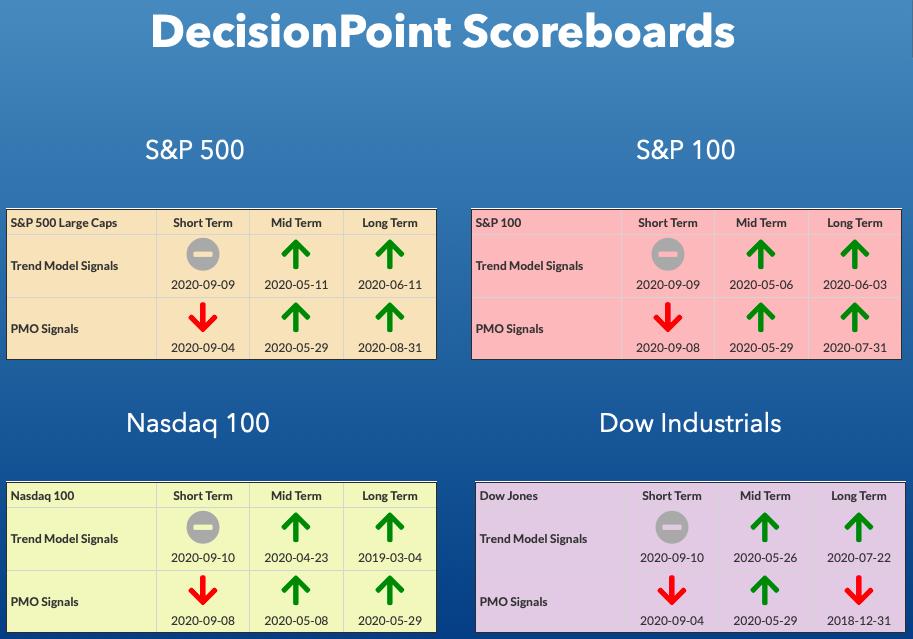
DP INDEX SCOREBOARDS:
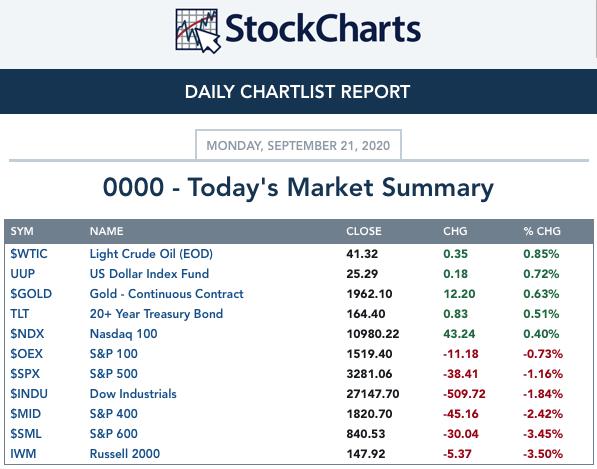
TODAY'S Broad Market Action:
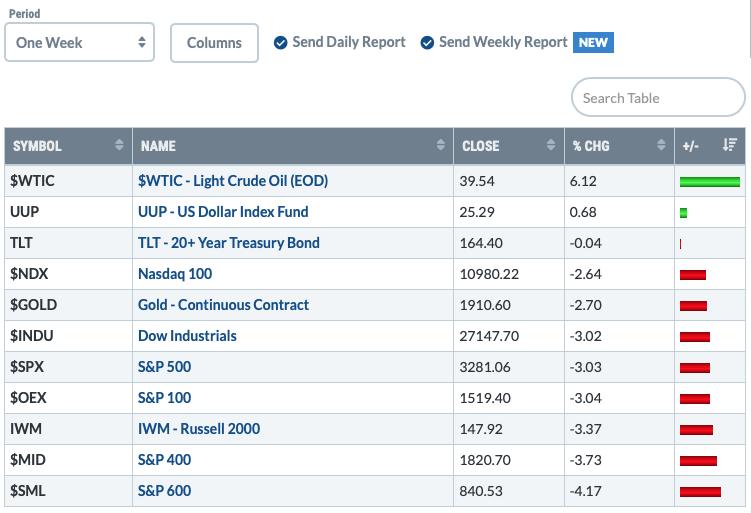
One WEEK Results:
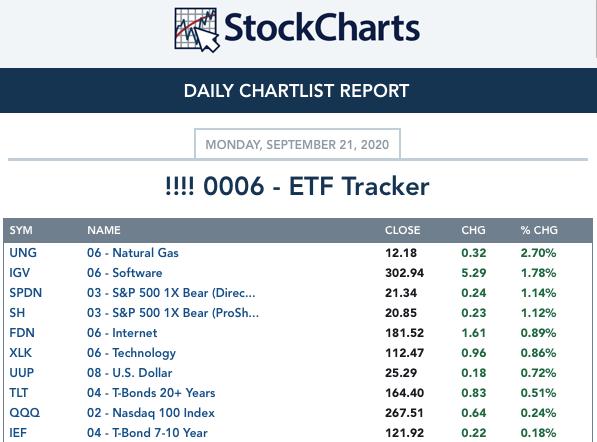
Top 10 from ETF Tracker:
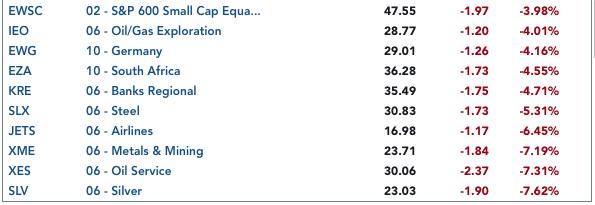
Bottom 10 from ETF Tracker:
On Friday, the DecisionPoint Alert Weekly Wrap presents an assessment of the trend and condition of the stock market (S&P 500), the U.S. Dollar, Gold, Crude Oil, and Bonds. Monday through Thursday the DecisionPoint Alert daily report is abbreviated and covers changes for the day.
Watch the latest episode of DecisionPoint on StockCharts TV's YouTube channel here!
SECTORS
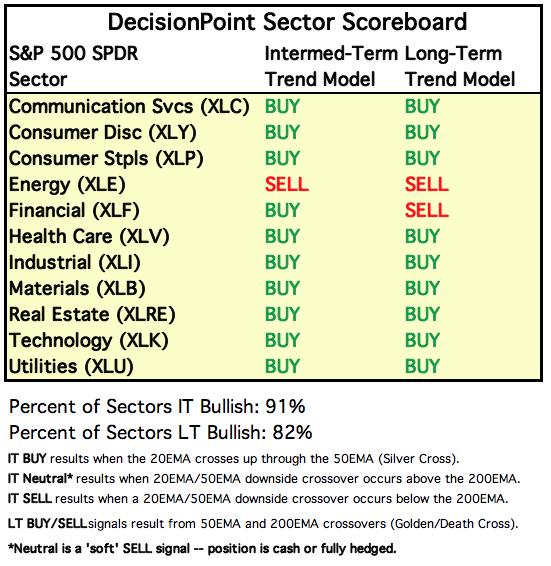
SIGNALS:
Each S&P 500 Index component stock is assigned to one, and only one, of 11 major sectors. This is a snapshot of the Intermediate-Term (Silver Cross) and Long-Term (Golden Cross) Trend Model signal status for those sectors.
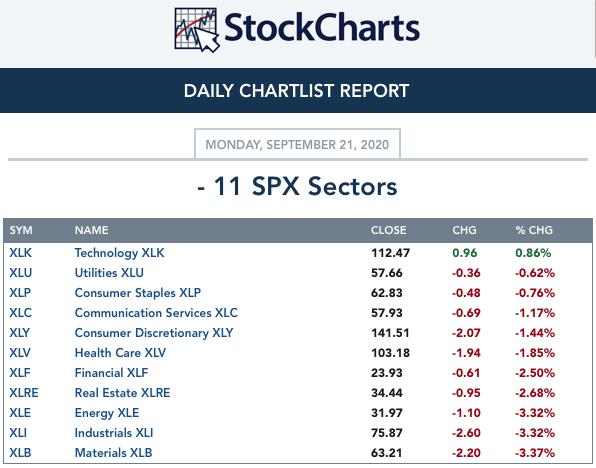
TODAY'S RESULTS:
One WEEK Results: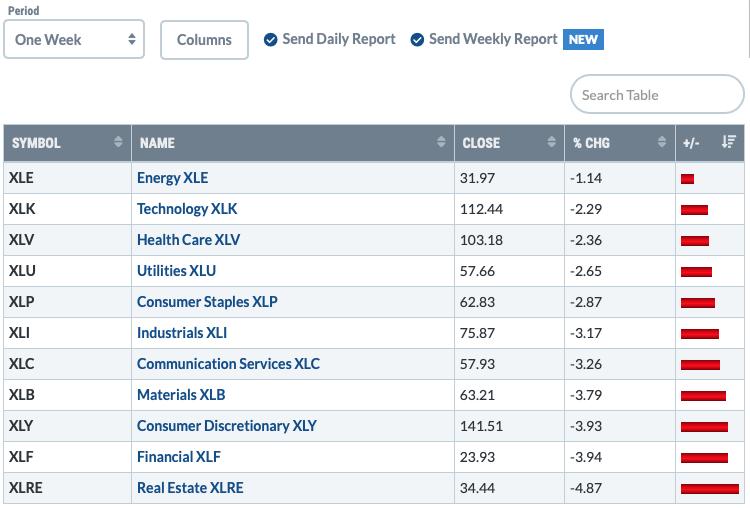
STOCKS
IT Trend Model: BUY as of 5/8/2020
LT Trend Model: BUY as of 6/8/2020
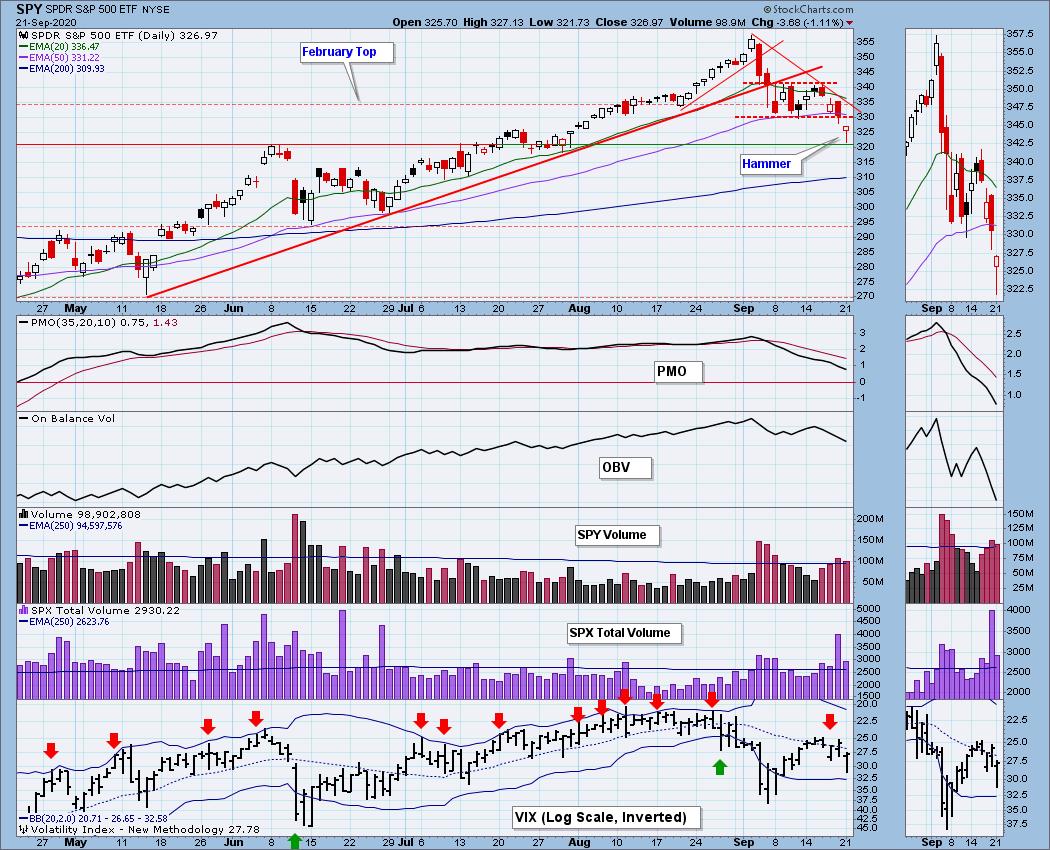
SPY Daily Chart: I noted on many of the major indexes (NDX and Nasdaq are exceptions), a hammer candlestick. These are bullish candles that suggest an upside move the following day. The rest of the chart is far from bullish except that support at $321 is holding up...barely. Volume was intense today which also gives us an indication of a climax. The VIX remained below its EMA on the inverted scale which suggests more volatility and weakness ahead.
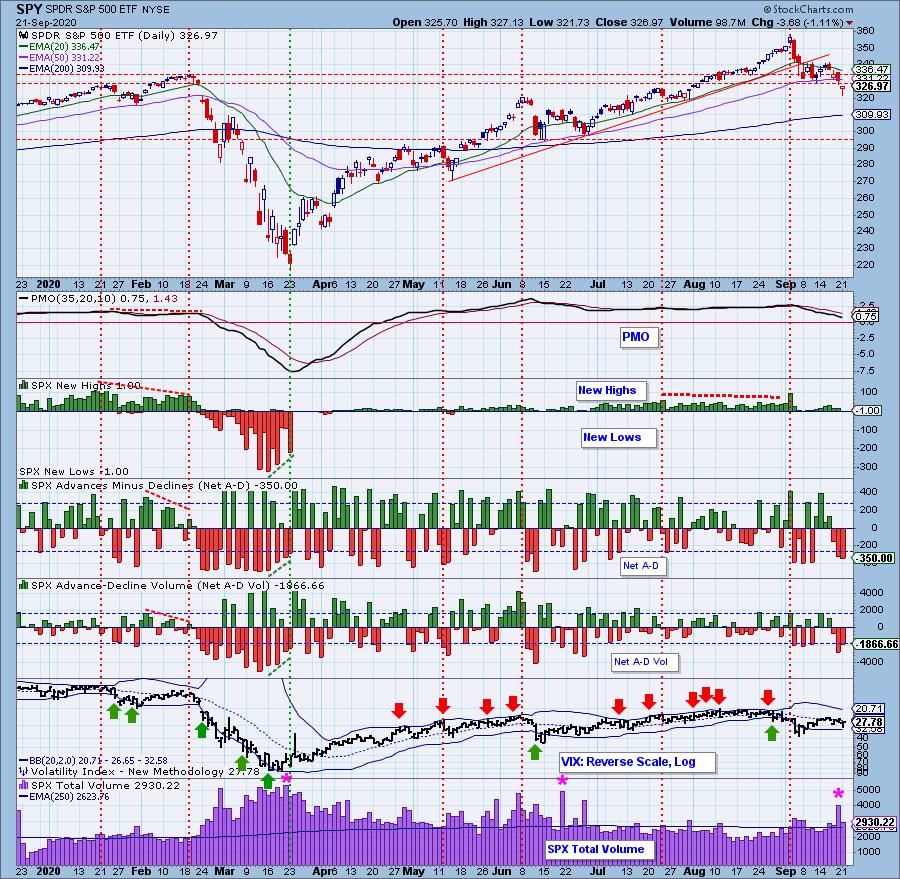
Climactic Market Indicators: We saw no real movement on New Highs/New Lows, but clearly the Net A-D and Net A-D Volume are climactic. Because this climax is coming off a big decline, Carl and I are reading it as a selling exhaustion. Coming alongside a hammer certainly suggests a rally pop tomorrow.
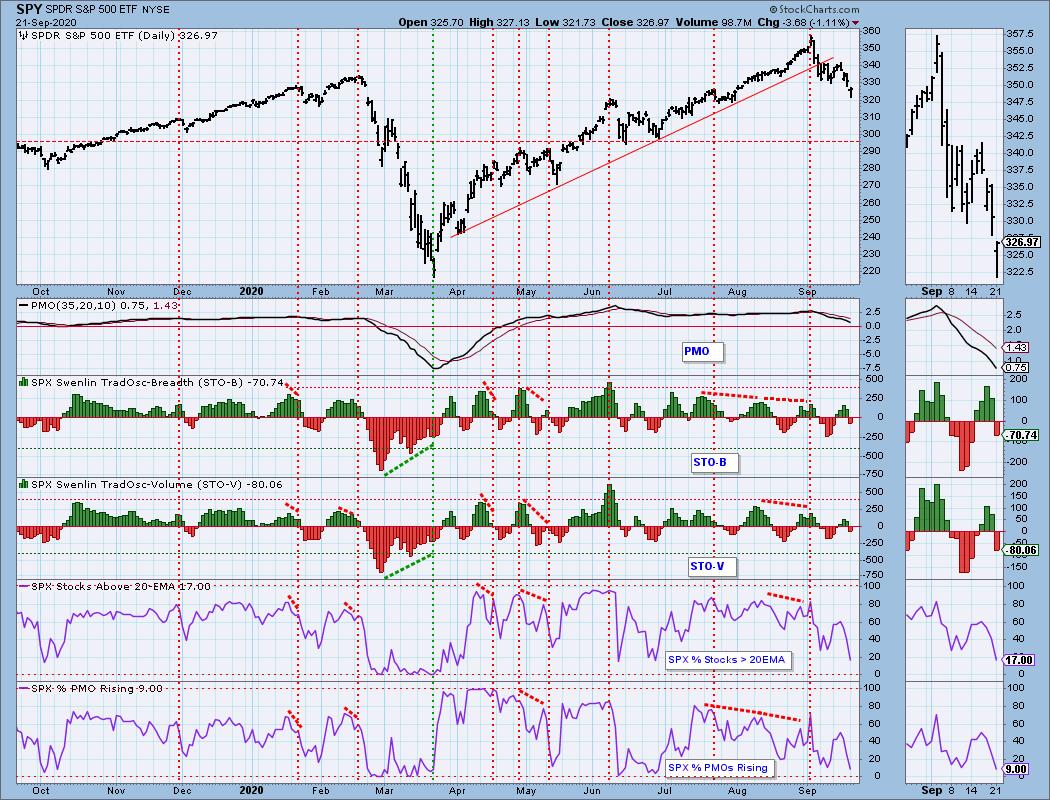
Short-Term Market Indicators: The short-term market trend is NEUTRAL and the condition is NEUTRAL. Based upon the STO ranges, market bias is NEUTRAL. Big negative move on the STOs today. Sadly, not enough to really give us a confirmation that any rally pop will be lasting. We are seeing very oversold readings on the %Stocks indicators which could suggest some follow-on, but I'll reserve judgement until tomorrow.
Intermediate-Term Market Indicators: The following chart uses different methodologies for objectively showing the depth and trend of participation for intermediate- and long-term time frames.
- The Silver Cross Index (SCI) shows the percentage of SPX stocks on IT Trend Model BUY signals (20-EMA > 50-EMA).
- The Golden Cross Index (GCI) shows the percentage of SPX stocks on LT Trend Model BUY signals (50-EMA > 200-EMA).
- The Bullish Percent Index (BPI shows the percentage of SPX stocks on Point & Figure BUY signals.
The BPI is particularly ugly and not that oversold, this tells me that the intermediate term is not bullish right now. It doesn't help that the SCI is retreating as well. The GCI is also decelerating which is bad for the long term.
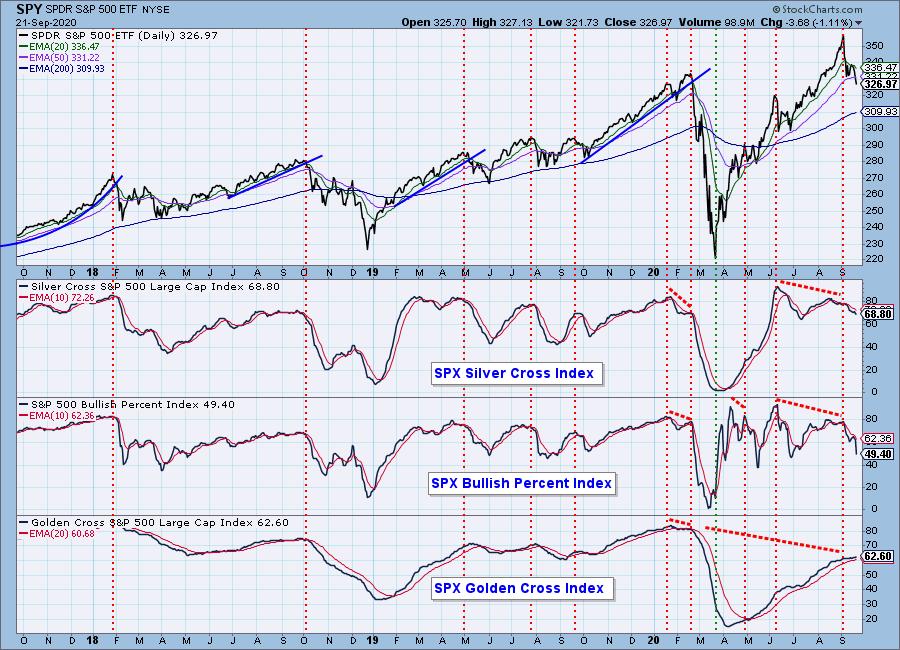
The intermediate-term market trend is DOWN and the condition is NEUTRAL. The market bias is NEUTRAL.
We're seeing red bars for the first time on the ITBM/ITVM since the bear market. It's just another indicator that spells decline ahead in the intermediate term.
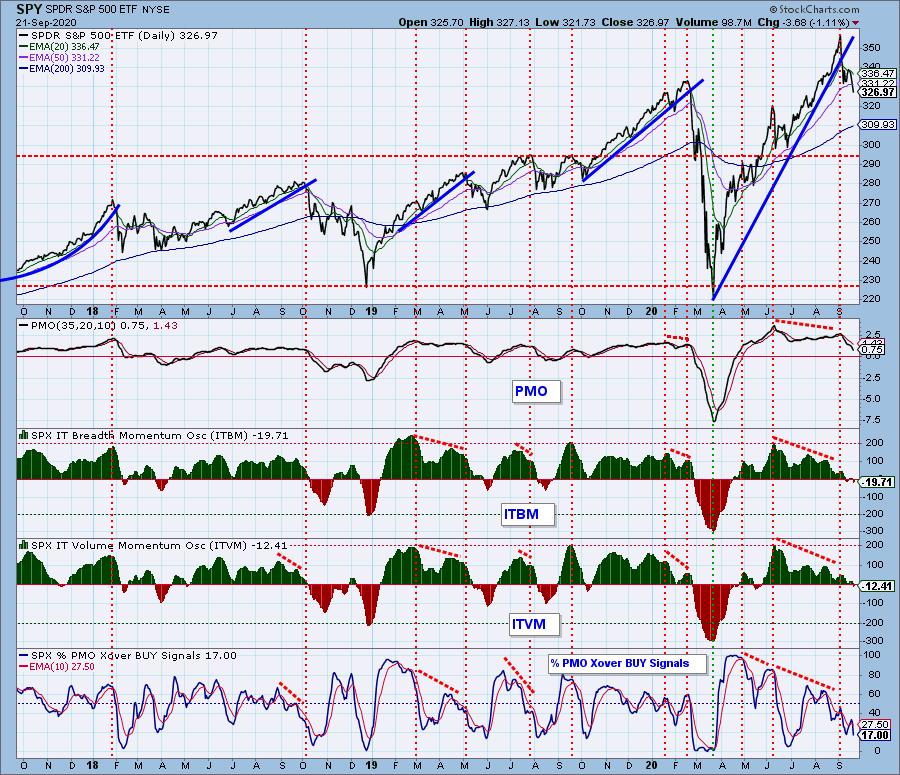
CONCLUSION: The drop today was another indication that we aren't out of the bear market woods. However, there were plenty of indications that we will experience a rally pop tomorrow. Hopefully I won't be writing about getting 'hammered' by the hammer candlestick tomorrow, but given the intensity of selling today, it seems likely we will see a reversal. Maybe that will be our opportunity to close out a few of our weak positions...I know I'll be watching.
DOLLAR (UUP)
IT Trend Model: NEUTRAL as of 5/28/2020
LT Trend Model: SELL as of 7/10/2020
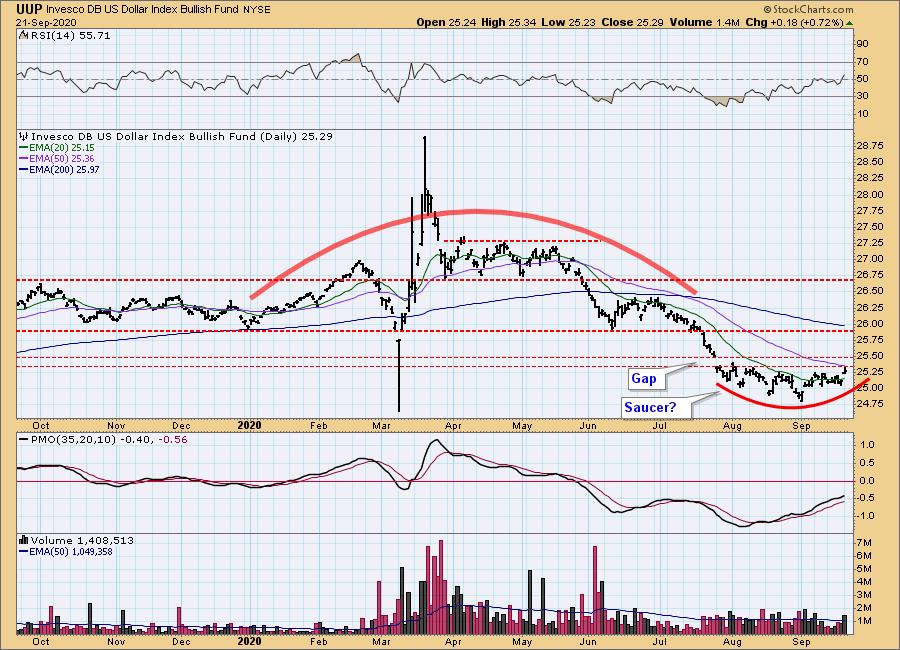
UUP Daily Chart: With the big rally in the Dollar today, you can guess what the Gold chart must look like, but let's start with UUP. Carl has annotated a bullish cup shape and the gap. Given that bullish rounded bottom, he and I believe we will see this large "island" resolve upward and close that gap. The PMO is very bullish and the RSI has just entered positive territory above net neutral (50).
GOLD
IT Trend Model: BUY as of 3/24/2020
LT Trend Model: BUY as of 1/8/2019
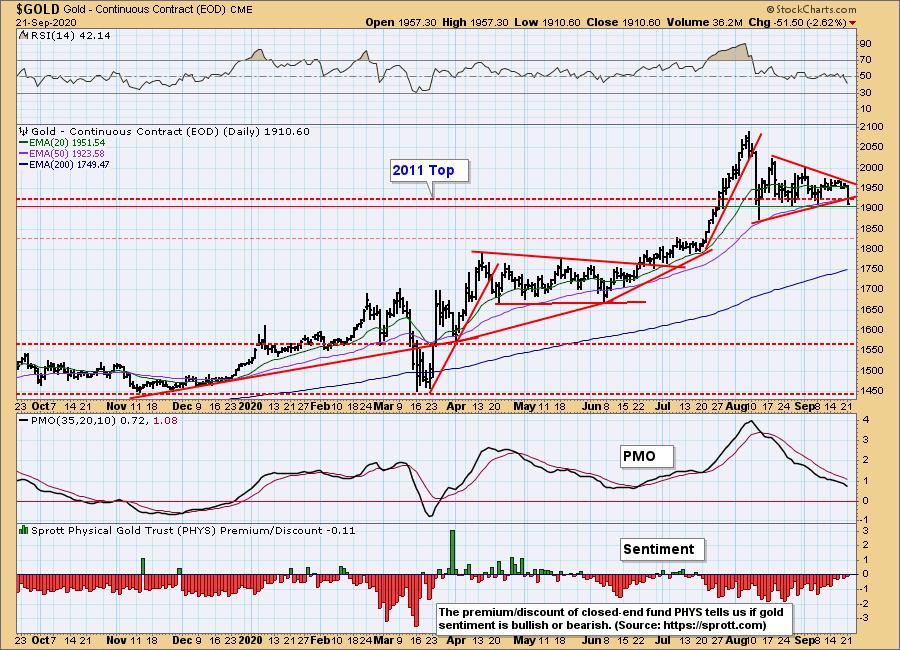
GOLD Daily Chart: Gold broke down below the rising trend today, but it is still holding support along the August and early September lows. The RSI has moved into negative territory and the PMO is accelerating downward. Being that I'm bullish on the Dollar, I can't say that I have high confidence that the $1900 support level will hold.
Full Disclosure: I own GLD.
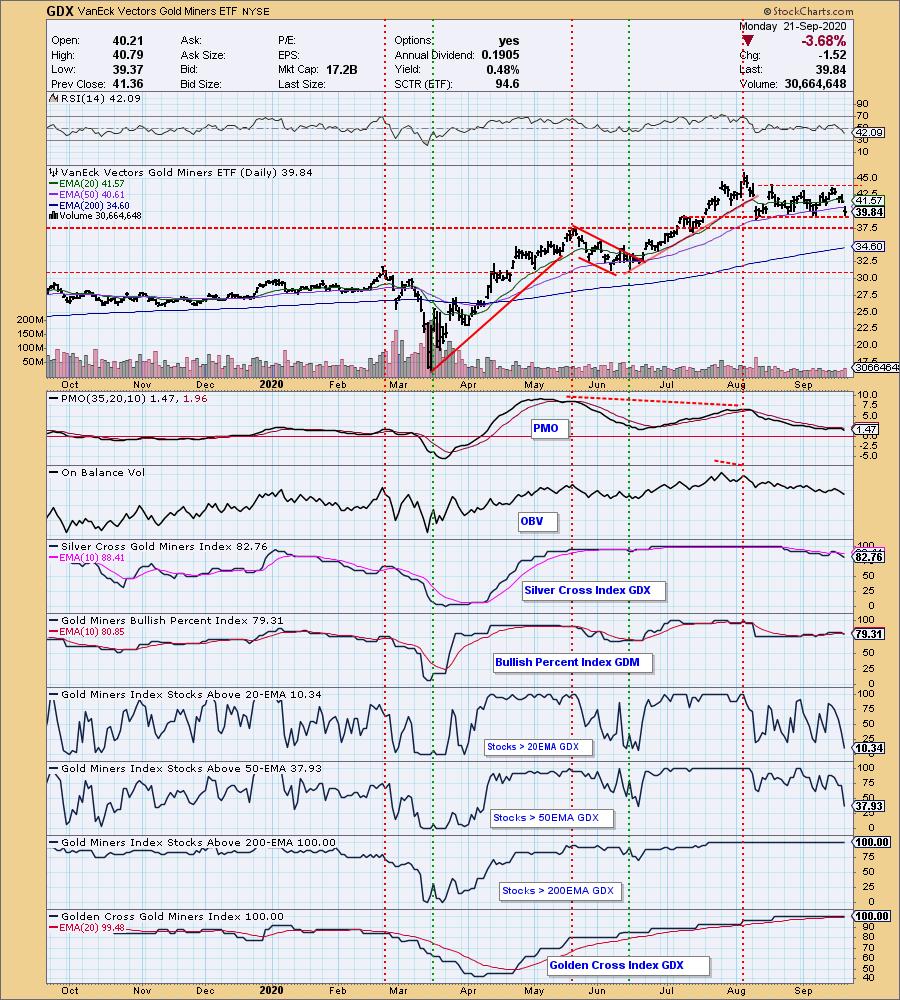
GOLD MINERS Golden and Silver Cross Indexes: Carl and I talked about the difference between Gold and Gold Miners. On the chart we can certainly see the similarities as price is testing horizontal support. The RSI has moved negative and the PMO is moving lower. I note that given the updated indicators, we are seeing oversold readings which is good. The underlying foundation of the GDX is still strong given that 100% of the components have "golden crosses" intact.
CRUDE OIL (USO)
IT Trend Model: SELL as of 9/8/2020
LT Trend Model: SELL as of 2/3/2020
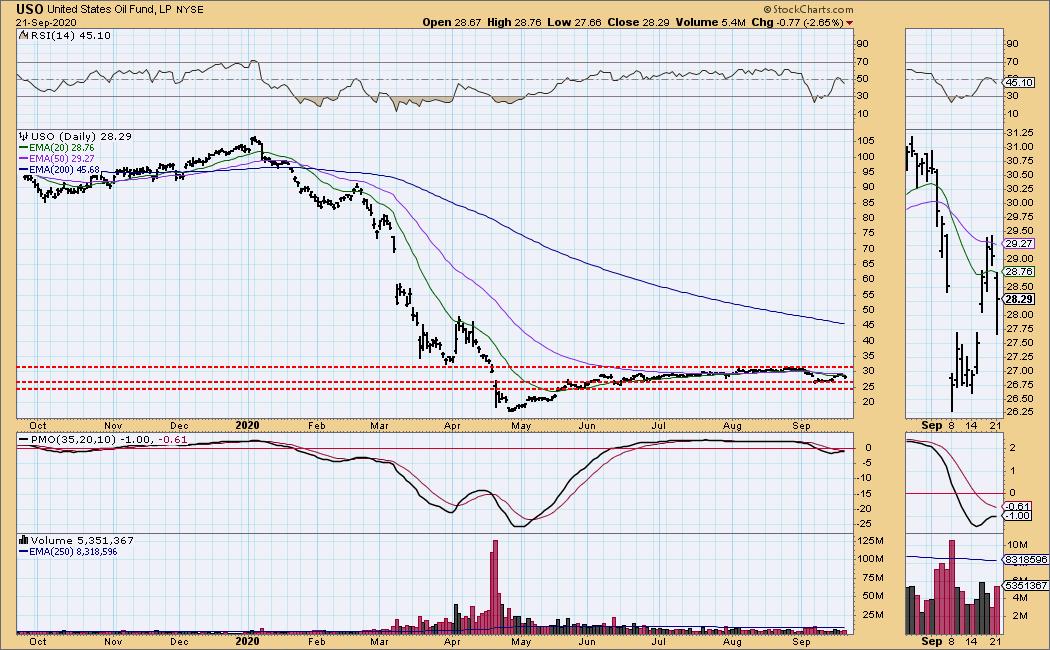
USO Daily Chart: I had thought that Oil would at least challenge $31 before turning back down, but instead the 20/50-EMAs held price down. The RSI has moved back into negative territory and the PMO has turned down below its signal line. I would look for a test of the $26.25 level before we see a rebound.
BONDS (TLT)
IT Trend Model: Neutral as of 8/27/2020
LT Trend Model: BUY as of 1/2/2019
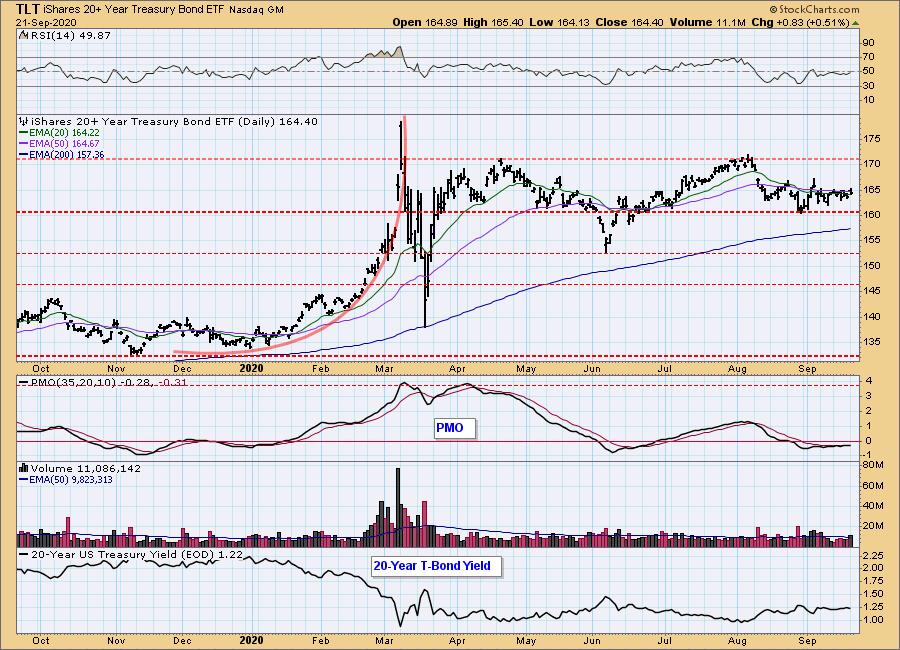
TLT Daily Chart: Really not much to talk about with TLT. It continues to consolidate sideways as it struggles to overcome resistance at the 20/50-EMAs. The PMO is now on a BUY signal and the RSI has nearly reached positive territory so we could be seeing the beginning of a small rally to possibly challenge the September top.
Full disclosure: I own TLT.
Have you subscribed the DecisionPoint Diamonds yet? DP does the work for you by providing handpicked stocks/ETFs from exclusive DP scans! Get in on the new "DecisionPoint Diamond Mine" trading room that is part of that subscription! Contact support@decisionpoint.com for more information!
Technical Analysis is a windsock, not a crystal ball.
Happy Charting! - Erin
Email: erin@decisionpoint.com
NOTE: The signal status reported herein is based upon mechanical trading model signals, specifically, the DecisionPoint Trend Model. They define the implied bias of the price index based upon moving average relationships, but they do not necessarily call for a specific action. They are information flags that should prompt chart review. Further, they do not call for continuous buying or selling during the life of the signal. For example, a BUY signal will probably (but not necessarily) return the best results if action is taken soon after the signal is generated. Additional opportunities for buying may be found as price zigzags higher, but the trader must look for optimum entry points. Conversely, exit points to preserve gains (or minimize losses) may be evident before the model mechanically closes the signal.
Helpful DecisionPoint Links (Can Be Found on DecisionPoint.com Links Page):
DecisionPoint Shared ChartList and DecisionPoint Chart Gallery
Price Momentum Oscillator (PMO)