
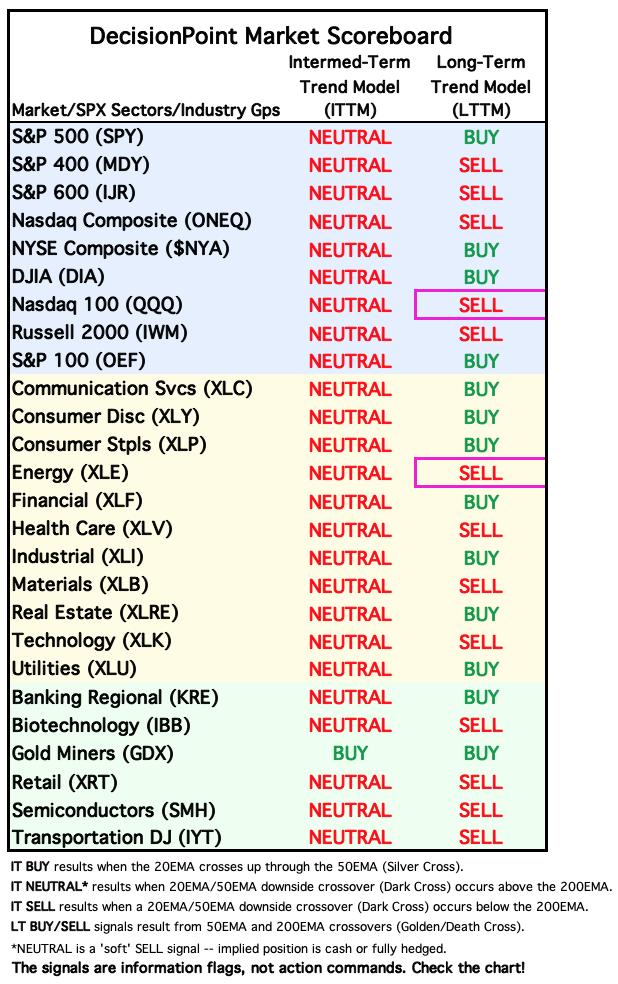
Today the Nasdaq 100 ETF (QQQ) 50-day EMA crossed down through the 200-day EMA (Death Cross), generating an IT Trend Model SELL Signal. We got a bounce off support and we do see a slight rising trend out of the low, but more than likely there will be more volatility and likely decline ahead given participation is so thin and not actually oversold.
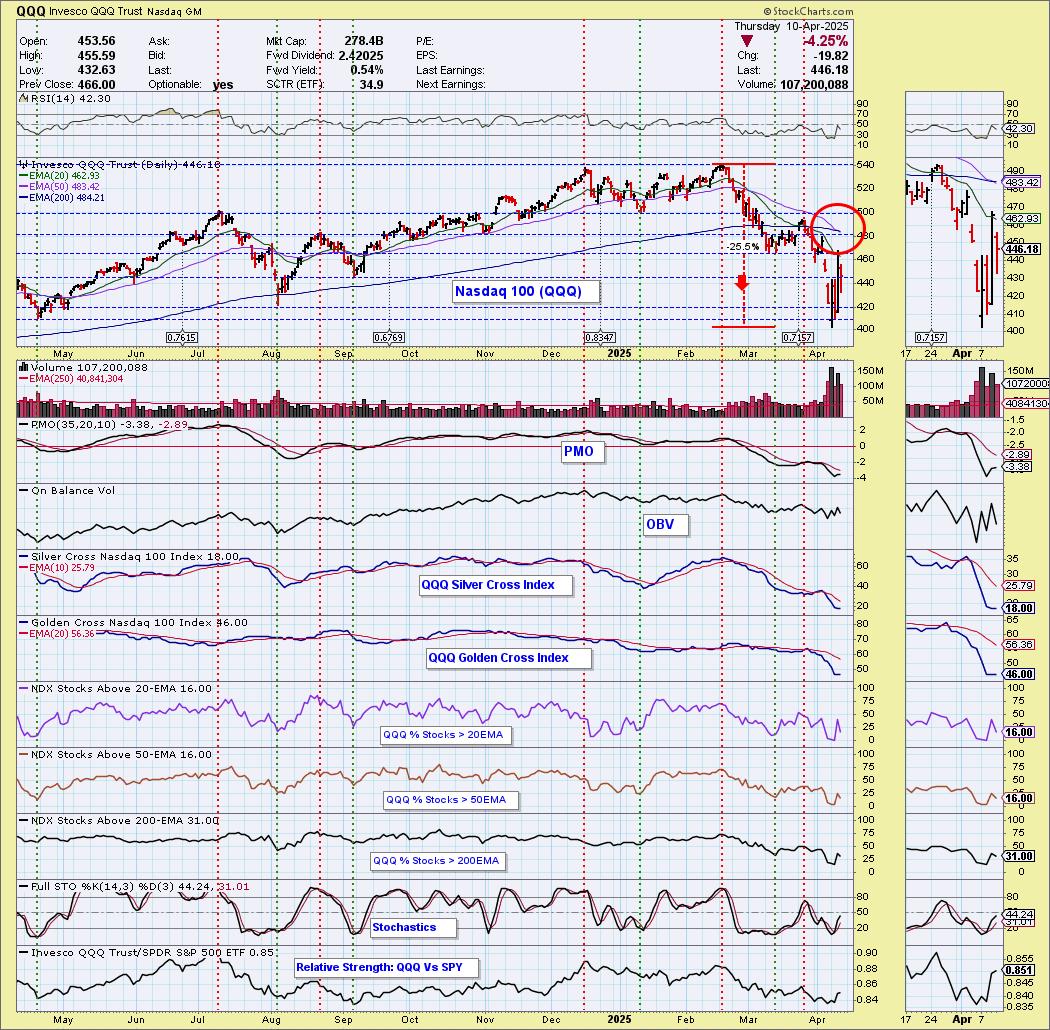
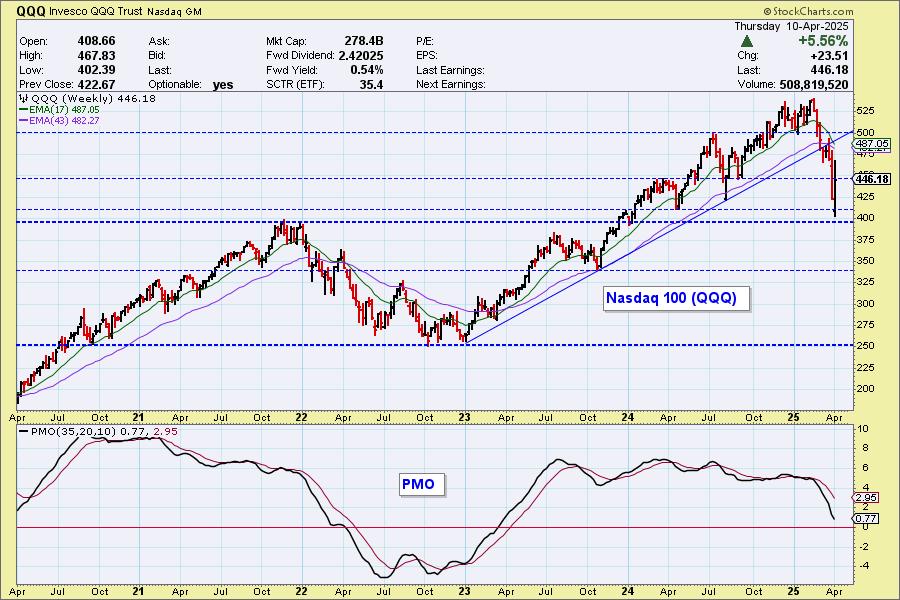
This is a significant breach of the rising bottoms trendline that made up this bull market. As noted above we did get a bounce off strong support, but given the very bearish weekly PMO we believe there will be more downside to absorb.
__________
Also today, the Energy Sector ETF (XL) 50-day EMA crossed down through the 200-day EMA (Death Cross), generating an IT Trend Model SELL Signal. Support was lost and participation is at 0% for stocks above their 20/50-day EMAs. That is oversold by a mile, but Crude looks weak and the sector is likely to experience more trouble as long as Crude is in decline.
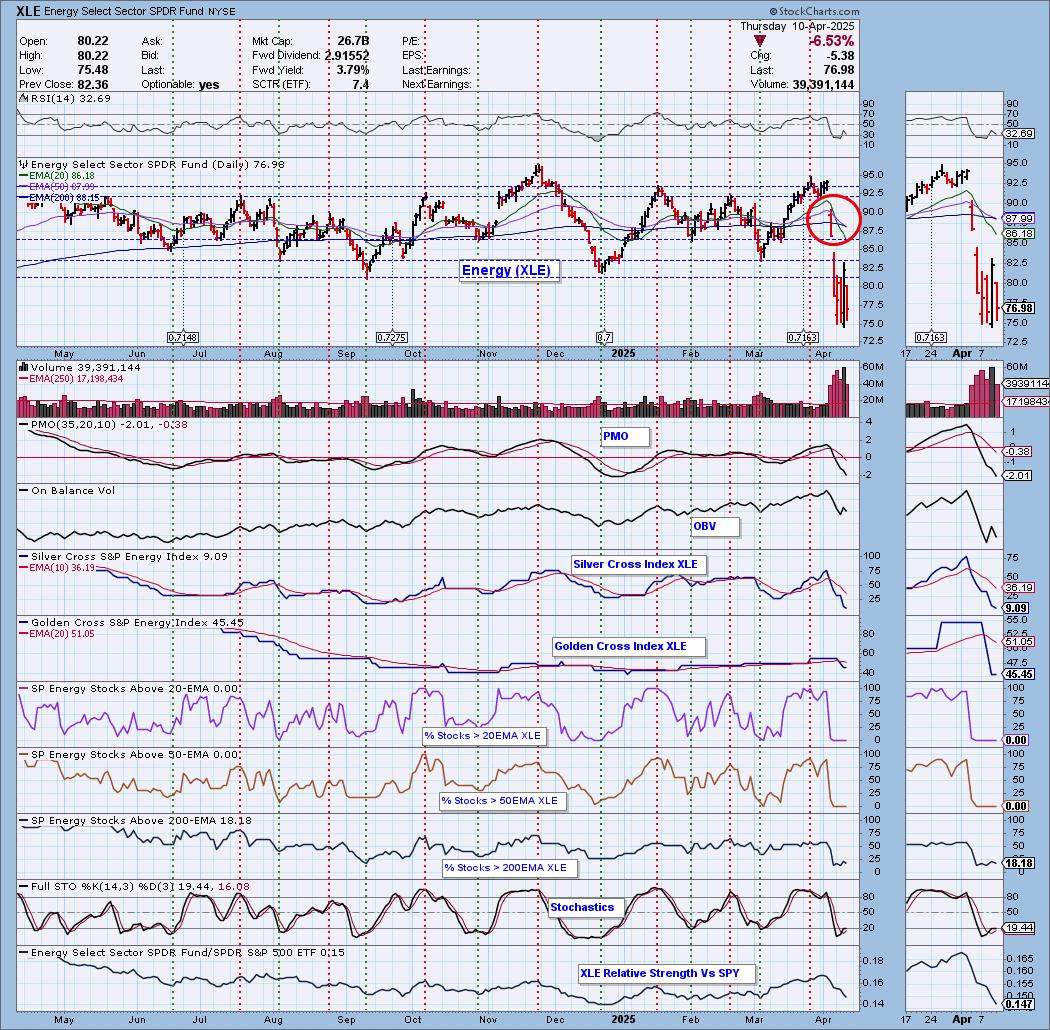
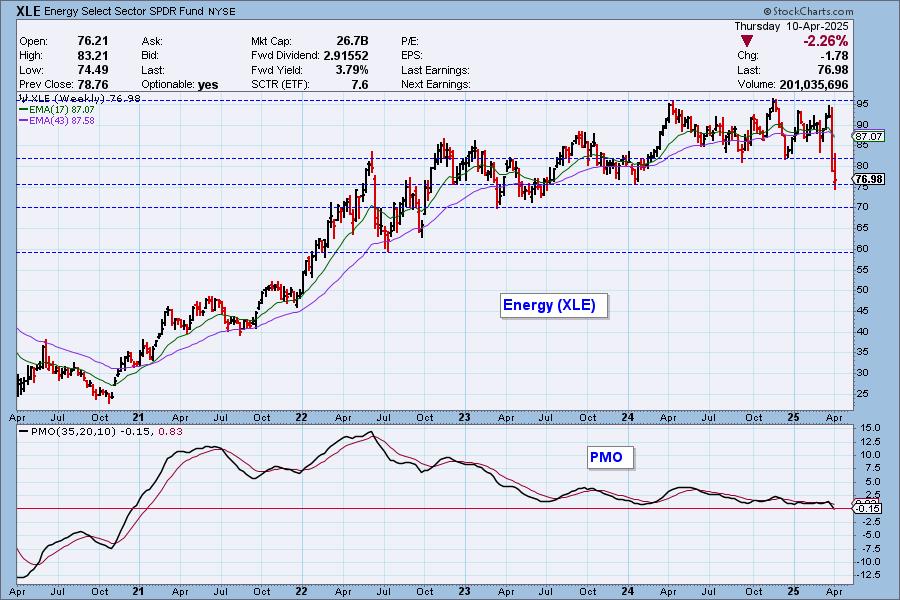
We've lost support on the weekly chart near-term and it is currently testing the next line of support. Strong support doesn't arrive until 70 and we think that is where it is headed given the weekly PMO is dropping quickly and is now below the zero line.
The DecisionPoint Alert Weekly Wrap presents an end-of-week assessment of the trend and condition of the Stock Market, the U.S. Dollar, Gold, Crude Oil, and Bonds. The DecisionPoint Alert daily report (Monday through Thursday) is abbreviated and gives updates on the Weekly Wrap assessments.
MARKET/INDUSTRY GROUP/SECTOR INDEXES
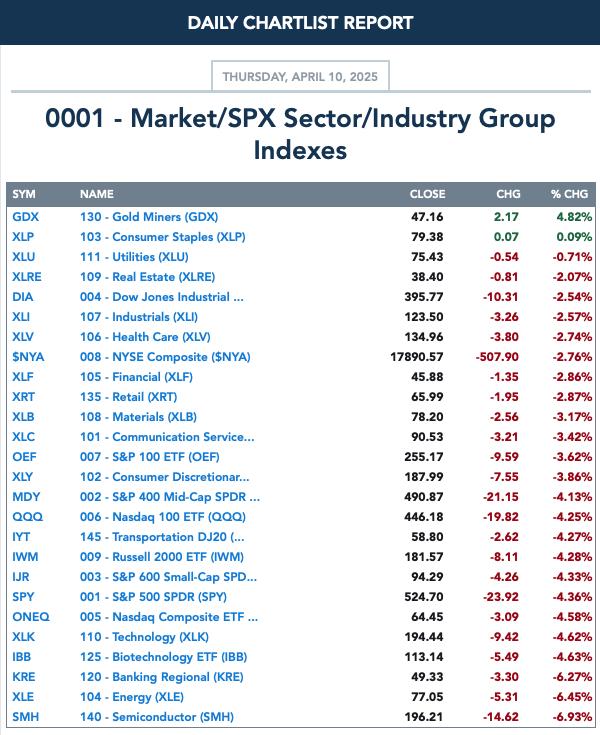
CLICK HERE for Carl's annotated Market Index, Sector, and Industry Group charts.
THE MARKET (S&P 500)
IT Trend Model: NEUTRAL as of 3/4/2025
LT Trend Model: BUY as of 3/29/2023
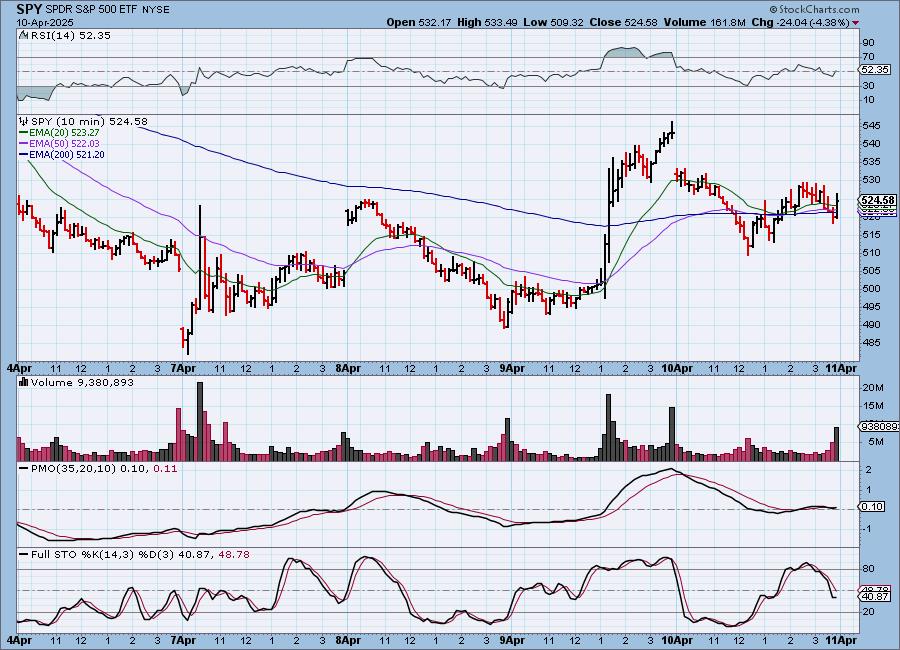
SPY 10-Minute Chart: Price gapped down on the open and fell from there. We saw failed midday rally followed by more downside. The 10-minute PMO did turn up in the last 10 minutes but we aren't optimistic.
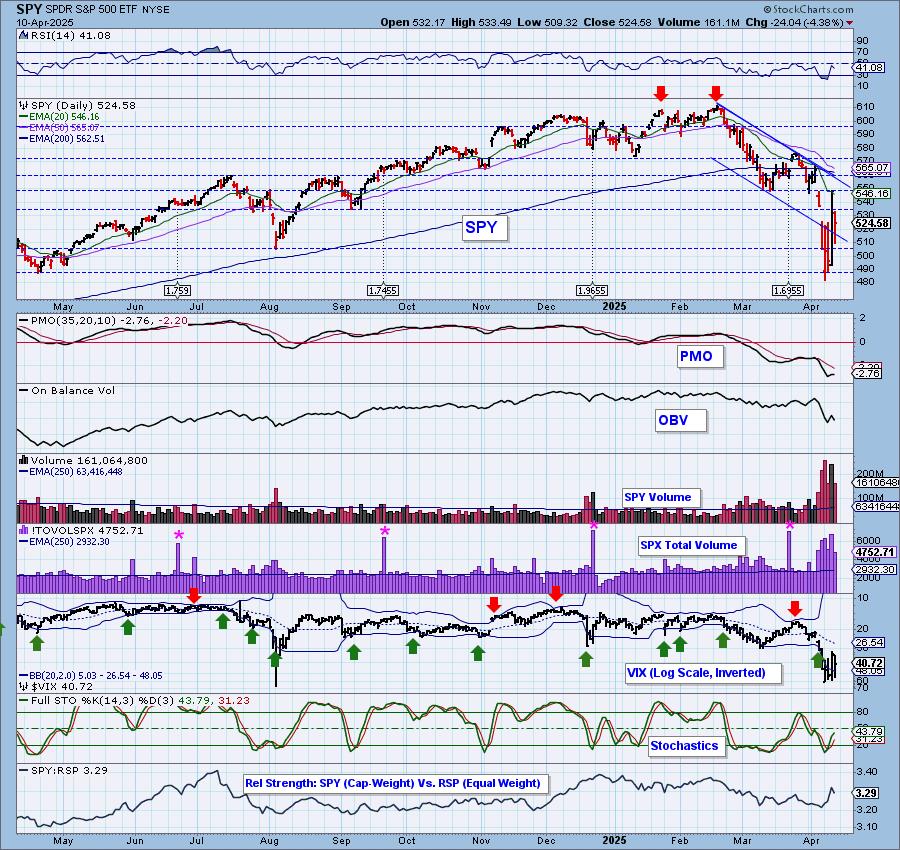
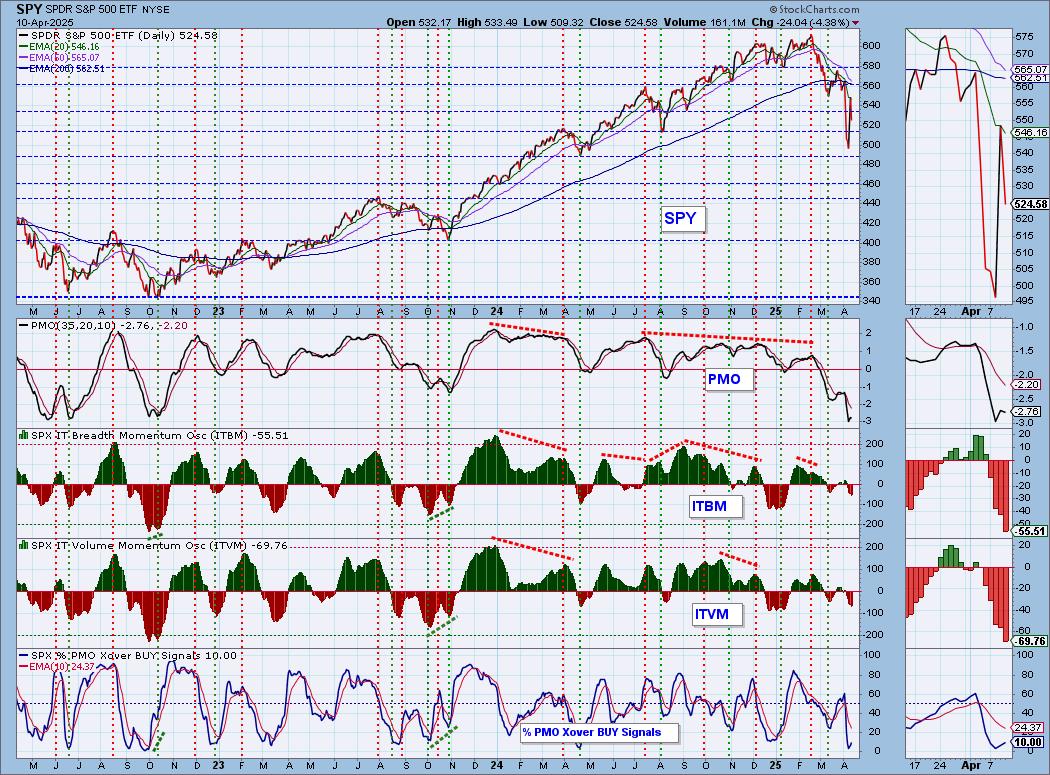
SPY Daily Chart: The market took some of yesterday's rally back. We did at least see a higher low, but the PMO has topped beneath its signal line which is especially bearish.
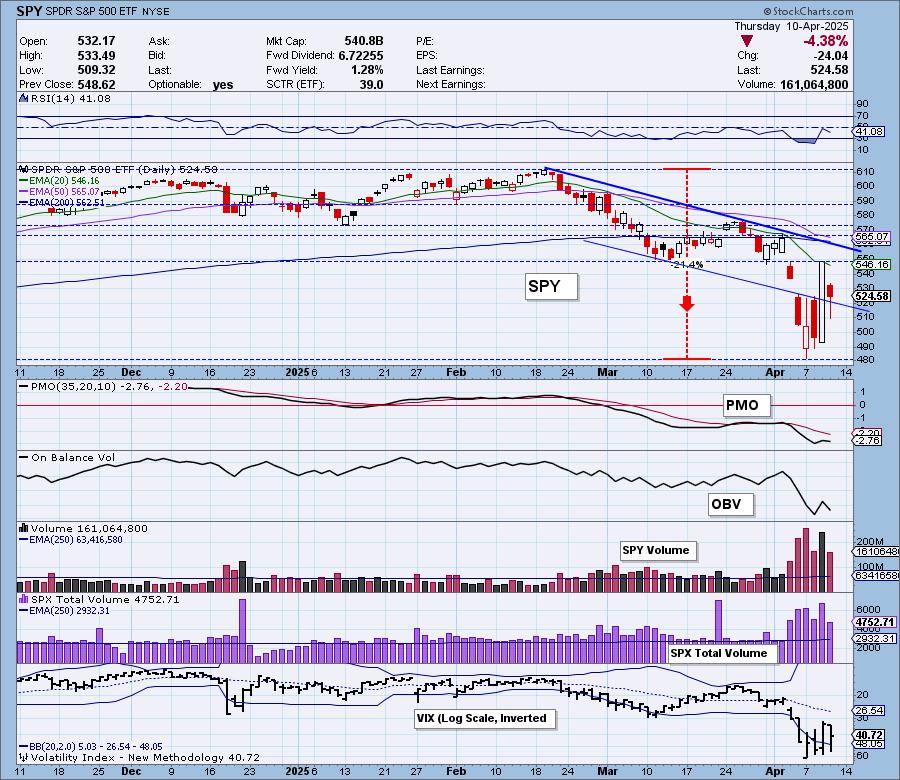
The VIX is still elevated and remains below its moving average on the inverted scale suggesting weakness. Stochastics are interestingly rising higher which gives bulls some hope that today's decline won't be contagious.
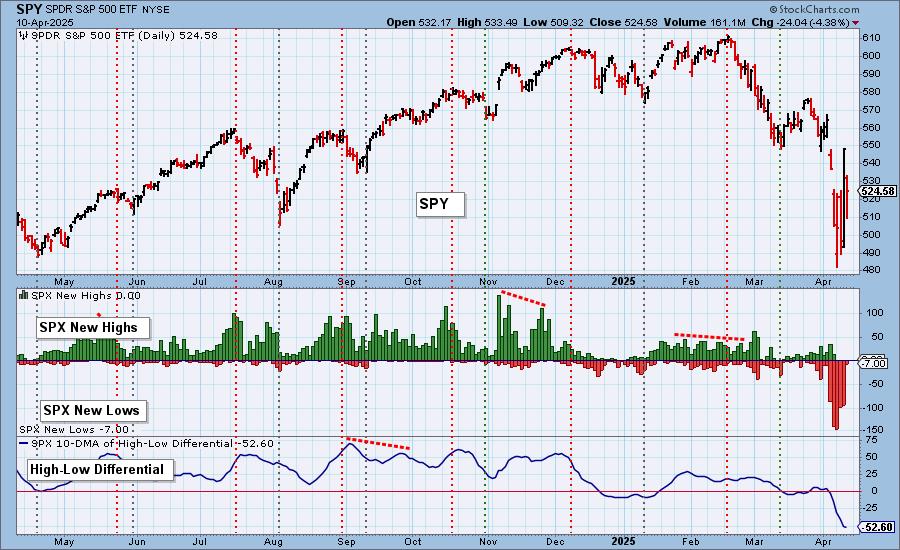
S&P 500 New 52-Week Highs/Lows: No New Highs were logged so the market remains beatdown. New Lows did contract a great deal on the decline which could be considered somewhat positive. However, the High-Low Differential is still in decline. Readings are the lowest they've been since 2022, but it could fall further based on 2022 which saw even lower readings.
Climax* Analysis: There were unanimous and strong climax readings today on the four relevant indicators, giving us a downside initiation climax. SPX Total Volume was 162% of the one-year daily average volume, which confirms the climax day but also implies a blowout. We shall see -- strange things are happening.
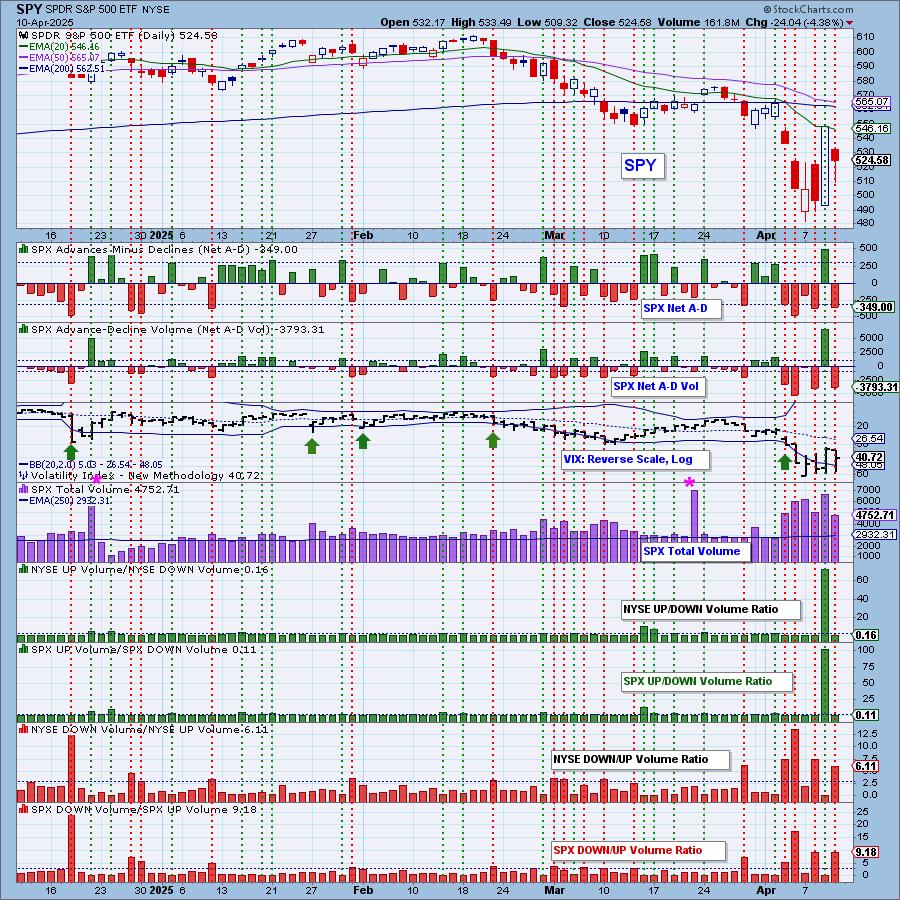
*A climax is a one-day event when market action generates very high readings in, primarily, breadth and volume indicators. We also include the VIX, watching for it to penetrate outside the Bollinger Band envelope. The vertical dotted lines mark climax days -- red for downside climaxes, and green for upside. Climaxes are at their core exhaustion events; however, at price pivots they may be initiating a change of trend.
Short-Term Market Indicators: The short-term market trend is DOWN and the condition is OVERSOLD.
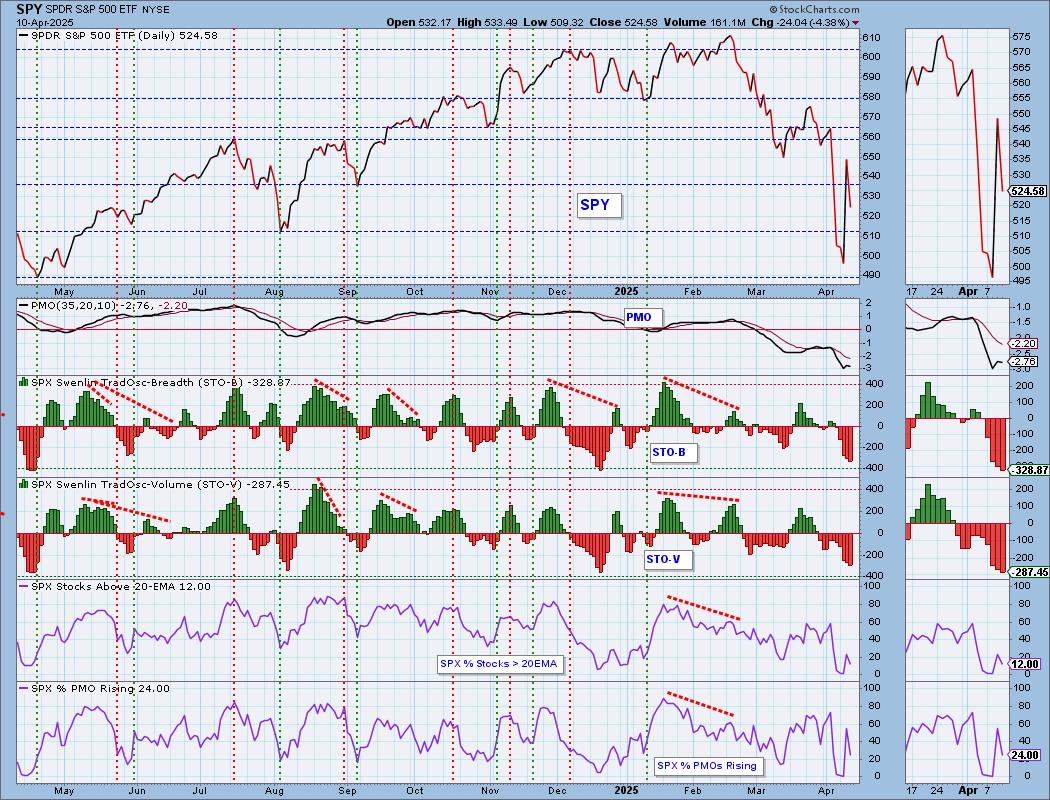
The Swenlin Trading Oscillators (STOs) continued to decline, but have reached oversold territory. As we continue to remind, oversold conditions can persist in a bear market so we don't want to get bullish yet. Participation bled out of the market with only 12% now above their 20-day EMAs. Rising PMOs were slashed on the decline. We have weak but not oversold readings on those indicators.
Intermediate-Term Market Indicators: The intermediate-term market trend is DOWN and the condition is NEUTRAL.
The ITBM and ITVM are both in decline still and really aren't in oversold territory so they can accommodate far more downside at this point. We did see a gain on PMO BUY Signals, but the indicator is still reading at a very low 10%. It is oversold.
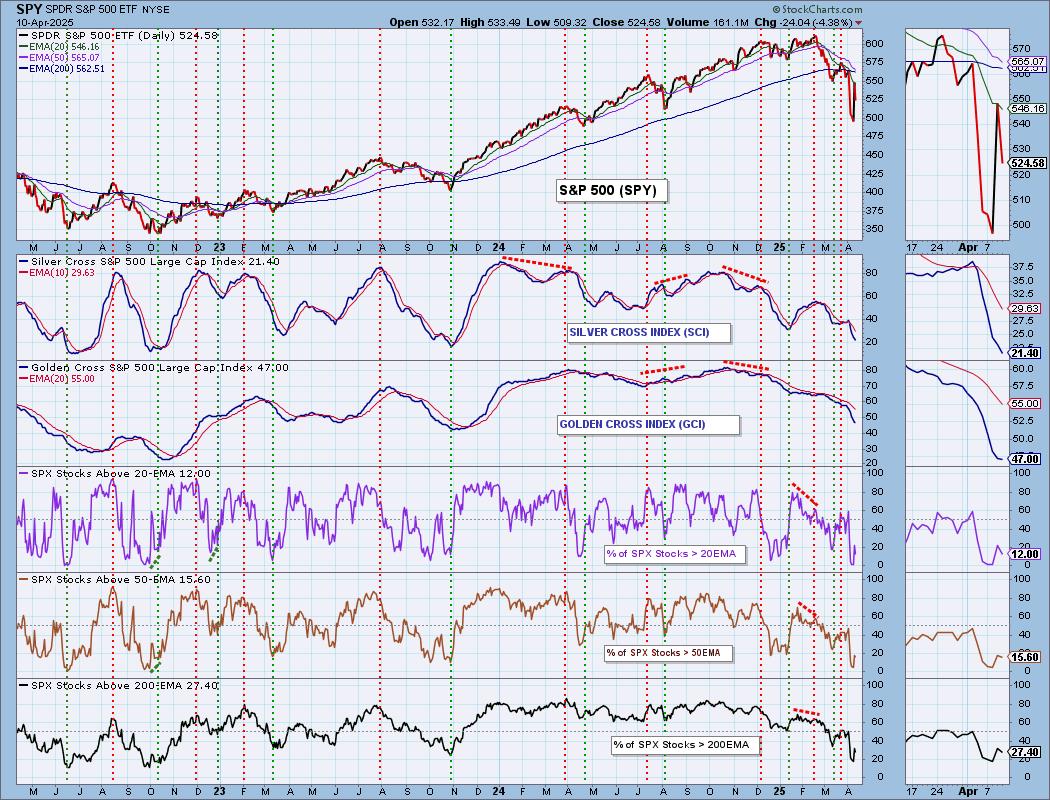
PARTICIPATION CHART (S&P 500): The following chart objectively shows the depth and trend of participation for the SPX in two time frames.
- Intermediate-Term - the Silver Cross Index (SCI) shows the percentage of SPX stocks on IT Trend Model BUY signals (20-EMA > 50-EMA). The opposite of the Silver Cross is a "Dark Cross" -- those stocks are, at the very least, in a correction.
- Long-Term - the Golden Cross Index (GCI) shows the percentage of SPX stocks on LT Trend Model BUY signals (50-EMA > 200-EMA). The opposite of a Golden Cross is the "Death Cross" -- those stocks are in a bear market.
The market bias is BEARISH in the intermediate and long terms.
As expected we lost participation across the board on the decline. Readings are very low, but could go even lower from here. The Silver Cross Index is declining and is below its signal line so the IT Bias is BEARISH. The Golden Cross Index is also in decline and is below its signal line so the LT Bias is BEARISH. Participation readings are lower than both the Silver and Golden Cross Indexes so they could definitely fall further from here. The Silver Cross Index is beginning to see somewhat oversold territory.
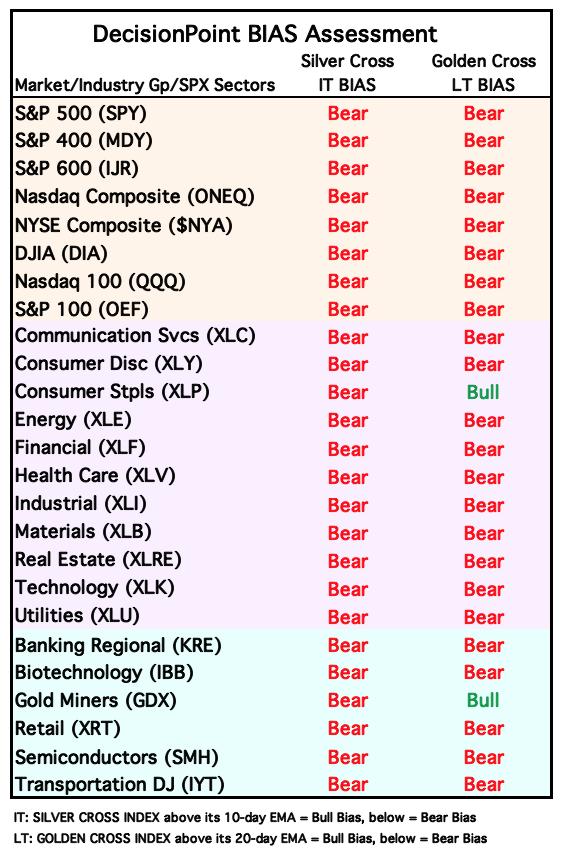
BIAS Assessment: The following table expresses the current BIAS of various price indexes based upon the relationship of the Silver Cross Index to its 10-day EMA (intermediate-term), and of the Golden Cross Index to its 20-day EMA (long-term). When the Index is above the EMA it is bullish, and it is bearish when the Index is below the EMA. The BIAS does not imply that any particular action should be taken. It is information to be used in the decision process.
The items with highlighted borders indicate that the BIAS changed today.
*****************************************************************************************************
CONCLUSION: Clearly, all the potential buyers were used up by Wednesday's close, and new buyers did not materialize today. Wednesday's humongous advance may have sparked hope that the bear market has ended, but today's strong down reaction tends to dampen that hope. We have oversold conditions popping up, but they could persist in this bear market. The Bias Table is about as bearish as it can get which is another 'oversold' type of reading, but again we can't count on that to turn this bus around. The downside initiation climax has us looking for more decline tomorrow. This has been a rollercoaster and quite unpredictable. One thing we can say is that we are likely to continue to experience more volatility.
Erin is 10% long, 0% short. (This is intended as information, not a recommendation.)
*****************************************************************************************************
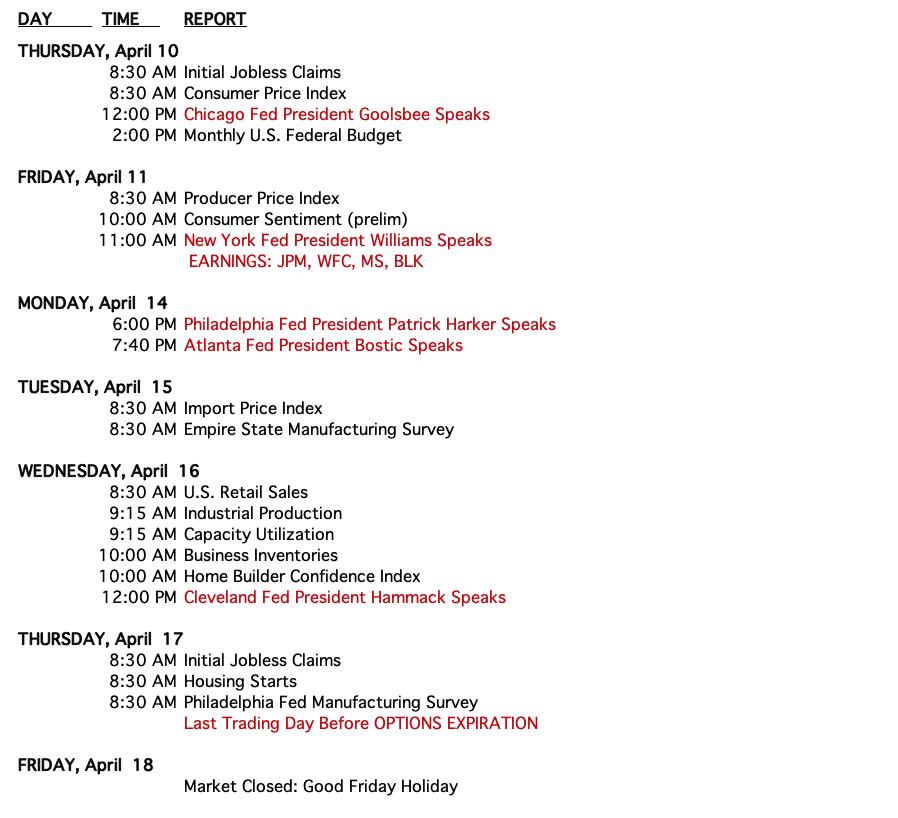
CALENDAR
BITCOIN
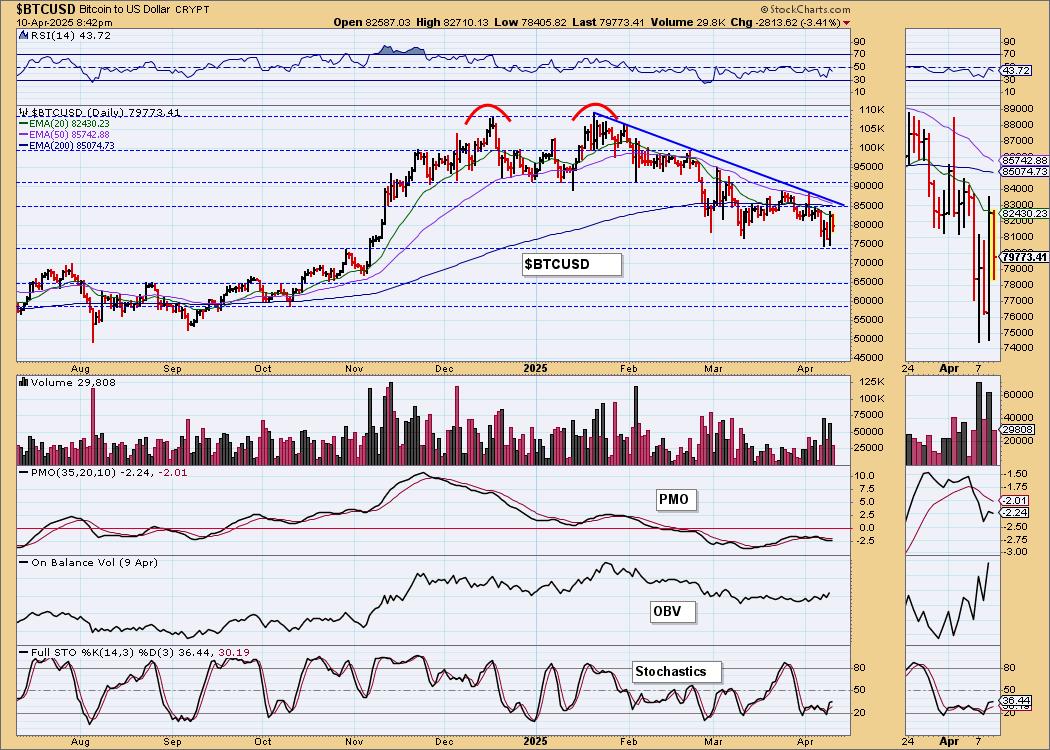
Bitcoin had a turnaround just like the market. It failed to test the declining tops trendline. The PMO has topped beneath its signal line while below the zero line which is very bearish. Stochastics aren't falling, but we aren't looking for rally right now based on the PMO. However, we could see this level of support still hold and then see consolidation.
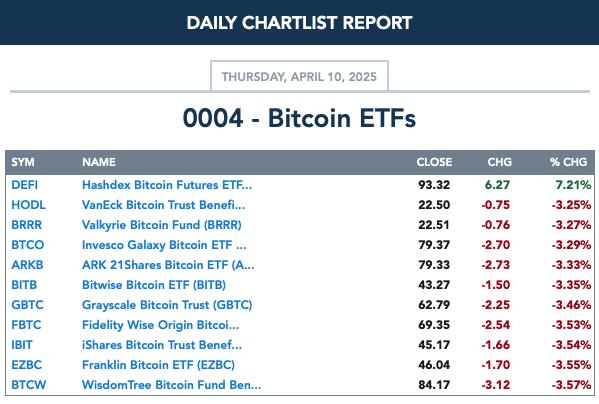
BITCOIN ETFs
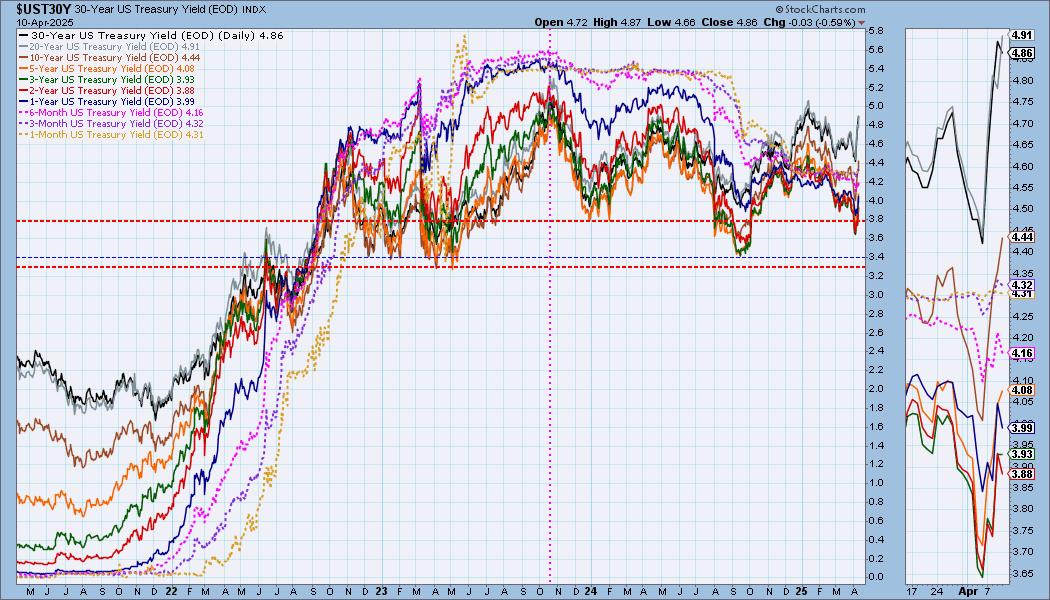
INTEREST RATES
Long-term yields are on their way upward and we think that will continue awhile longer. Declining trends have been broken on them with their rallies. Short-term yields should see some rise too, but they seem less interested.
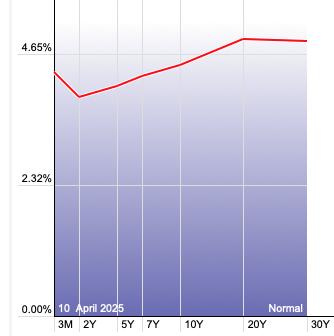
The Yield Curve Chart from StockCharts.com shows us the inversions taking place. The red line should move higher from left to right. Inversions are occurring where it moves downward.
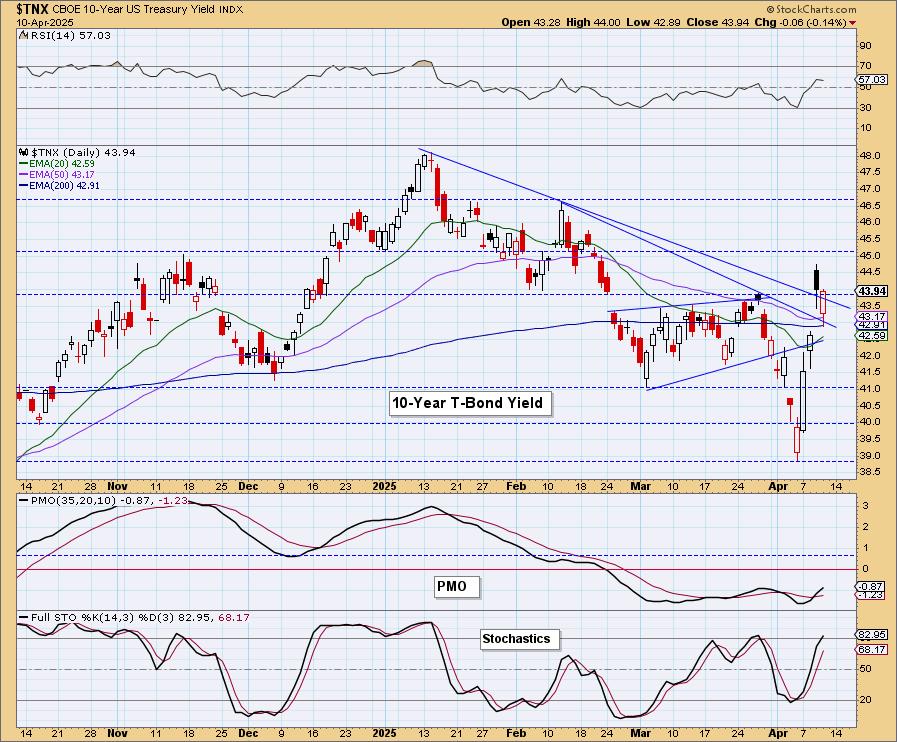
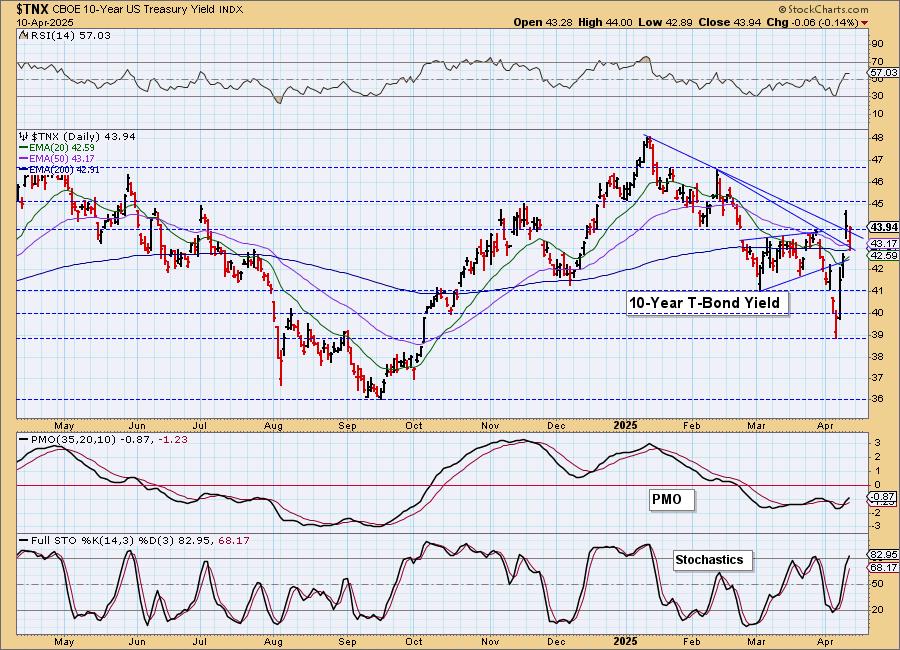
10-YEAR T-BOND YIELD
$TNX formed a bullish hollow red candlestick today that could mean a bounce tomorrow. The declining trend was broken and it remains above it for now. The PMO looks very encouraging, as do Stochastics so we would look for more upside.
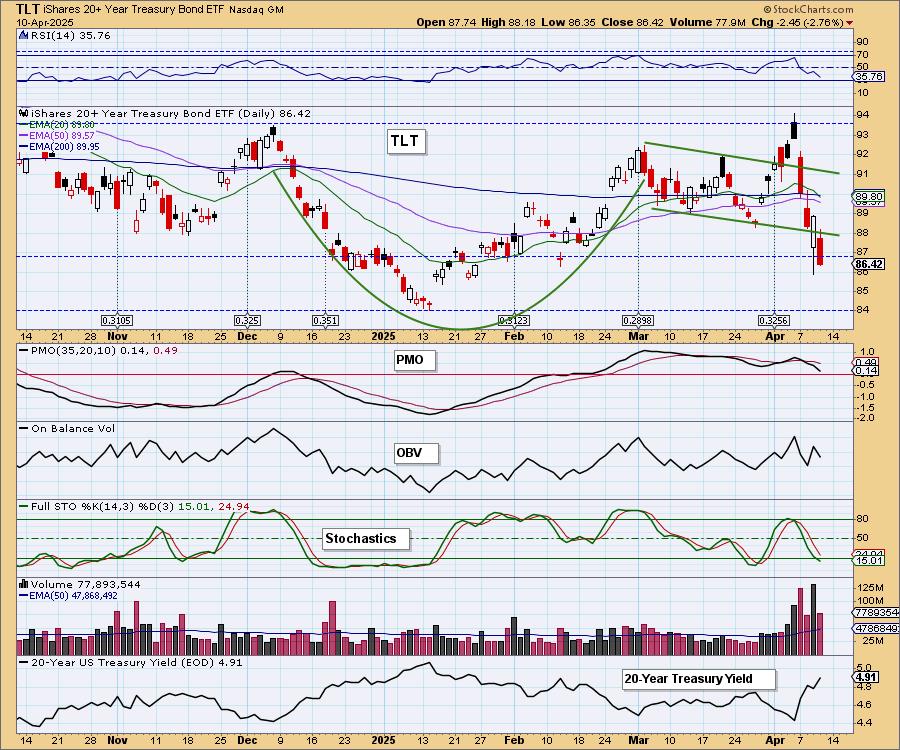
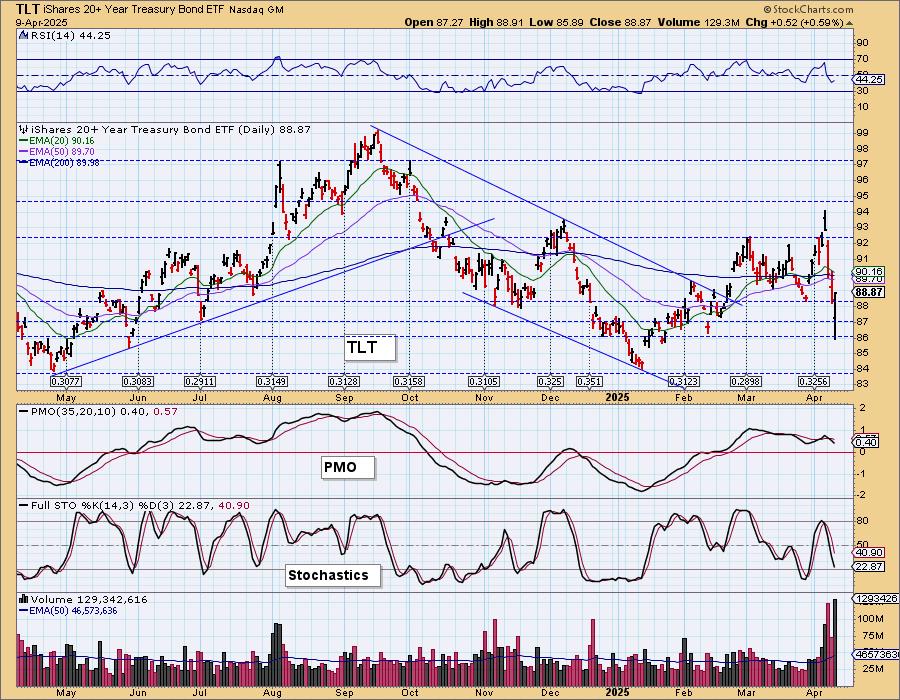
BONDS (TLT)
IT Trend Model: BUY as of 2/25/2025
LT Trend Model: SELL as of 12/13/2024
TLT Daily Chart: Bonds are in decline again as the yields are rising. We believe that condition will persist and we'll see even lower prices for TLT. The PMO is in decline and Stochastics are now reading below 20 indicating internal weakness. We're watching support at 84.00.
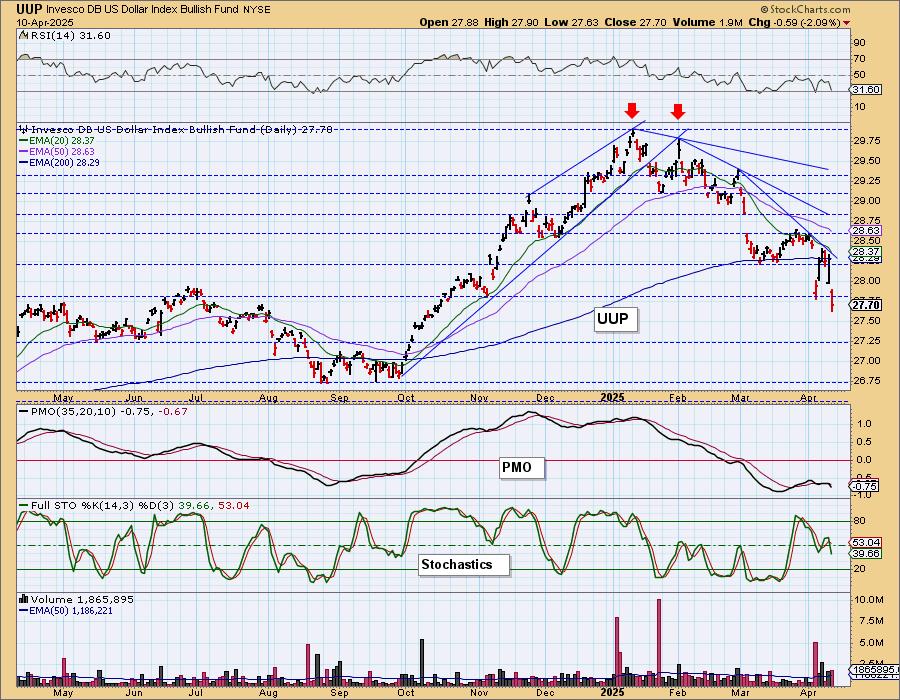
DOLLAR (UUP)
IT Trend Model: NEUTRAL as of 3/5/2025
LT Trend Model: BUY as of 5/25/2023
UUP Daily Chart: The Dollar remains in a bearish declining trend. The indicators look terrible right now so we will look for more downside with another loss of support likely. The PMO had a Crossover SELL Signal below the zero line and Stochastics are back in negative territory.

GOLD
IT Trend Model: BUY as of 1/10/2025
LT Trend Model: BUY as of 10/20/2023
GLD Daily Chart: Gold is off to the races again setting a new all-time high. This is one area of the market that is seeing the best results and we think Gold isn't done setting records. The PMO is flat above the zero line indicating pure strength. The RSI is not overbought yet despite this strong rally. We pointed out yesterday that the Gold Volatility Index ($GVZ) was puncturing its lower Bollinger Band on the inverted scale and that tends to be bullish for Gold.
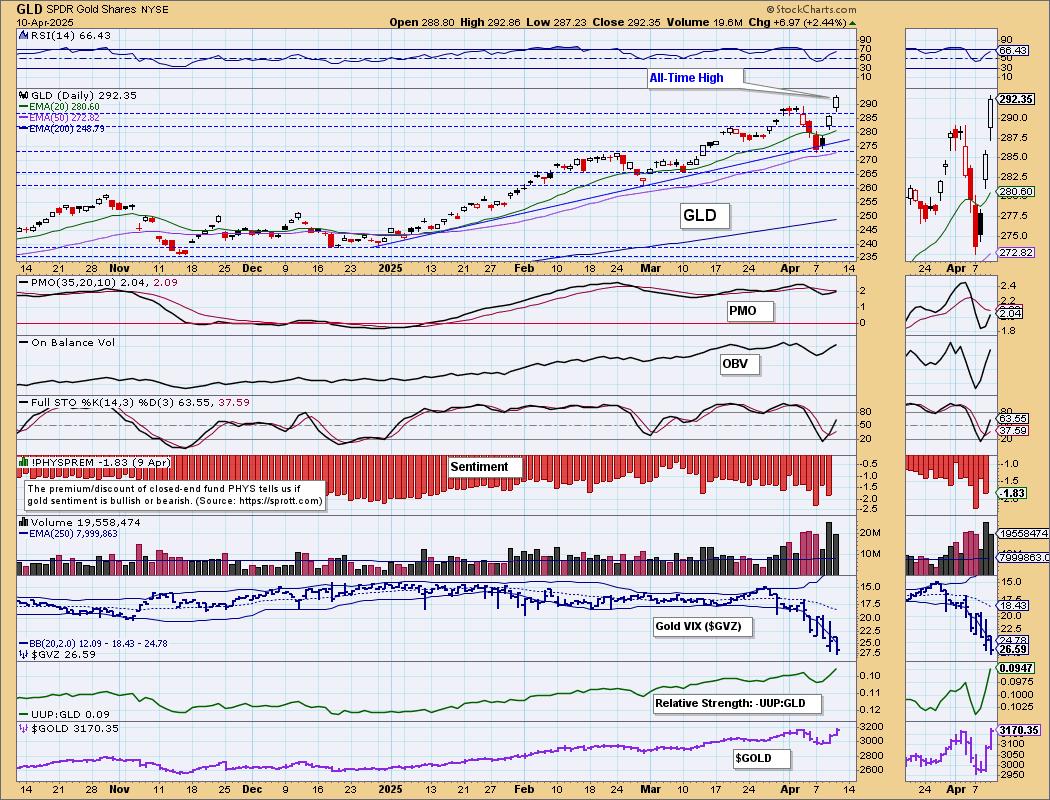
Gold is now clearly outperforming the Dollar right now and has been for some time. This will continue to work in its favor.

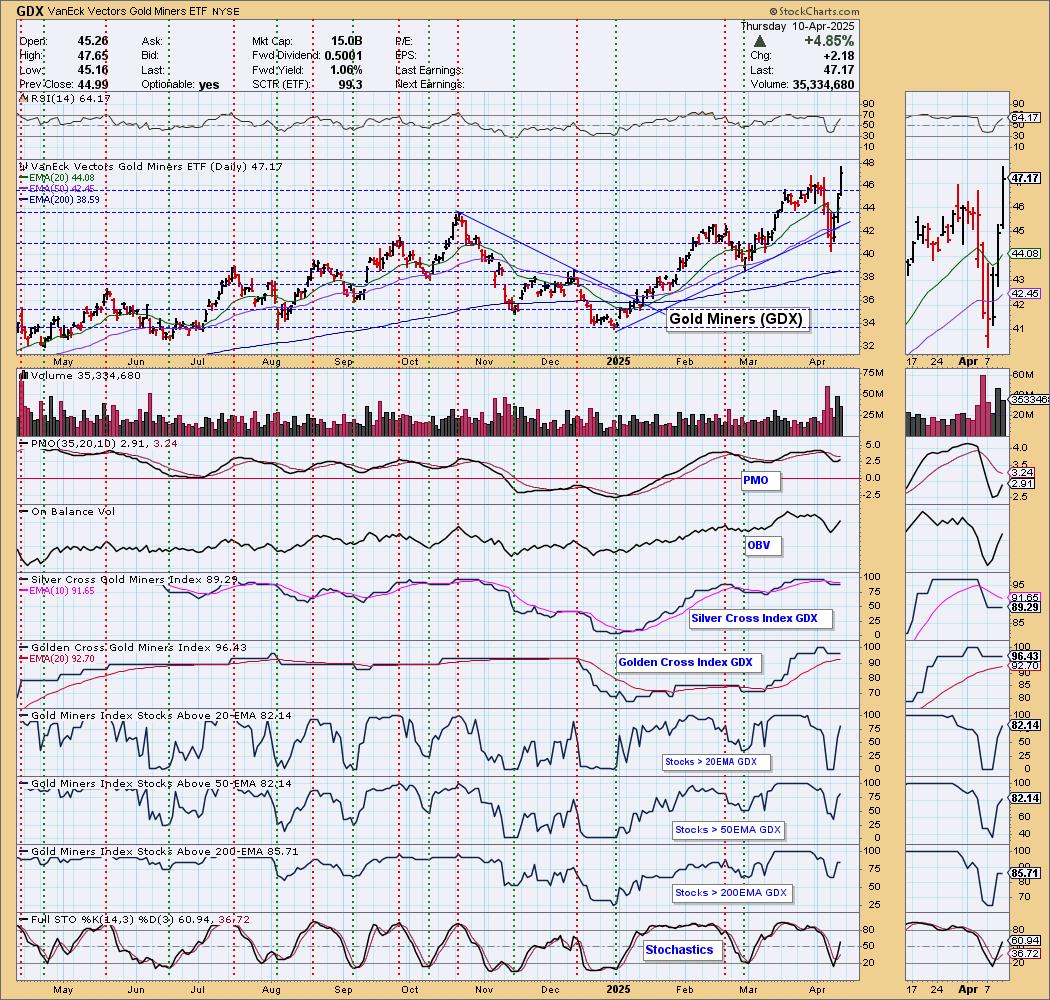
GOLD MINERS (GDX) Daily Chart: Gold Miners broke out on today's rally. They've really made a turnaround and looking at some of the charts of individual Gold Miners, we see a lot of potential for followthrough. Participation has healed itself and the Silver Cross Index is turning back up. The PMO is also rising again and in spite of the rally, the RSI is not yet overbought so we could certainly see more upside here.
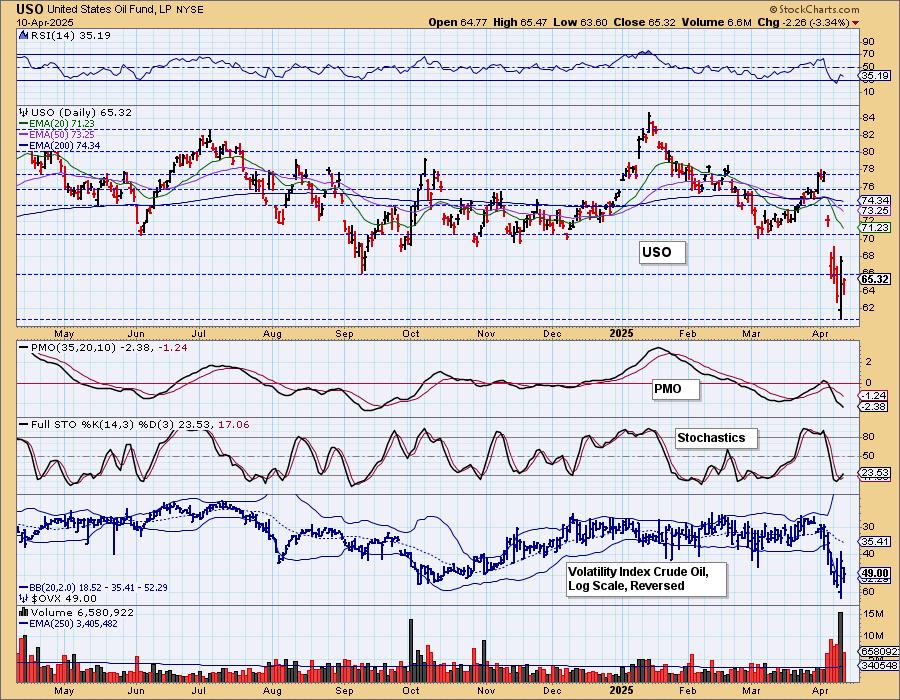
CRUDE OIL (USO)
IT Trend Model: NEUTRAL as of 2/27/2025
LT Trend Model: SELL as of 3/18/2025
USO Daily Chart: Not a good day for Crude. The rally really looked promising and it is coming off support (seen on a weekly chart). We do have a bullish hollow red candlestick but then yesterday we had a bullish engulfing and it didn't produce. Production is still plentiful and as we've been saying, the administration will be working hard to keep prices low so we have to wonder if the current support level will hold.
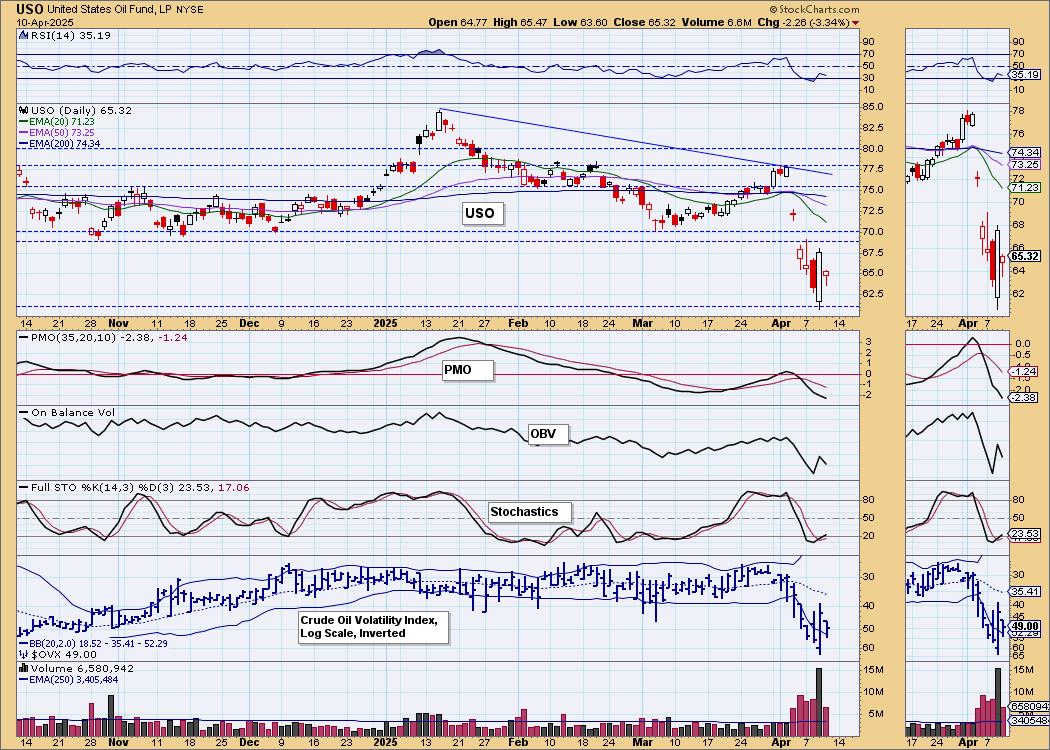
The picture is not as bullish as yesterday. Price is below the September low again and that could be a problem based on the falling PMO in negative territory.
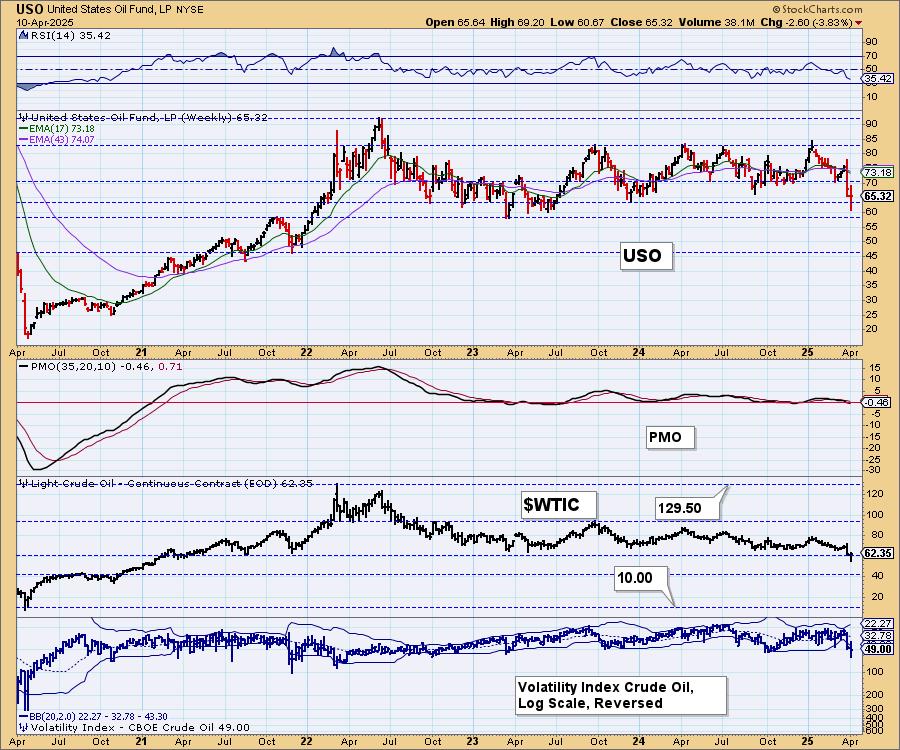
We can see that we are very close to long-term support and given the declining weekly PMO we're not so sure it will hold this time around. Notice that $WTIC has broken below its 2023 low.
Good Luck & Good Trading!
Erin Swenlin and Carl Swenlin
Technical Analysis is a windsock, not a crystal ball. --Carl Swenlin
(c) Copyright 2025 DecisionPoint.com
Disclaimer: This blog is for educational purposes only and should not be construed as financial advice. The ideas and strategies should never be used without first assessing your own personal and financial situation, or without consulting a financial professional. Any opinions expressed herein are solely those of the author, and do not in any way represent the views or opinions of any other person or entity.
DecisionPoint is not a registered investment advisor. Investment and trading decisions are solely your responsibility. DecisionPoint newsletters, blogs or website materials should NOT be interpreted as a recommendation or solicitation to buy or sell any security or to take any specific action.
NOTE: The signal status reported herein is based upon mechanical trading model signals, specifically, the DecisionPoint Trend Model. They define the implied bias of the price index based upon moving average relationships, but they do not necessarily call for a specific action. They are information flags that should prompt chart review. Further, they do not call for continuous buying or selling during the life of the signal. For example, a BUY signal will probably (but not necessarily) return the best results if action is taken soon after the signal is generated. Additional opportunities for buying may be found as price zigzags higher, but the trader must look for optimum entry points. Conversely, exit points to preserve gains (or minimize losses) may be evident before the model mechanically closes the signal.
Helpful DecisionPoint Links:
DecisionPoint Alert Chart List
DecisionPoint Golden Cross/Silver Cross Index Chart List
DecisionPoint Sector Chart List
Price Momentum Oscillator (PMO)