
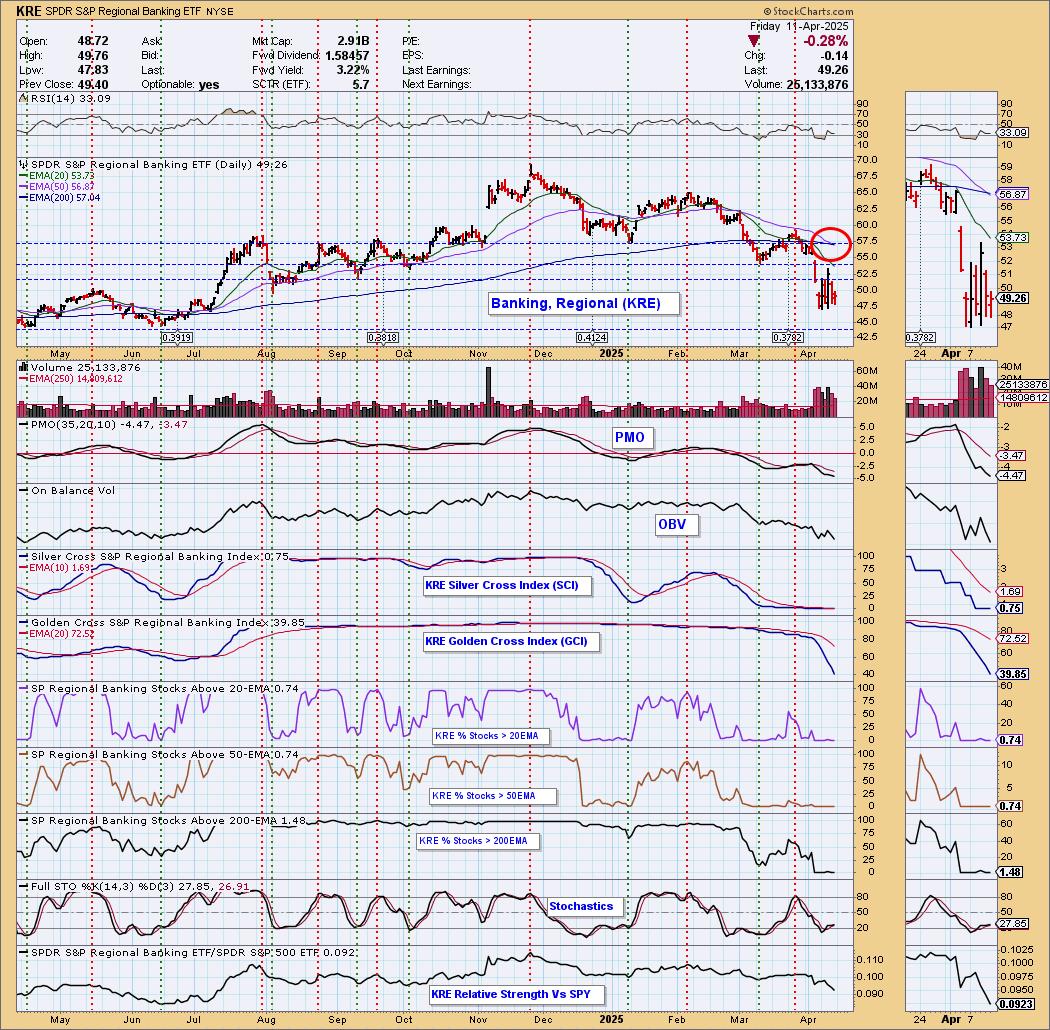
Today the Regional Banking ETF (KRE) 50-day EMA crossed down through the 200-day EMA (Death Cross), generating an IT Trend Model SELL Signal. KRE is in a declining trend and is stuck beneath resistance. Notice that participation is nearly invisible across the board. The PMO is falling and the Silver Cross Index is almost at zero. There is incredible weakness here and while readings are oversold, they have been for some time and it hasn't done anything for KRE. We would look for the next line of support to be tested.
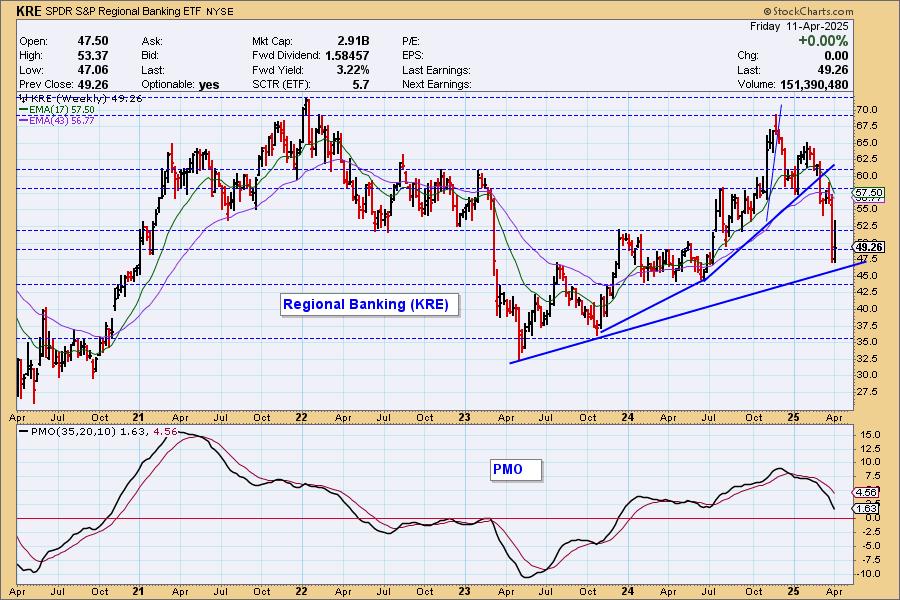
The weekly chart is ugly with the deep decline taking out the rising trend. It is still holding the long-term rising trend but with the weekly PMO accelerating downward we wonder if that can hold.
The DecisionPoint Alert Weekly Wrap presents an end-of-week assessment of the trend and condition of the Stock Market, the U.S. Dollar, Gold, Crude Oil, and Bonds. The DecisionPoint Alert daily report (Monday through Thursday) is abbreviated and gives updates on the Weekly Wrap assessments.
Watch the latest episode of DecisionPoint on our YouTube channel here!
MARKET/SPX SECTOR/INDUSTRY GROUP INDEXES
Change Today: 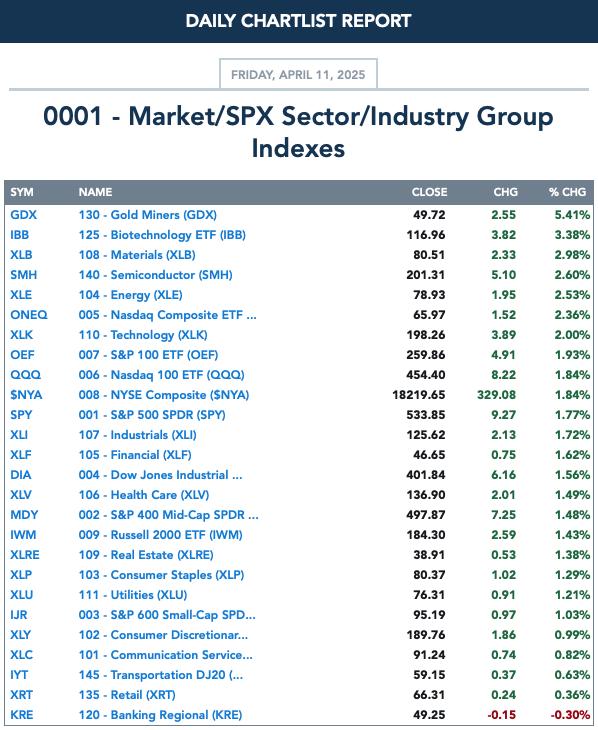
Change for the Week:
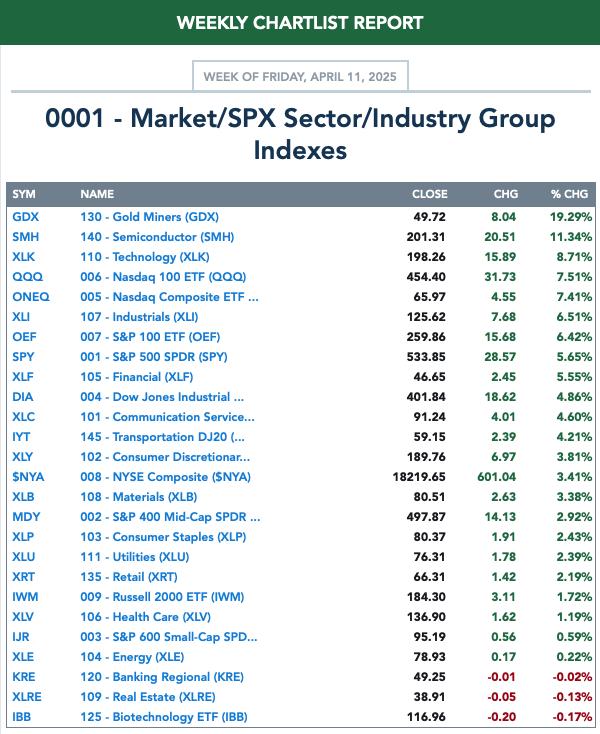
CLICK HERE for Carl's annotated Market Index, Sector, and Industry Group charts.
THE MARKET (S&P 500)
IT Trend Model: NEUTRAL as of 3/4/2025
LT Trend Model: BUY as of 3/29/2023
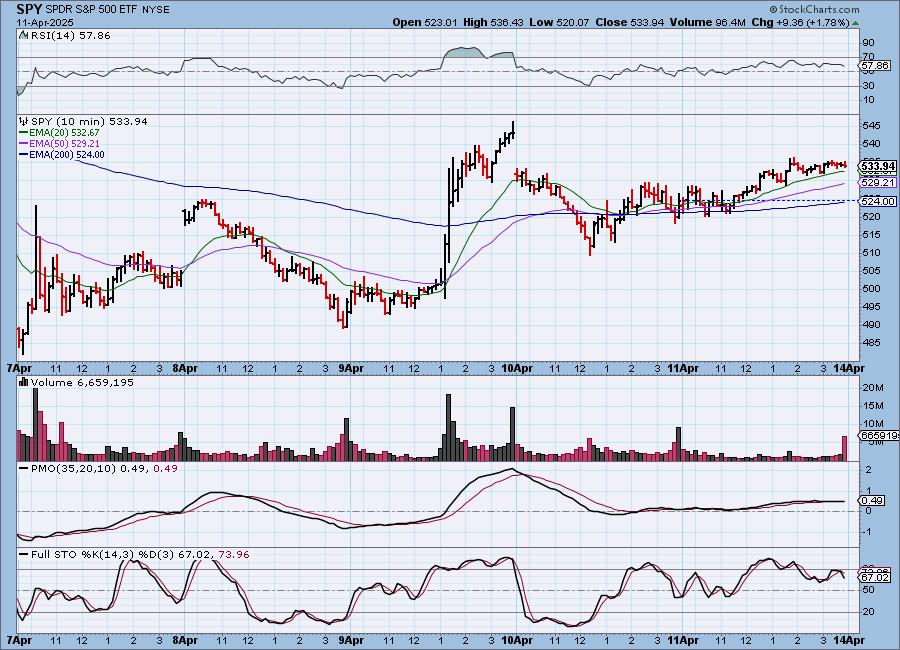
SPY 10-Minute Chart: Price was indecisive in the morning, but after that we did see a nice rally higher. Not enough to recapture Wednesday's highs, but certainly welcomed as the index finished positive this week.
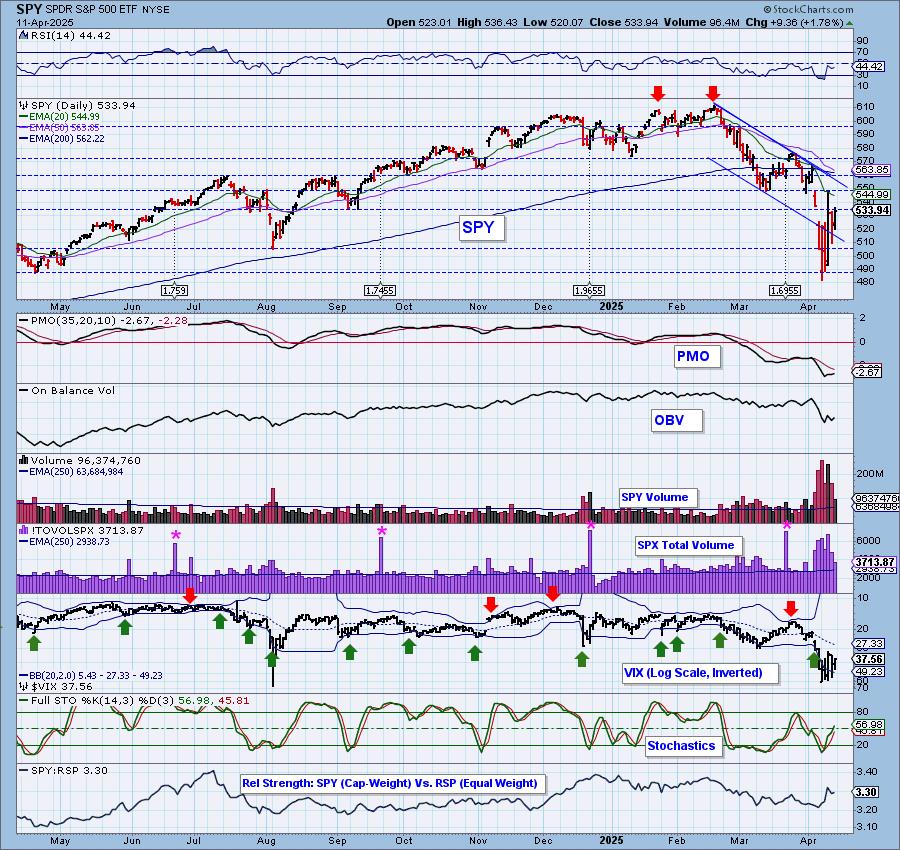
SPY Daily Chart: We do have a very short-term rising trend but we see this as another bear market rally. Should we see the top of the declining trend channel broken, we'll reevaluate our bearish stance. The PMO is rising slightly, but entirely convincing.

The VIX remains below its moving average on the inverted scale so we see weakness. Stochastics however are on the rise and do look bullish. Stochastics do seem to suggest that we'll see some upside followthrough on today's rally.
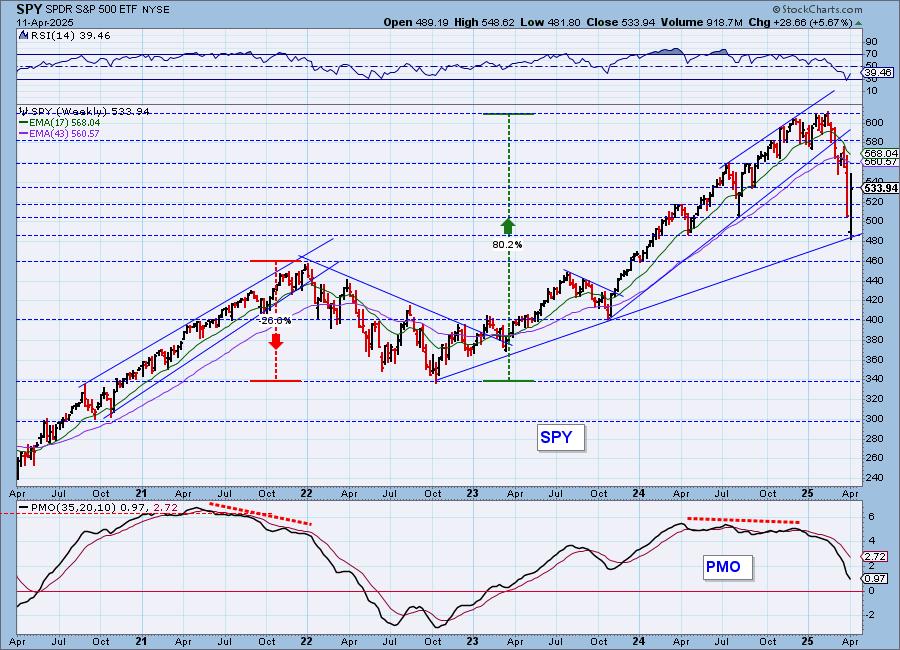
SPY Weekly Chart: The long-term rising trend is barely intact right now but this is a good place to look for some upside. The weekly PMO is very negative however so that rising trend is definitely in jeopardy.
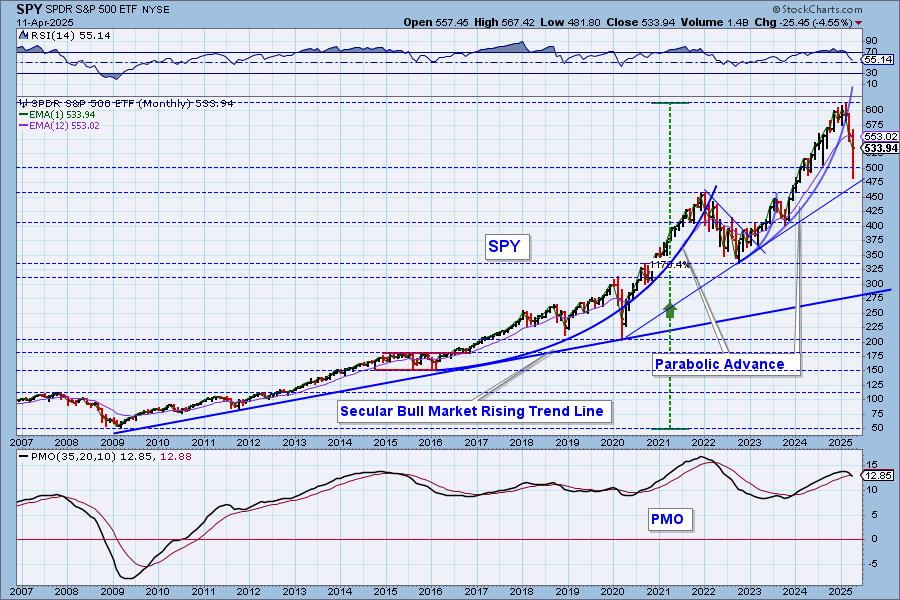
SPY Monthly Chart: Even though it is not the end of the month, we thought it interesting to present the chart. The parabolic advance collapsed as they usually do with this bear market move. The monthly PMO has currently fallen below its signal line. The signal won't be official until the month closes out, but it is sobering.
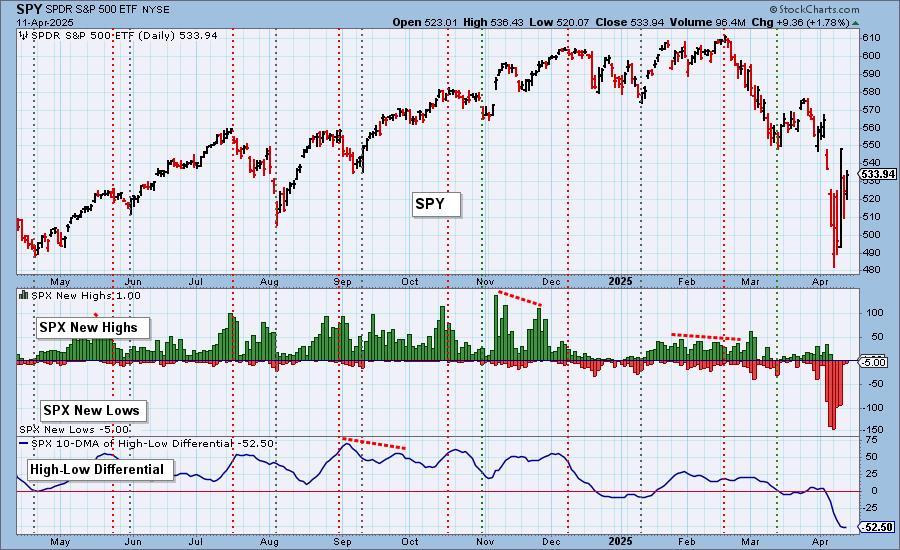
New 52-Week Highs/Lows: We still saw some New Lows with only one New High. We like that New Lows have been contracting as it does tend to confirm the rally. The High-Low Differential is still officially falling but it is positive to see its deceleration.
Climax Analysis: There were unanimous climax readings on the four relevant indicators, giving us an upside initiation climax. These alternating climaxes are not being much help and they aren't producing the desired results so we should take this climax with a grain of salt.
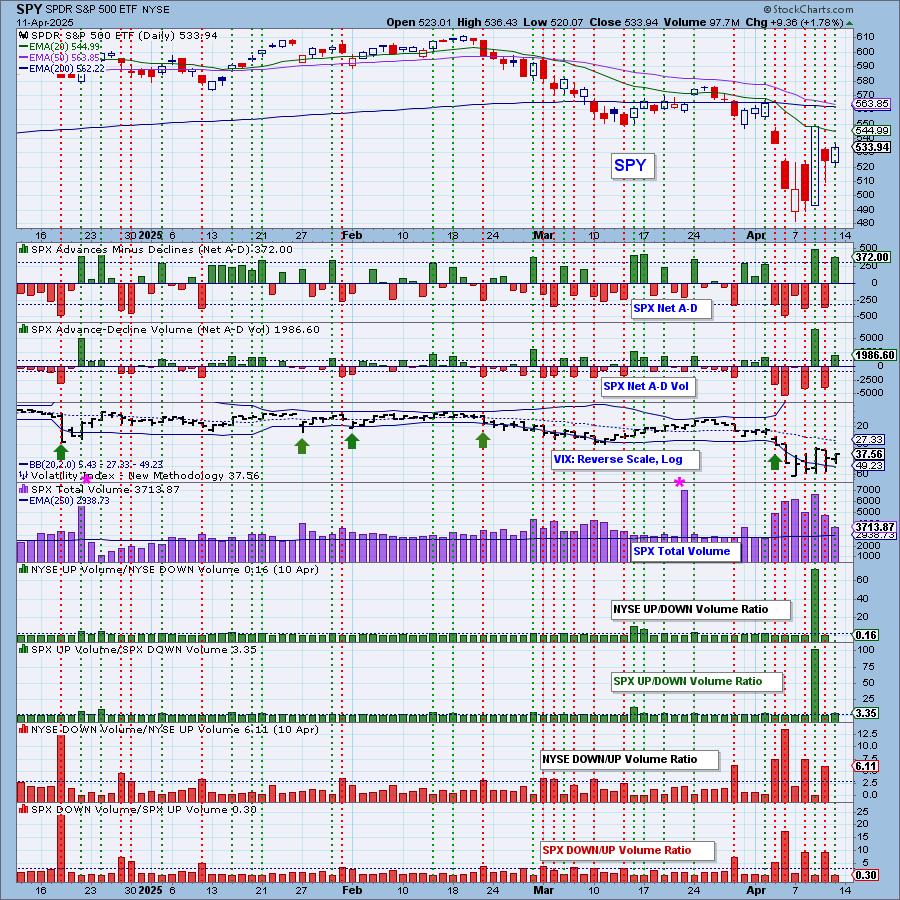
*A climax is a one-day event when market action generates very high readings in, primarily, breadth and volume indicators. We also include the VIX, watching for it to penetrate outside the Bollinger Band envelope. The vertical dotted lines mark climax days -- red for downside climaxes, and green for upside. Climaxes are at their core exhaustion events; however, at price pivots they may be initiating a change of trend.
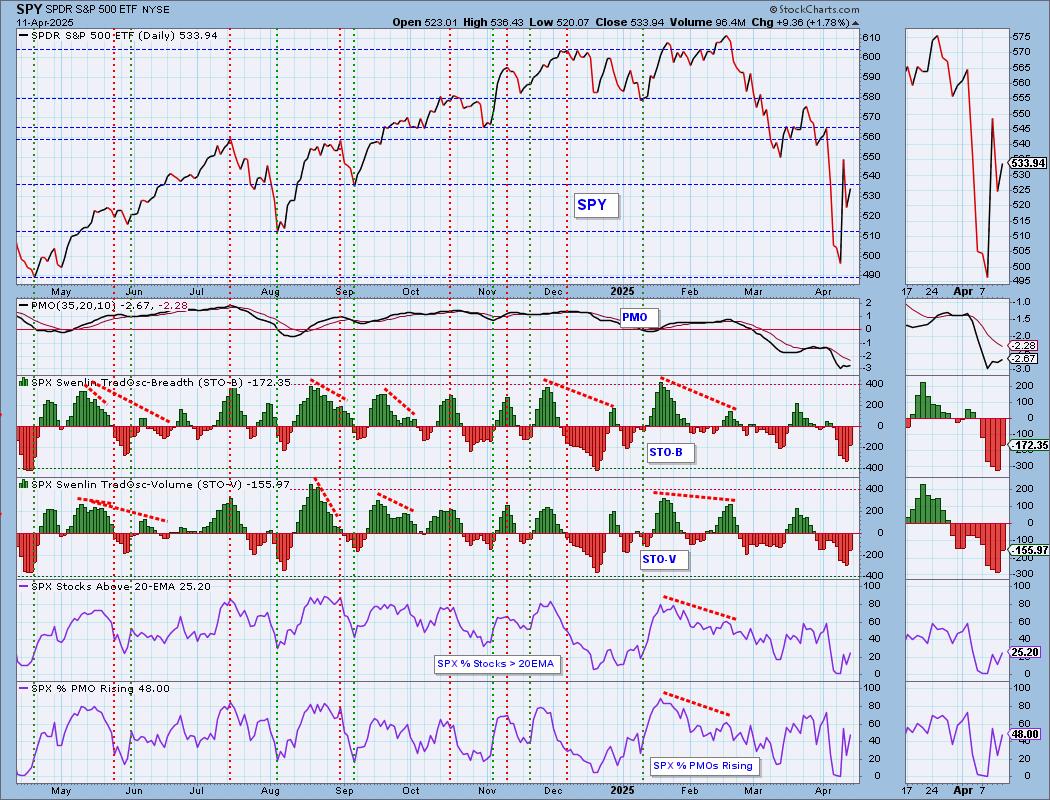
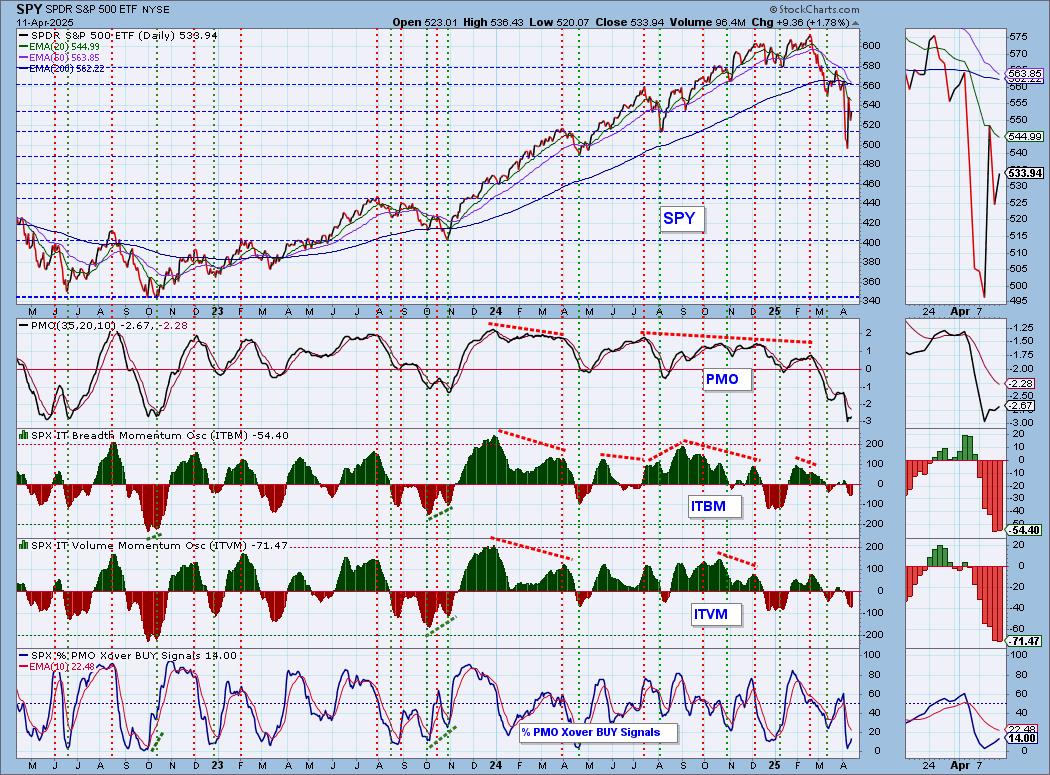
Short-Term Market Indicators: The short-term market trend is DOWN and the condition is OVERSOLD.
It looks like Swenlin Trading Oscillators (STOs) are on board for more rally as they have turned back up out of oversold territory. This is a good sign for the short term. Participation is still thin at 25%, but we do see nearly half of the index with rising PMOs now.
Intermediate-Term Market Indicators: The intermediate-term market trend is DOWN and the condition is NEUTRAL.
The ITBM reversed higher today alongside the STOs which is a mild confirmation considering the ITVM is still moving lower. They really haven't hit oversold territory yet so they do seem to imply that more downside may need to be absorbed. We're getting more PMO BUY Signals, but we only have a meager 14% holding them.
_______
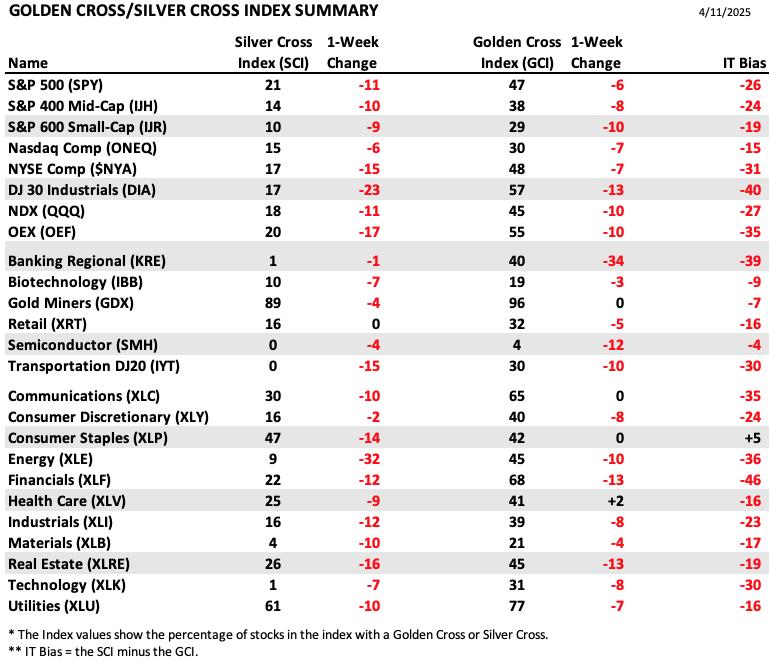
PARTICIPATION TABLES: The following tables summarize participation for the major market indexes and sectors. The 1-Week Change columns inject a dynamic aspect to the presentation. There are three groups: Major Market Indexes, Miscellaneous Industry Groups, and the 11 S&P 500 Sectors.
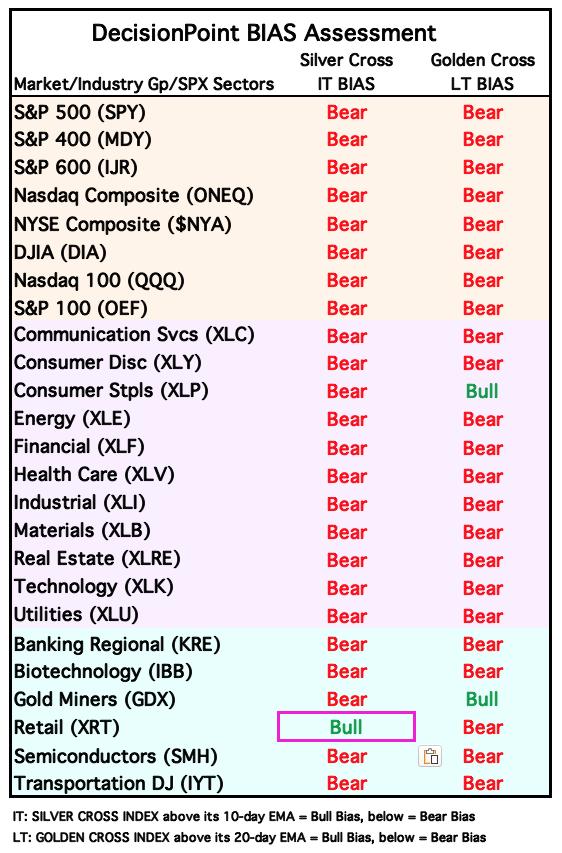
All of the IT Biases but one are negative. This is a sign of a bear market. Nearly all have lower readings on the Silver Cross Indexes which is why those biases are negative.
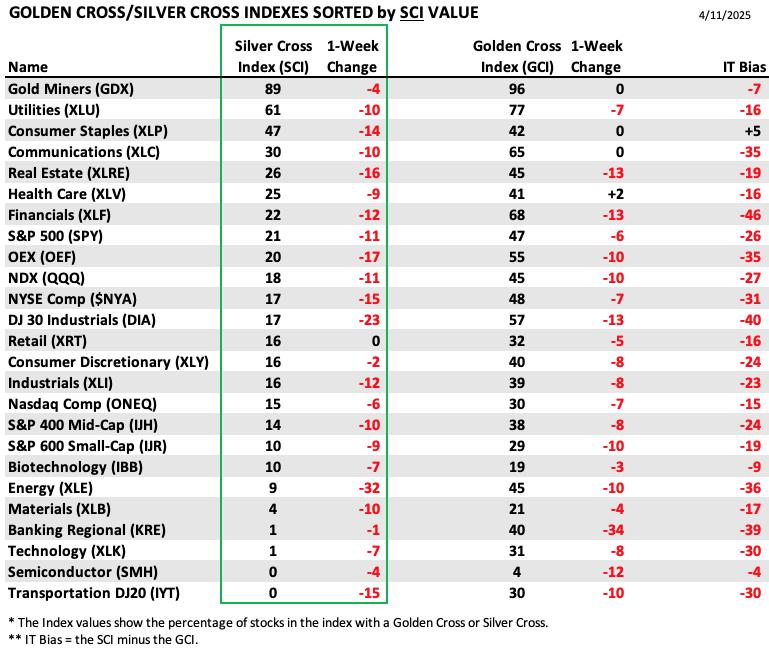
This table is sorted by SCI values. This gives a clear picture of strongest to weakest index/sector in terms of intermediate-term participation.
In spite of Wednesday's rally and a positive weekly close, none of the entities we follow saw gains on the Silver Cross Index. This is another sign we are in a bear market.
Retail didn't move, but at least it didn't decline as all the others. Energy which is failing saw the biggest loss to its Silver Cross Index reading.
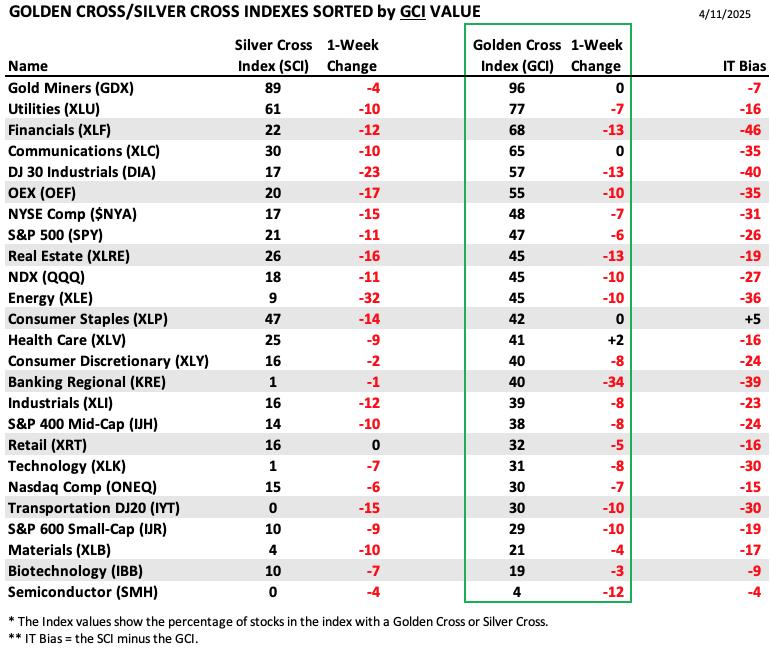
This table is sorted by GCI values. This gives a clear picture of strongest to weakest index/sector in terms of long-term participation.
Gold Miners clearly hold the strength right now as they hold the highest SCI and GCI values. It's pullback did take away a few points on the SCI this week but it is rallying strongly right now and should see gains next week unless we see a decline in Gold.
The weakest are Semiconductors which hold the lowest SCI and GCI readings. We may see this area perk up but if the bear market continues they will still be under pressure.
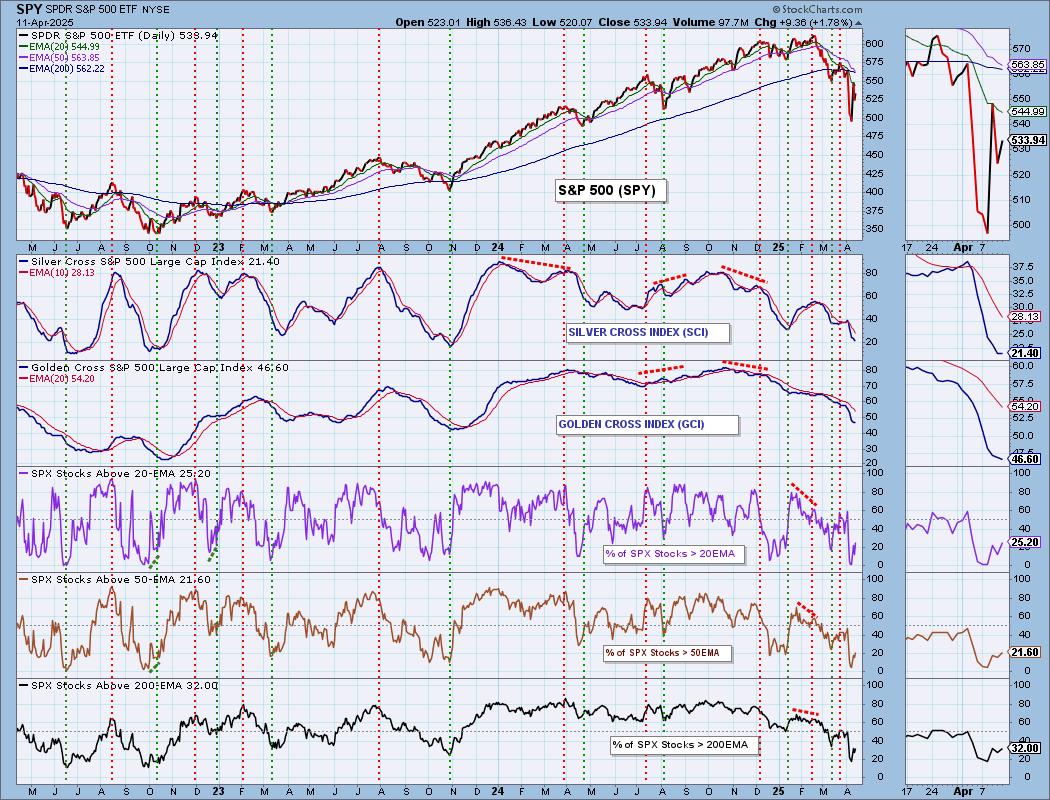
PARTICIPATION CHART (S&P 500): The following chart objectively shows the depth and trend of participation for the SPX in two time frames.
- Intermediate-Term - the Silver Cross Index (SCI) shows the percentage of SPX stocks on IT Trend Model BUY signals (20-EMA > 50-EMA). The opposite of the Silver Cross is a "Dark Cross" -- those stocks are, at the very least, in a correction.
- Long-Term - the Golden Cross Index (GCI) shows the percentage of SPX stocks on LT Trend Model BUY signals (50-EMA > 200-EMA). The opposite of a Golden Cross is the "Death Cross" -- those stocks are in a bear market.
The market bias is BEARISH in the intermediate and long terms.
Participation is perking up right now which is encouraging, but it is still well below our bullish 50% threshold. Readings did gain enough to halt the Silver Cross Index's decline. It will likely turn higher should participation stay at current levels or move higher. It is well below its signal line so the IT Bias is BEARISH. The Golden Cross Index remains in decline and under the bullish 50% threshold. It is also below its signal line so the LT Bias is also BEARISH.
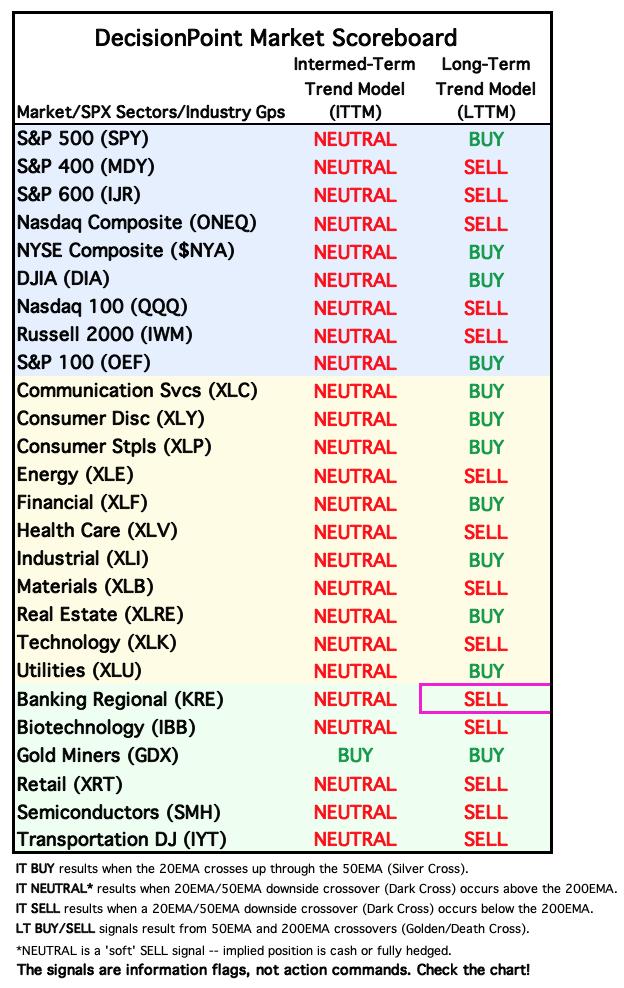
BIAS Assessment: The following table expresses the current BIAS of various price indexes based upon the relationship of the Silver Cross Index to its 10-day EMA (intermediate-term), and of the Golden Cross Index to its 20-day EMA (long-term). When the Index is above the EMA it is bullish, and it is bearish when the Index is below the EMA. The BIAS does not imply that any particular action should be taken. It is information to be used in the decision process.
The items with highlighted borders indicate that the BIAS changed today.
*****************************************************************************************************
CONCLUSION: There are some positives to report this week. The market closed higher on the week. The PMO is rising again with Stochastics. The STOs turned up today as did the ITBM. New Lows are shrinking and we have a new upside initiation climax. We don't want to get too bullish here, but it does look like we could see higher prices next week should these indicators hold up. Participation is no longer oversold and it is rising again. This volatility is difficult to maneuver around. We do see some signs this bear market rally could see followthrough, but the current market environment is very unpredictable as climaxes haven't been working out. Likely we will need to take our cue from the open on Monday. We do note that earnings from key bellwethers JPM, WFC, MS and BLK were received well which does lean toward a rally on Monday.
Erin is 10% long, 0% short. (This is intended as information, not a recommendation.)
*****************************************************************************************************
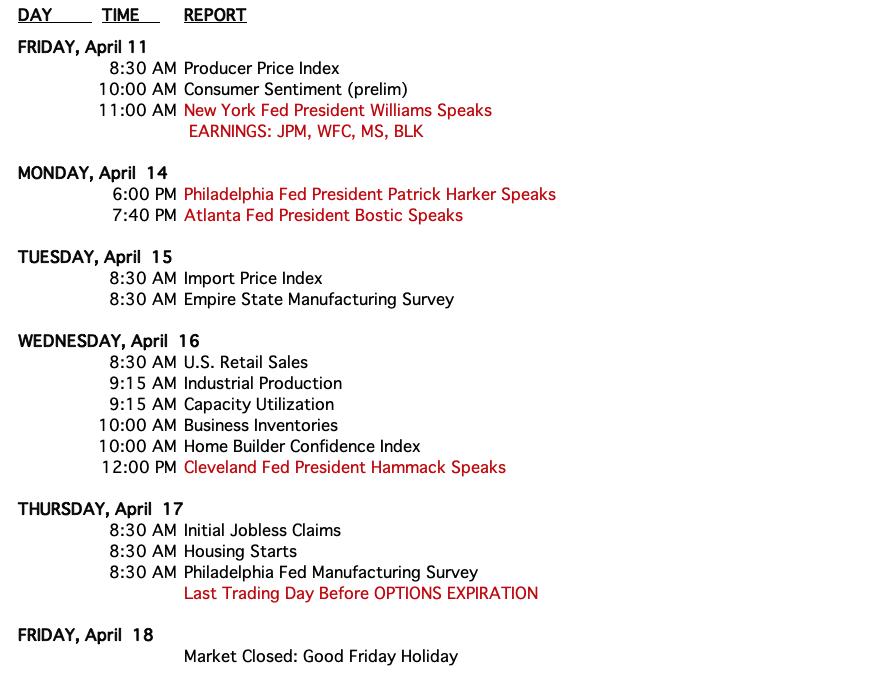
CALENDAR
BITCOIN
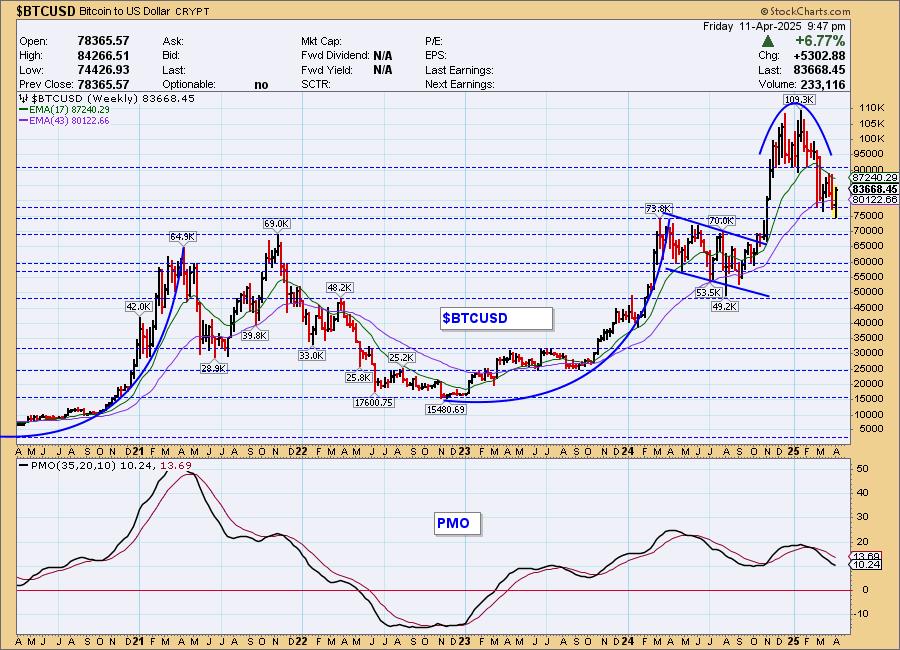
Bitcoin Daily Chart: Bitcoin is rallying again with the market. The PMO is on a new Crossover BUY Signal and Stochastics are rising. We also see that the RSI has moved into positive territory. This is usually the time rallies fail so we wouldn't be surprised if the declining tops trendline is sturdy. A breakout would do wonders.
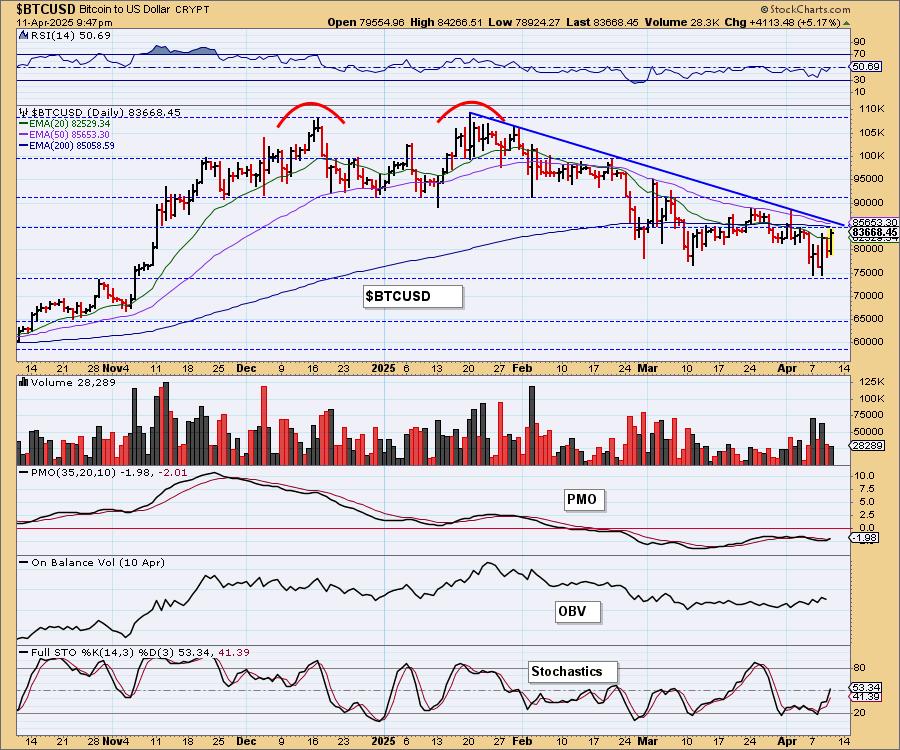
Bitcoin Weekly Chart: Support does look strong right now, but the weekly PMO is in decline. The rounded top proved dangerous and the declining trend is intact. As we noted above, we need to see a breakout soon.
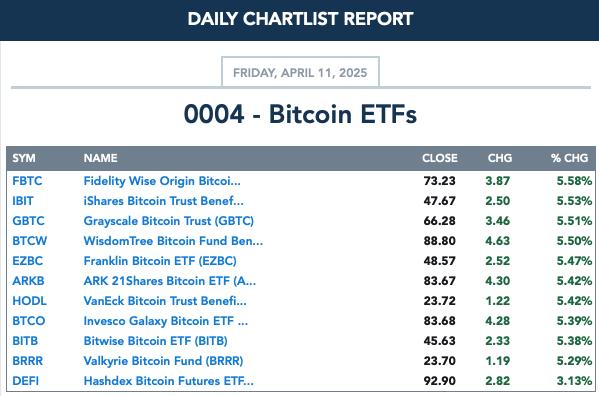
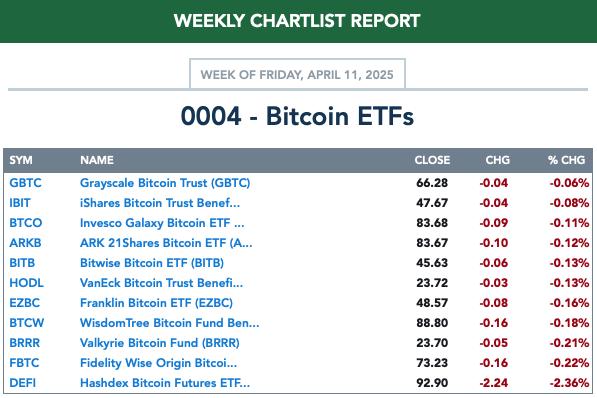
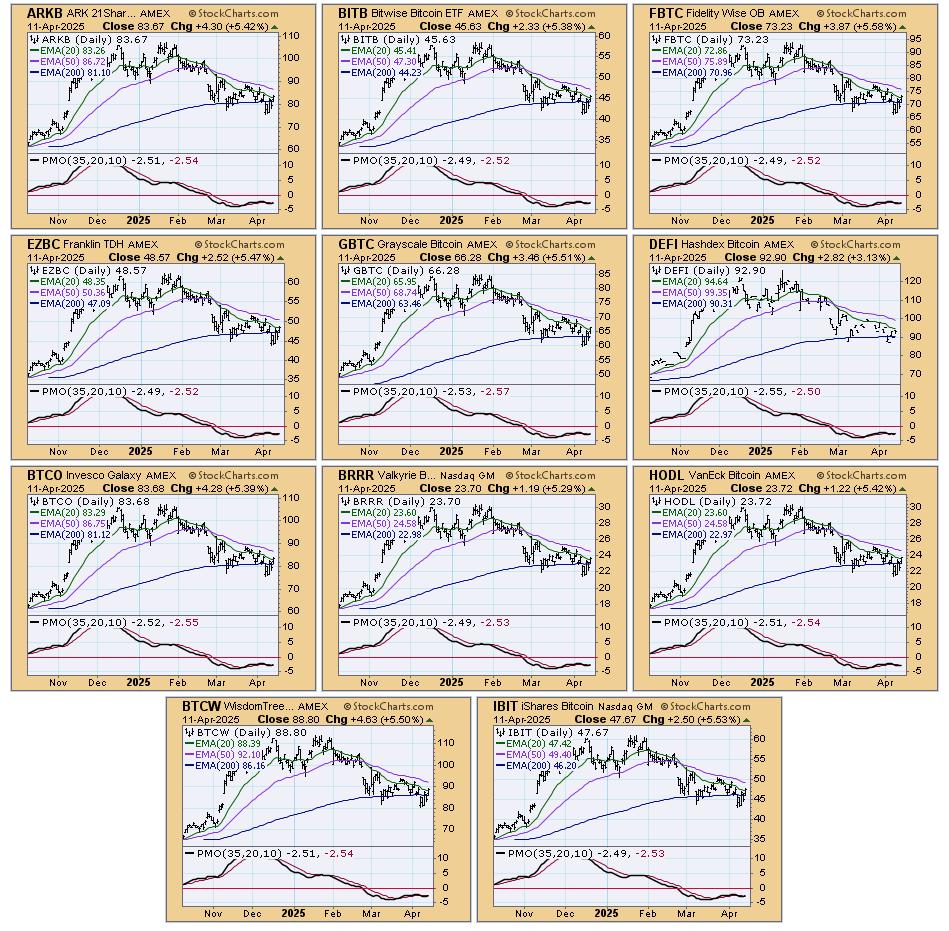
BITCOIN ETFs
Today:
This Week:
INTEREST RATES
Yields continue to rise quickly as the Bond market stutters. We see rates continuing to make their way higher unless we get some bond buying. That doesn't look ready to happen so expect rates to rise further.
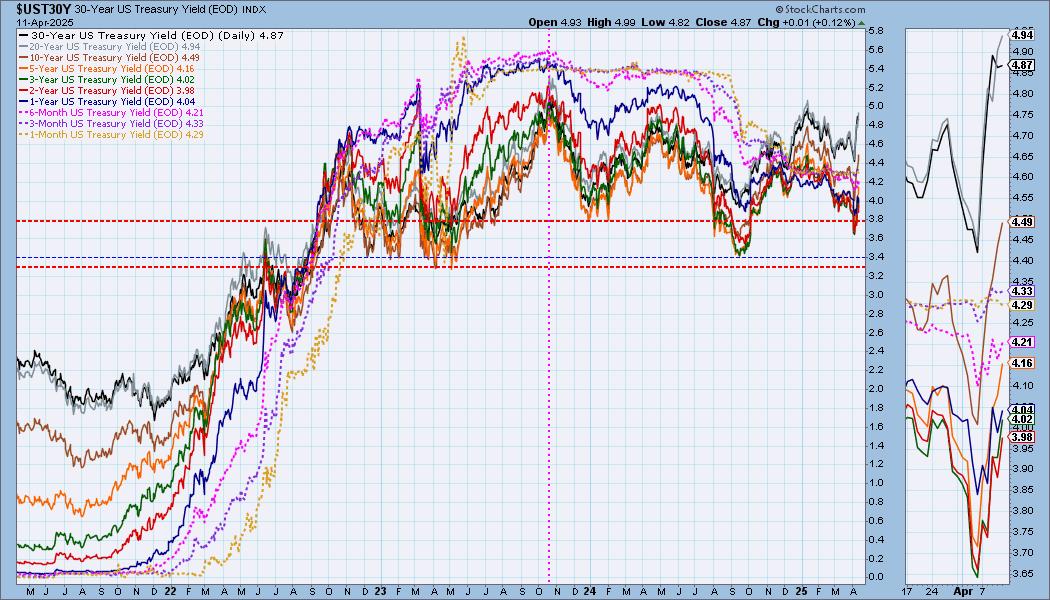
The Yield Curve Chart from StockCharts.com shows us the inversions taking place. The red line should move higher from left to right. Inversions are occurring where it moves downward.

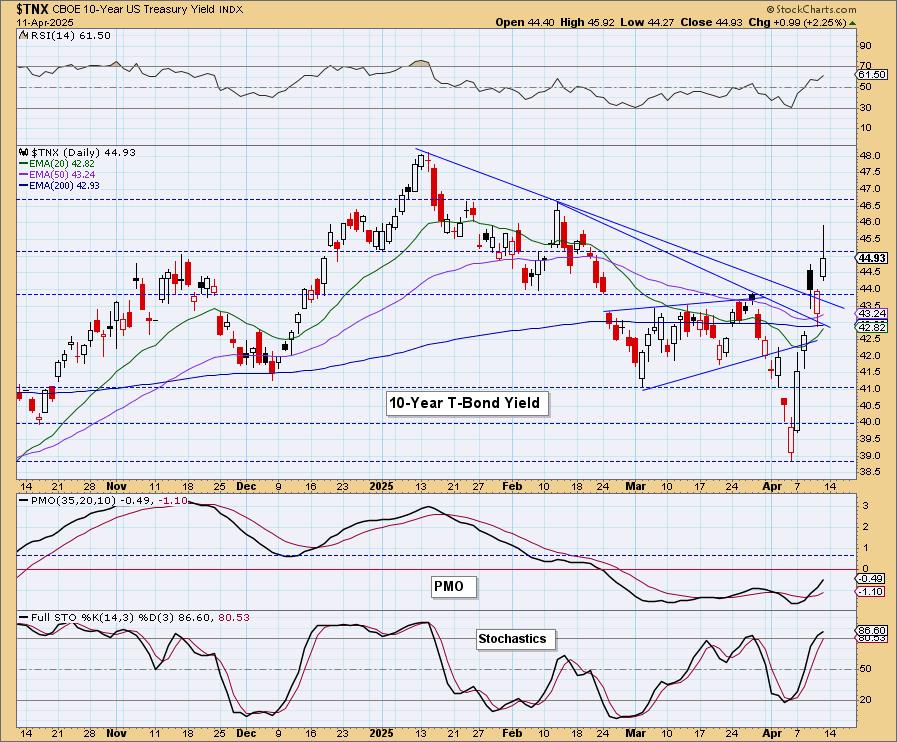
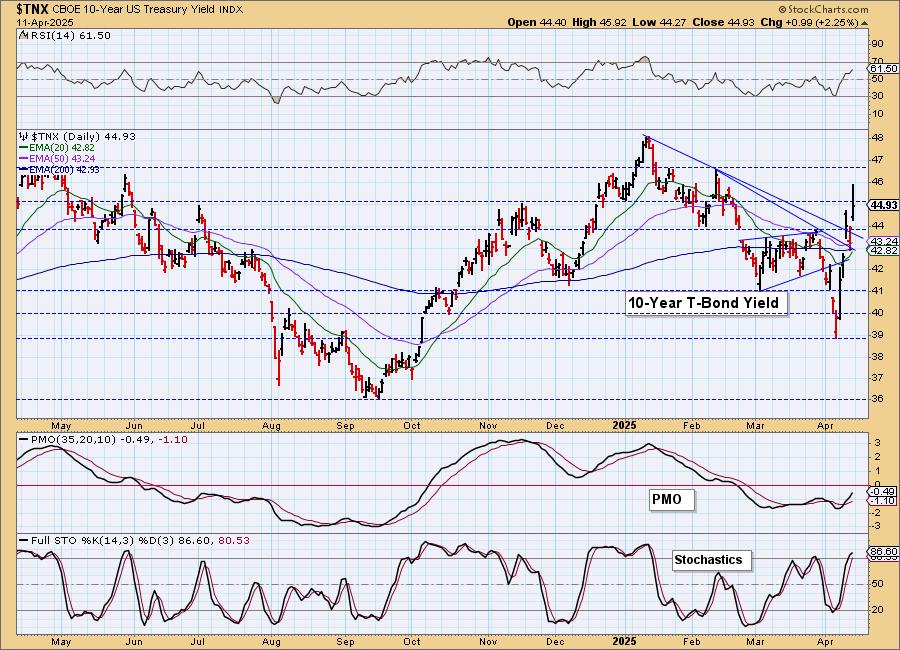
10-YEAR T-BOND YIELD
$TNX rocketed higher this week and doesn't show signs of stopping yet. The RSI is not overbought so it could continue to make its way higher. The PMO and Stochastics are configured very positively confirming the rally.
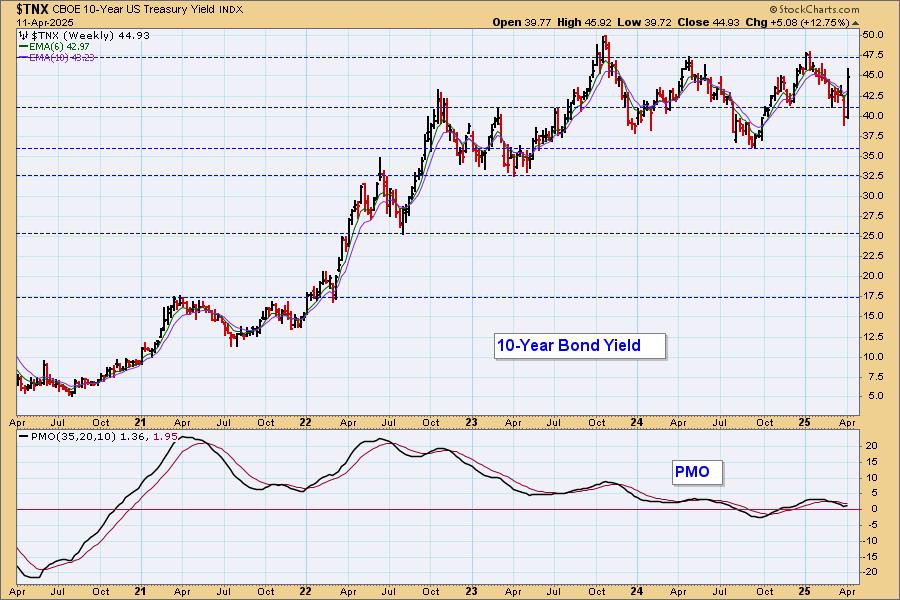
10-Year Bond Yield Weekly Chart: We're in a long-term trading range and $TNX has nearly reach the highs. The weekly PMO is starting to rise and it did reverse higher well above support so it isn't out of the question that we will see a breakout.
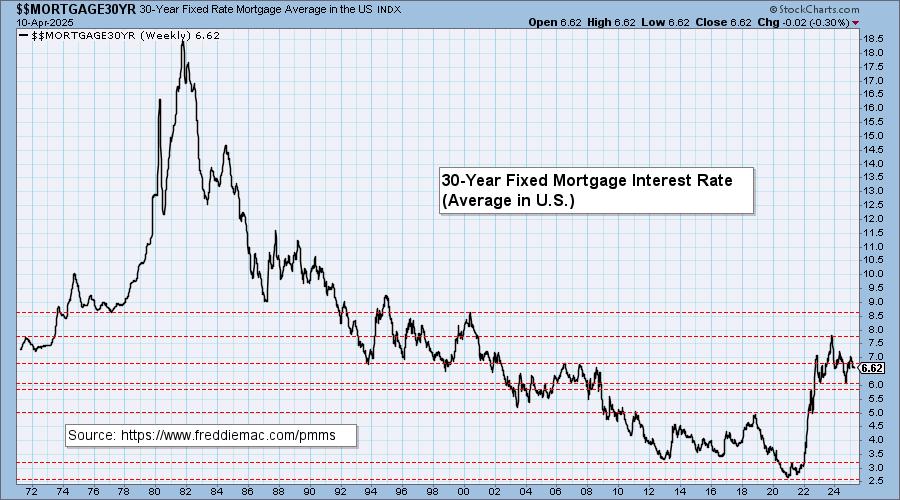
MORTGAGE INTEREST RATES (30-Yr)**
**We watch the 30-Year Fixed Mortgage Interest Rate, because, for the most part, people buy homes based upon the maximum monthly payment they can afford. As rates rise, a fixed monthly payment will carry a smaller mortgage amount, which shuts many buyers out of the market, and potential sellers will experience pressure to lower prices (to no effect so far).
--
This week the 30-Year Fixed Rate changed from 6.64 to 6.62.

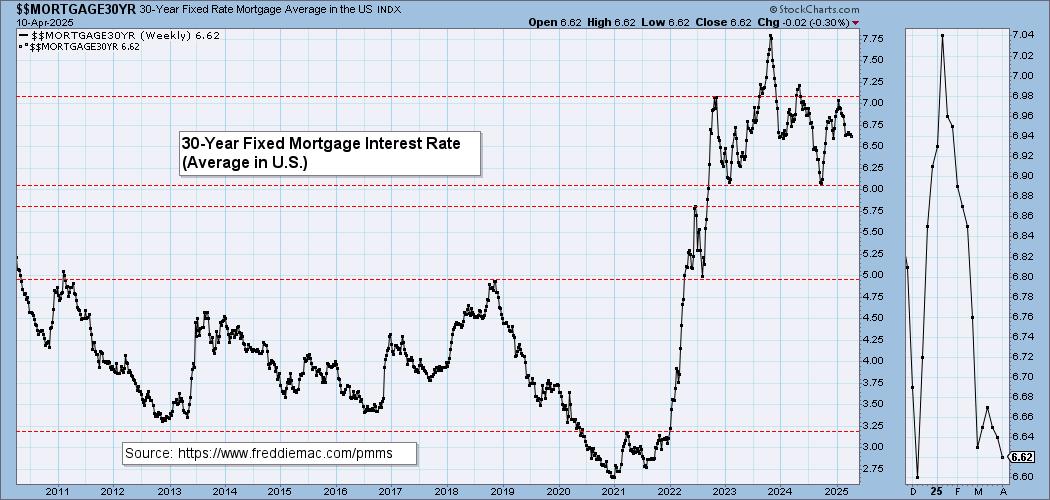
Here is a 50-year chart for better perspective.
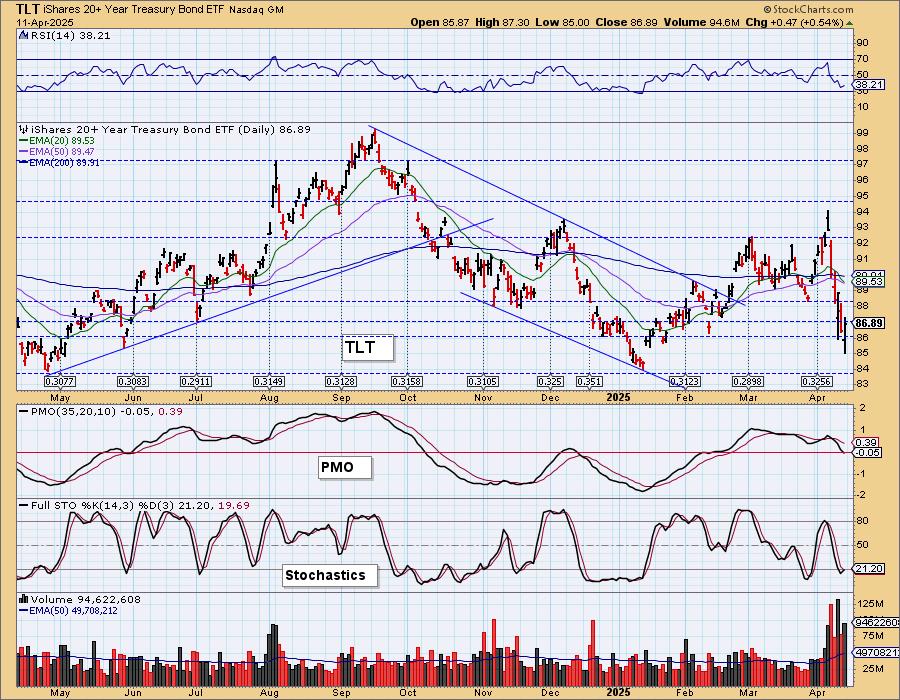
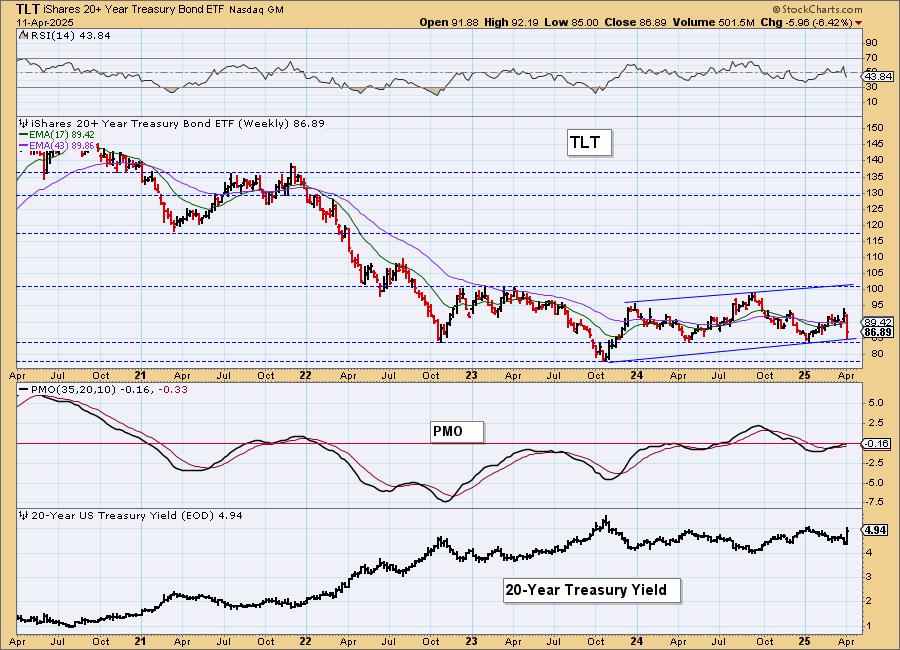
BONDS (TLT)
IT Trend Model: BUY as of 2/25/2025
LT Trend Model: SELL as of 12/13/2024
TLT Daily Chart: Bonds are spiraling lower and we suspect that will continue as yields look incredibly bullish right now. We now have to watch support at 84. The PMO has entered negative territory. Stochastics did turn up on today's rally, but are still in very negative territory.

TLT Weekly Chart: This is a good place to look for an upside reversal as we have both horizontal and rising bottoms support. The weekly PMO is still rising but given yields are so bullish right now, we expect support to be broken.
DOLLAR (UUP)
IT Trend Model: NEUTRAL as of 3/5/2025
LT Trend Model: BUY as of 5/25/2023
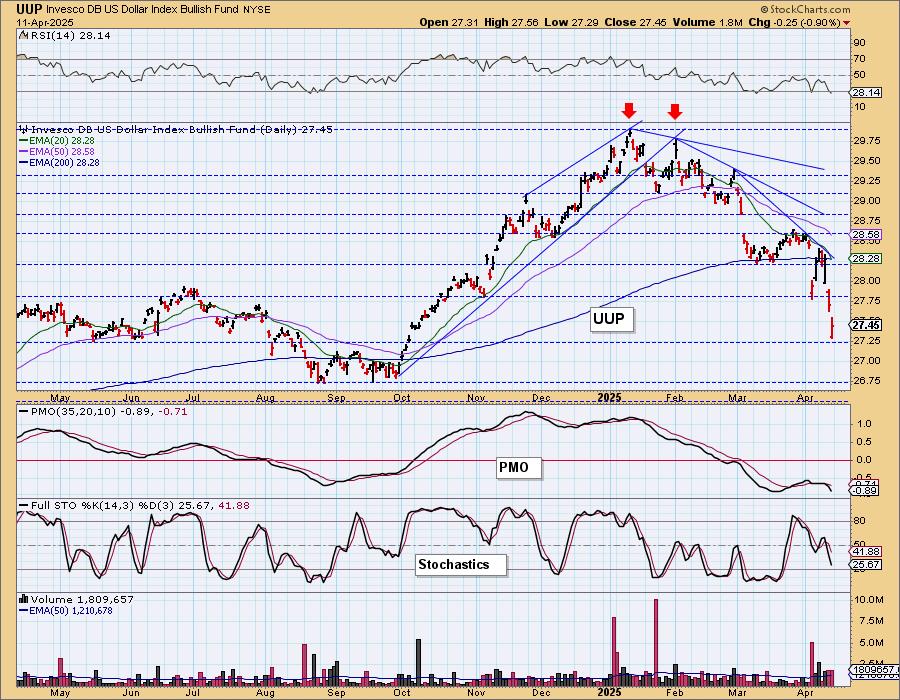
UUP Daily Chart: The Dollar attempted to right itself this week but tariff talk has dragged it down. We do have a bullish hollow red candlestick so we could see it inch higher next week. The declining trend is likely to stick around for awhile as it will take some serious upside to even reach it. The PMO is falling in negative territory and Stochastics are moving lower so we would expect more downside next week.
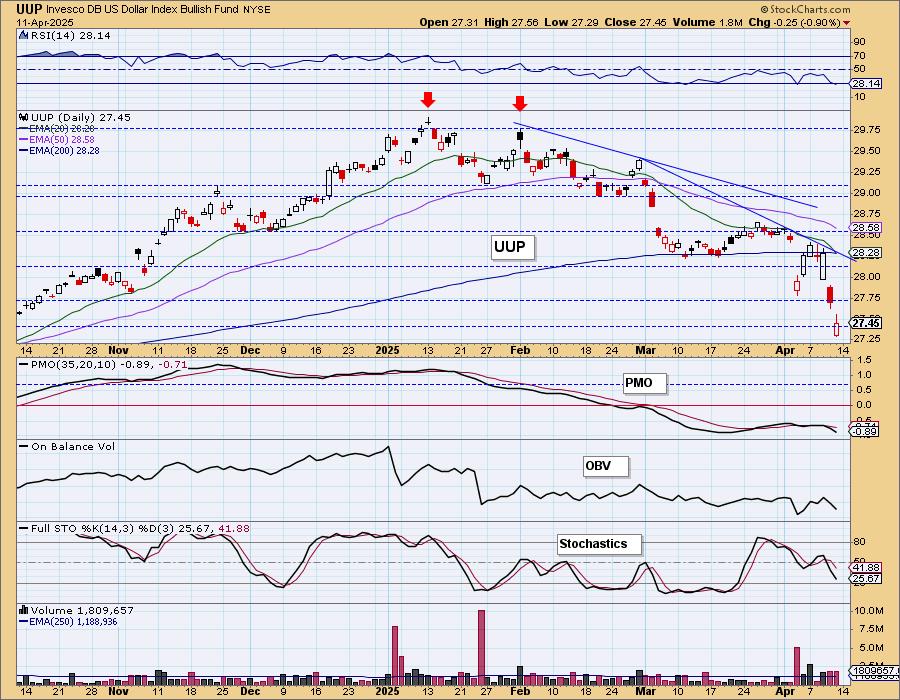
We are on strong support right now, but that is a very negative weekly PMO and Stochastics so it isn't as strong as it looks.
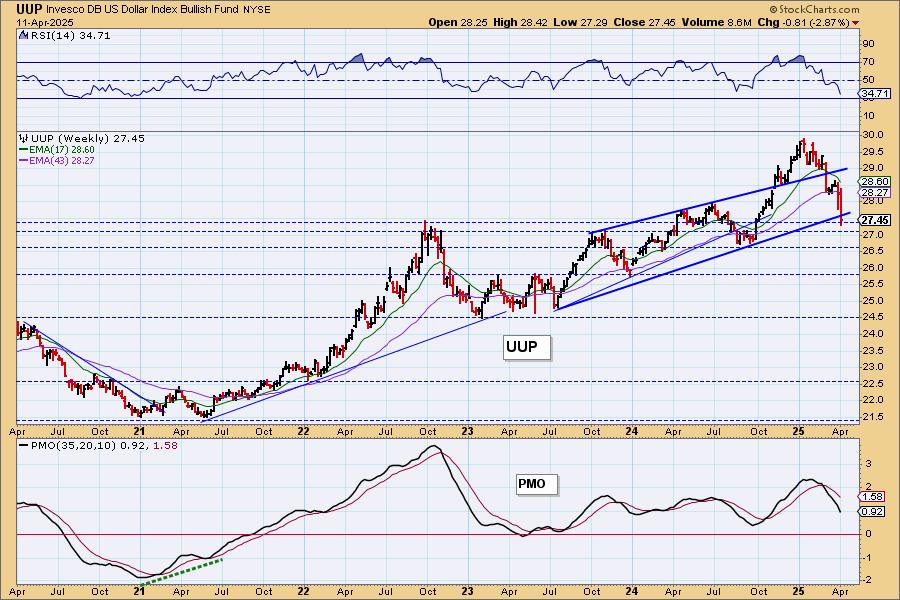
UUP Weekly Chart: UUP lost the rising trend and the weekly PMO is headed lower. We should look for lower prices.
GOLD
IT Trend Model: NEUTRAL as of 12/23/2024
LT Trend Model: BUY as of 10/20/2023
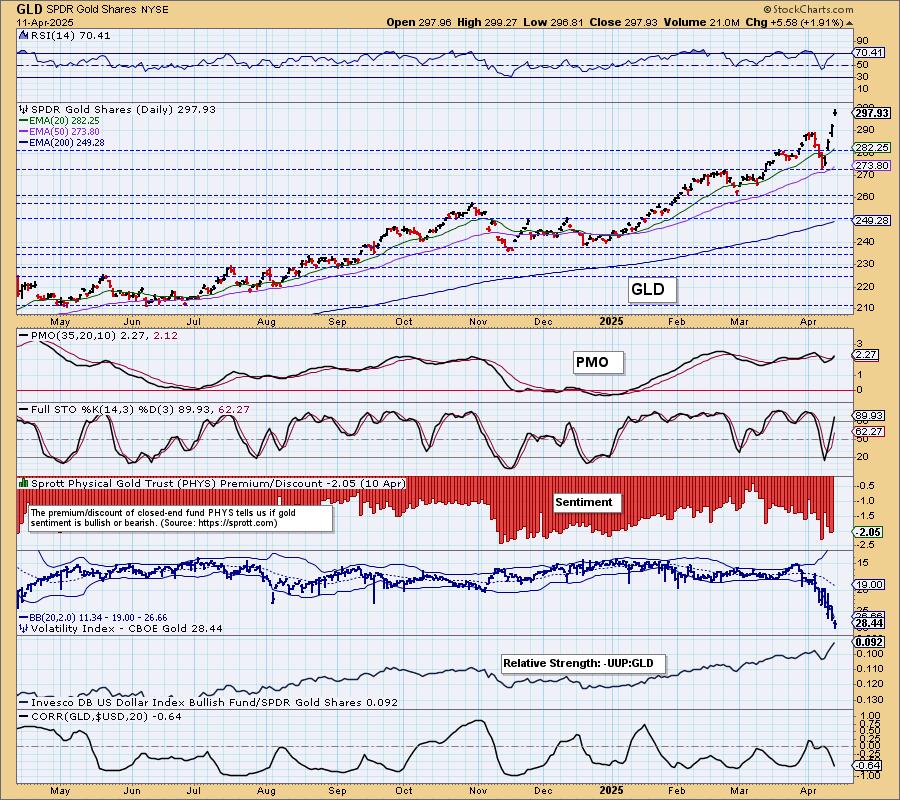
GLD Daily Chart: Gold hit yet another all-time high today. Its RSI has moved into overbought territory so we should be on the lookout for a pause or even a decline. The PMO and Stochastics are very bullish right now so any decline will likely be benign.
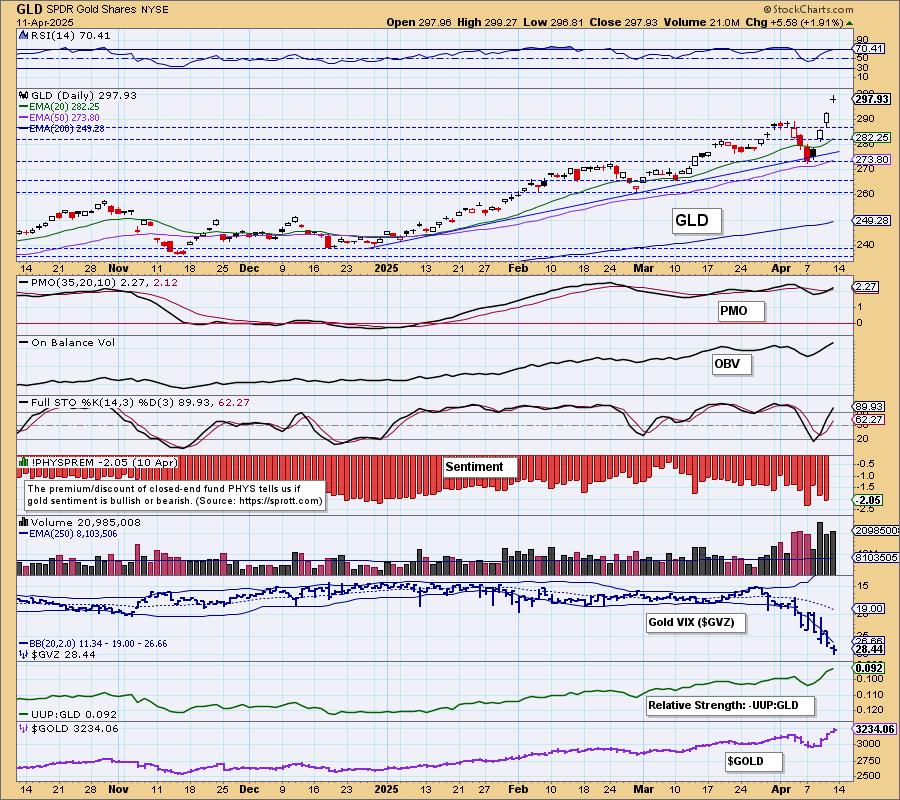
Discounts are elevated which means investors are actually still bearish on the metal. Readings are high enough that it could continue to work in its favor. $GVZ is still puncturing its lower Bollinger Band on the inverted scale which is positive. We were asked whether it would be bullish if $GVZ started contracting. We think that price will lead the way here. Typically a volatility index below the moving average is bearish. We will see if Gold follows this construct.
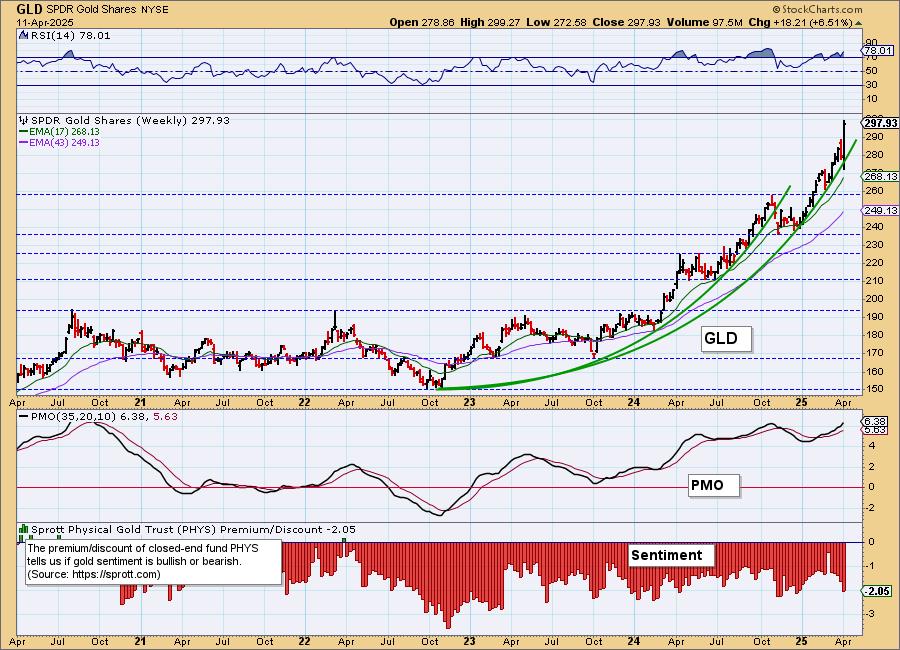
GLD Weekly Chart: The parabolic advance continues on Gold and it is beginning to look more vertical. This condition can persist but it tells us we could see some high level consolidation soon. We aren't looking for a big decline. The fundamentals are still too bullish.
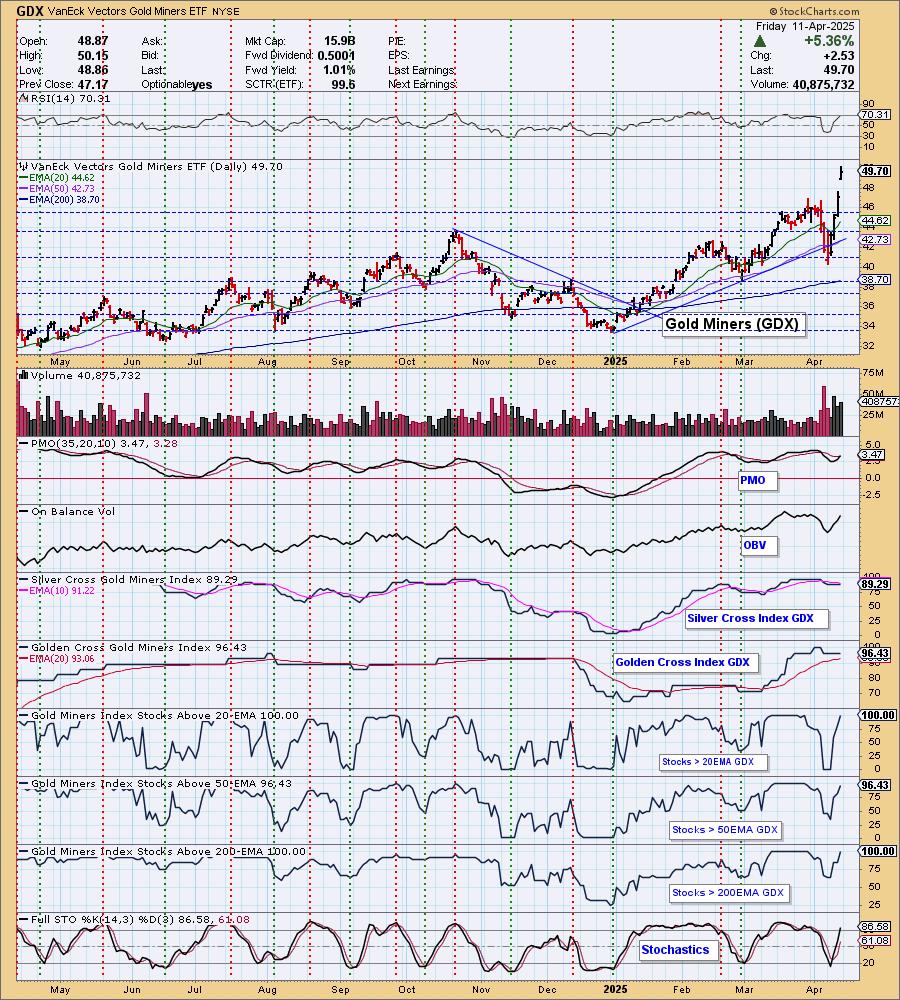
GOLD MINERS Daily Chart: Gold Miners had a great week. Today's rally was impressive. Gold still appears to have more upside available and that should continue to fuel the rally in Gold Miners. They are overbought now based on the RSI so a pause would be good. For now participation couldn't get much better and we have a new PMO Crossover BUY Signal. Still, we would be prepared for a pause.
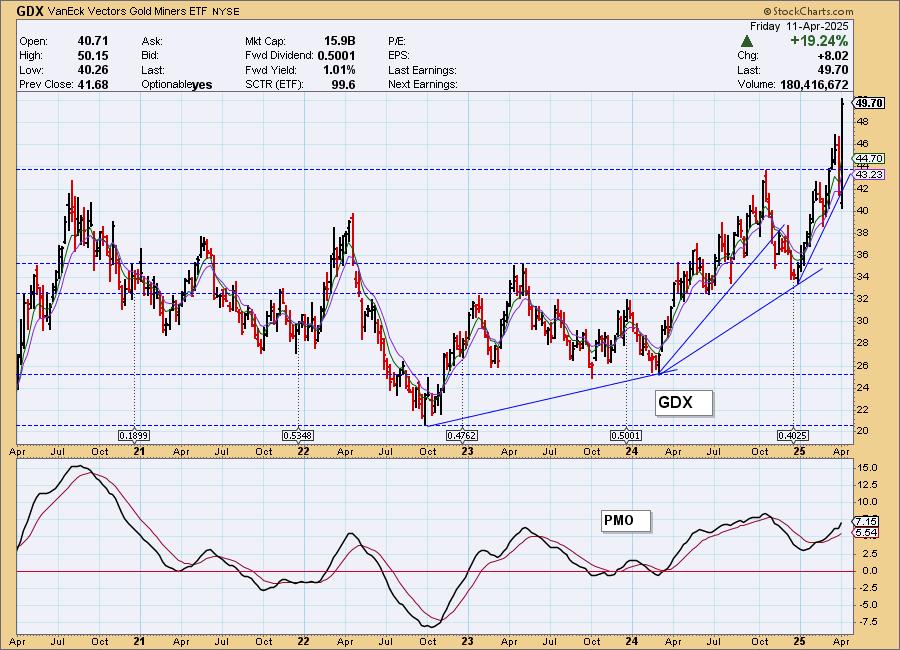
GDX Weekly Chart: The rising trend is very steep. It was breached this week, but obviously with its finish this week, we aren't that worried. The weekly PMO is very bullish so we do expect this rising trend to hold up a bit longer.
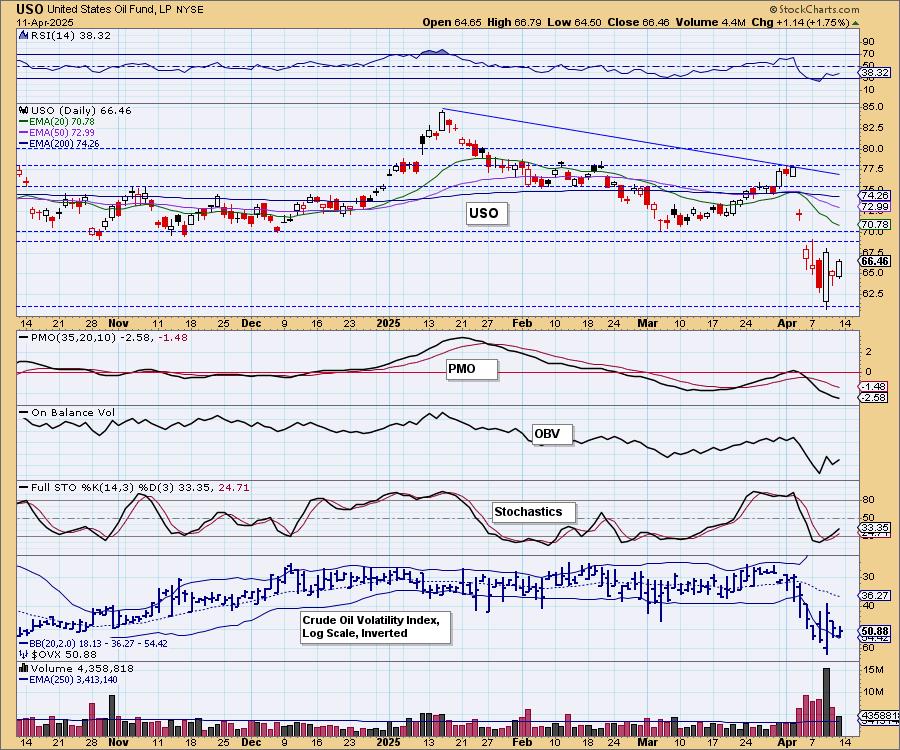
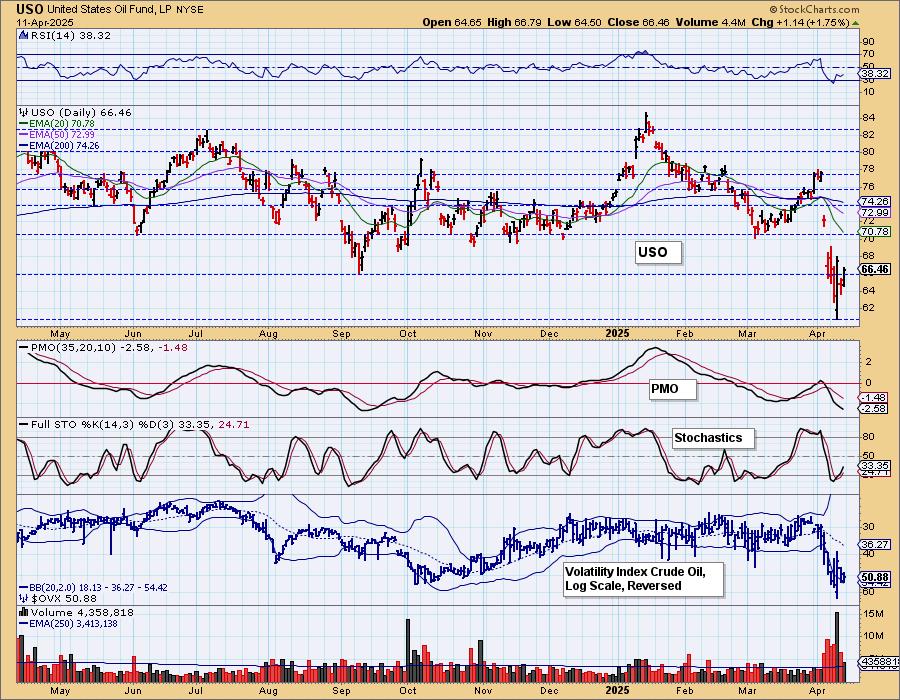
CRUDE OIL (USO)
IT Trend Model: NEUTRAL as of 2/27/2025
LT Trend Model: BUY as of 3/31/2025
USO Daily Chart: Crude appears ready to bounce but the PMO is very negative so we shouldn't expect much out of any rally. Stochastics are rising which is encouraging. This is where we would expect a rally based on support. We need to get to the weekly chart to discuss key support levels.
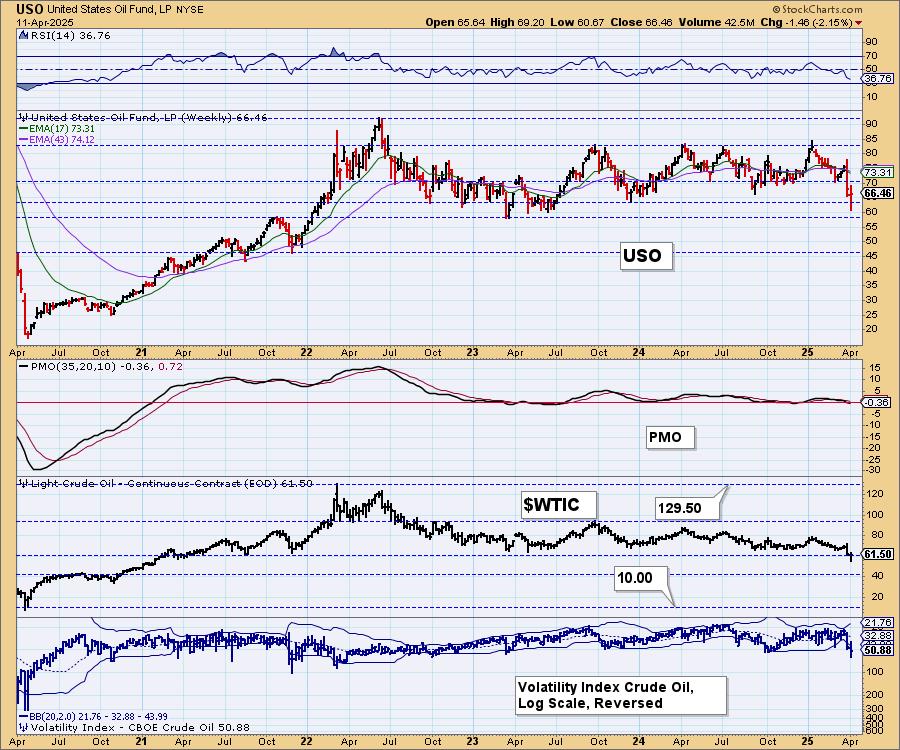
USO/$WTIC Weekly Chart: We've now breached all but one support level and if it is lost we could see prices drop to 45. Support is holding for USO, but not for $WTIC so we think this current support level is likely to break down. The weekly PMO seems to confirm this as it is on a Crossover SELL Signal.
Good Luck & Good Trading!
Erin Swenlin and Carl Swenlin
Technical Analysis is a windsock, not a crystal ball. --Carl Swenlin
(c) Copyright 2025 DecisionPoint.com
Disclaimer: This blog is for educational purposes only and should not be construed as financial advice. The ideas and strategies should never be used without first assessing your own personal and financial situation, or without consulting a financial professional. Any opinions expressed herein are solely those of the author, and do not in any way represent the views or opinions of any other person or entity.
DecisionPoint is not a registered investment advisor. Investment and trading decisions are solely your responsibility. DecisionPoint newsletters, blogs or website materials should NOT be interpreted as a recommendation or solicitation to buy or sell any security or to take any specific action.
NOTE: The signal status reported herein is based upon mechanical trading model signals, specifically, the DecisionPoint Trend Model. They define the implied bias of the price index based upon moving average relationships, but they do not necessarily call for a specific action. They are information flags that should prompt chart review. Further, they do not call for continuous buying or selling during the life of the signal. For example, a BUY signal will probably (but not necessarily) return the best results if action is taken soon after the signal is generated. Additional opportunities for buying may be found as price zigzags higher, but the trader must look for optimum entry points. Conversely, exit points to preserve gains (or minimize losses) may be evident before the model mechanically closes the signal.
Helpful DecisionPoint Links:
DecisionPoint Alert Chart List
DecisionPoint Golden Cross/Silver Cross Index Chart List
DecisionPoint Sector Chart List
Price Momentum Oscillator (PMO)