
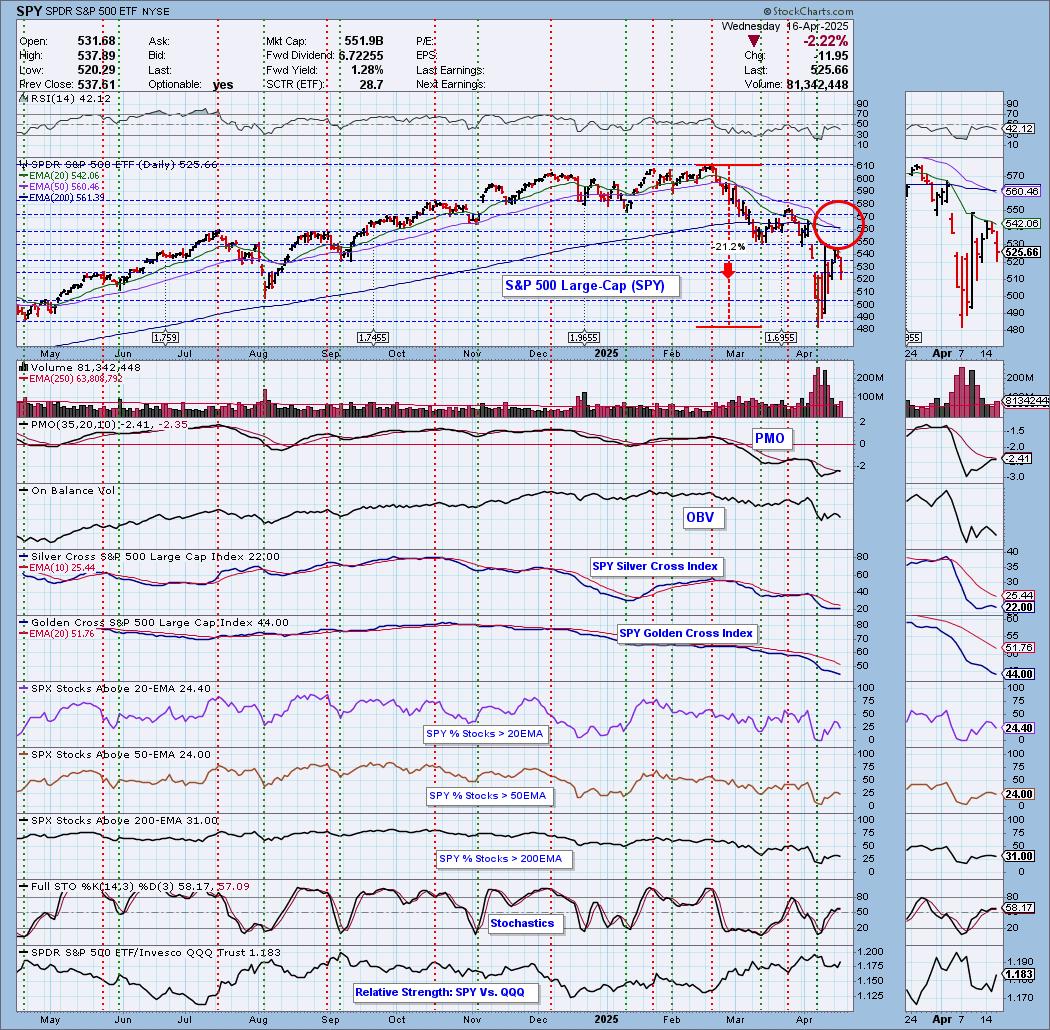
Today the S&P 500 ETF (SPY) 50-day EMA crossed down through the 200-day EMA (Death Cross), generating an IT Trend Model SELL Signal. We'll cover this in more detail below.
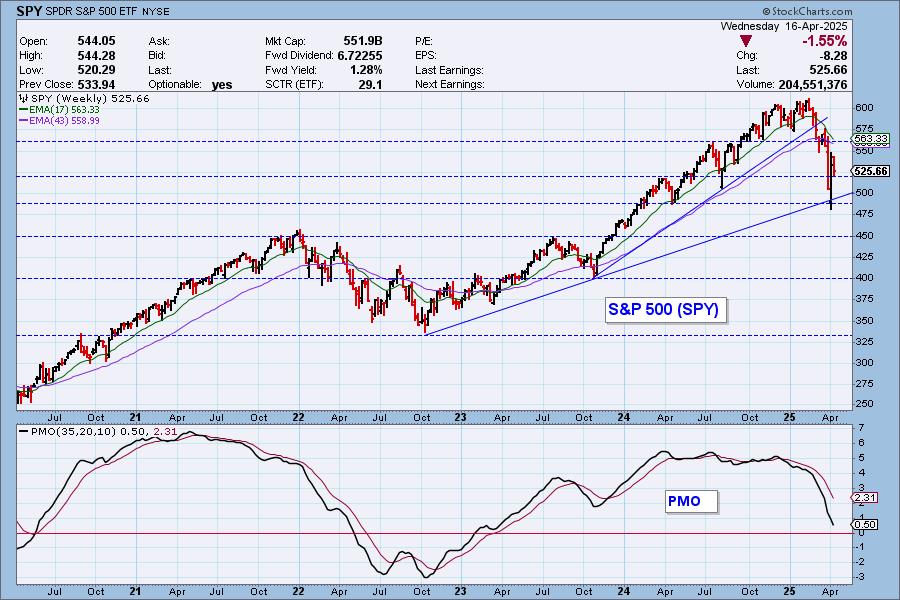
The rising trend out of the late 2023 low was compromised weeks ago and last week the long-term rising trend out of the 2022 low was punctured. So far price is holding above that rising bottoms trendline, but given the very negative weekly PMO it isn't out of the question that it will be tested and likely lost as support.
The DecisionPoint Alert Weekly Wrap presents an end-of-week assessment of the trend and condition of the Stock Market, the U.S. Dollar, Gold, Crude Oil, and Bonds. The DecisionPoint Alert daily report (Monday through Thursday) is abbreviated and gives updates on the Weekly Wrap assessments.
MARKET/INDUSTRY GROUP/SECTOR INDEXES
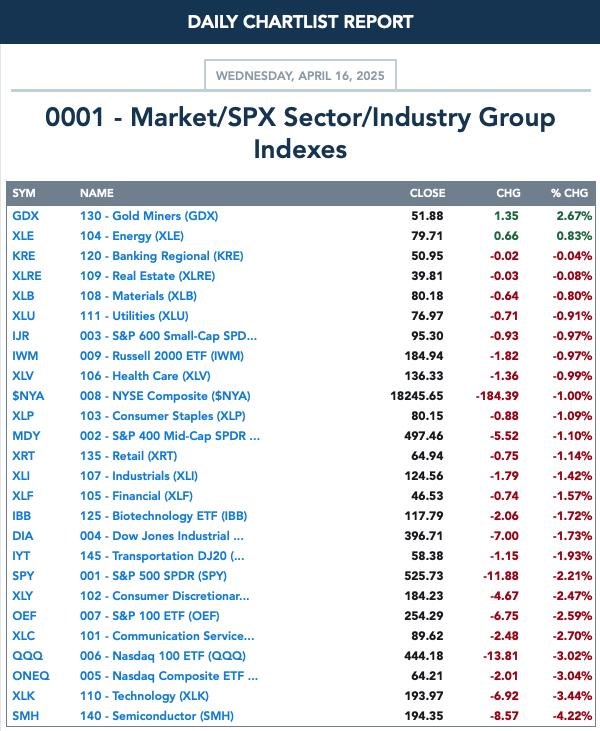
CLICK HERE for Carl's annotated Market Index, Sector, and Industry Group charts.
THE MARKET (S&P 500)
IT Trend Model: NEUTRAL as of 3/4/2025
LT Trend Model: BUY as of 3/29/2023
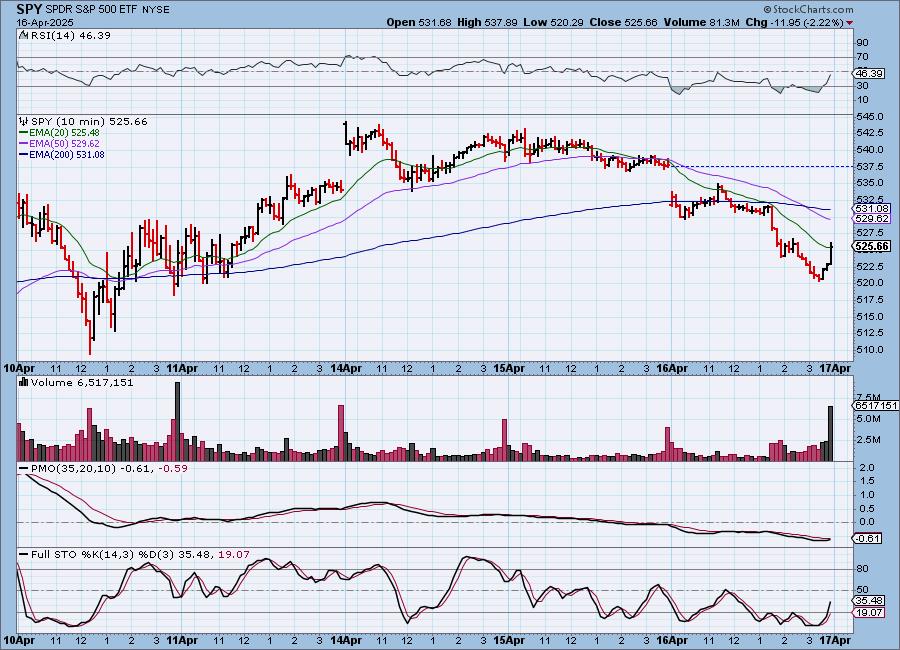
SPY 10-Minute Chart: The market was basically in decline all day with a last minute thrust higher. This has set up the 10-minute PMO for a Crossover BUY Signal, but ultimately it is flat beneath the zero line and that implies weakness.
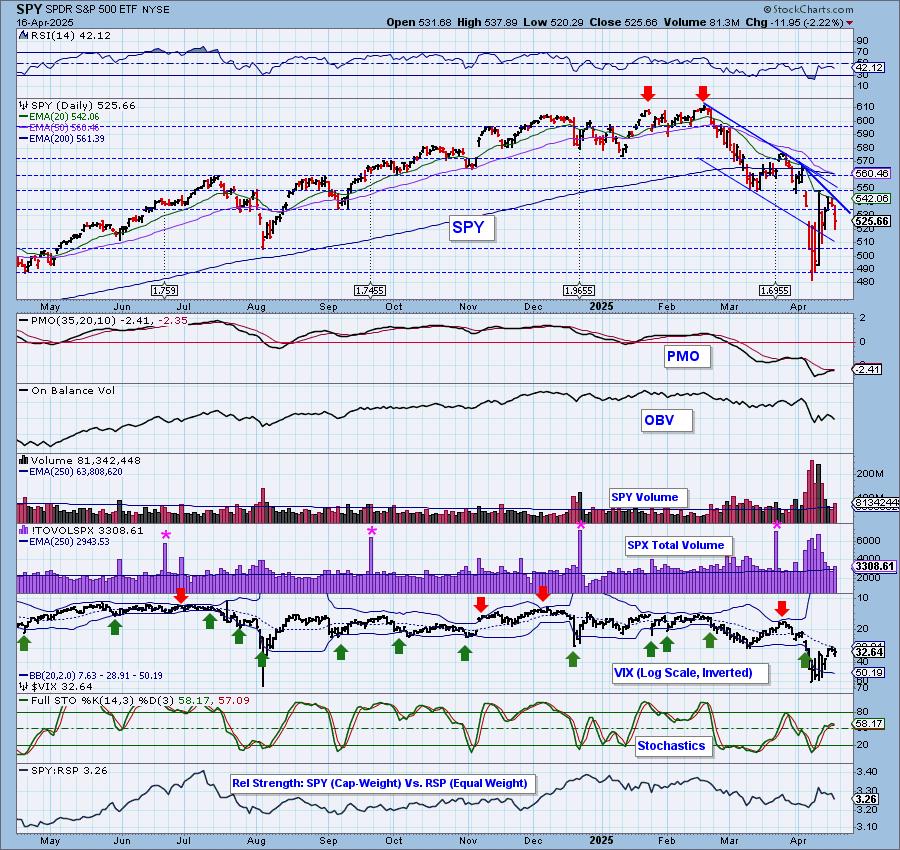
SPY Daily Chart: We've established a new more accelerated declining tops trendline. The PMO is trying to top beneath its signal line.
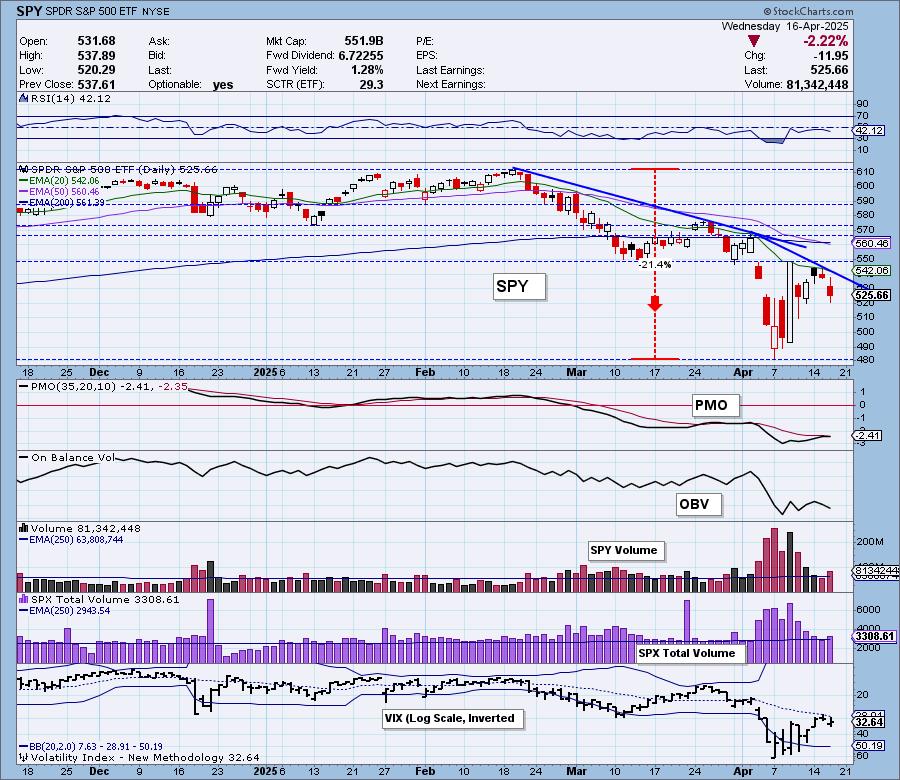
The VIX turned down at its moving average on the inverted scale today. This implies weakness. Stochastics tipped lower. Note that mega-caps are underperforming equal-weight RSP. This is a bad condition for the market and will likely lead to lower prices.
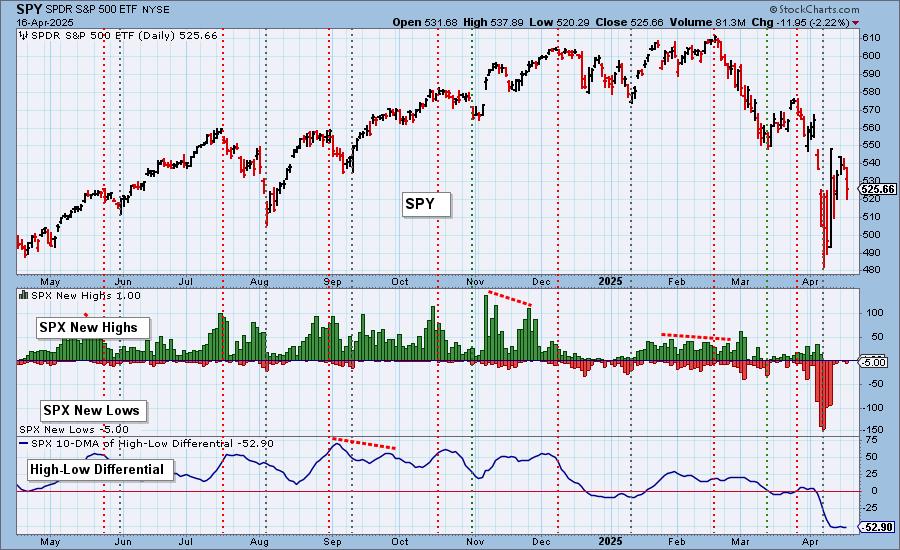
S&P 500 New 52-Week Highs/Lows: New Lows did expand somewhat on today's decline. We again saw one New High. The High-Low Differential is falling.
Climax* Analysis: Three of the four relevant indicators had climax readings today, giving us a downside initiation climax. Total volume was confirming and not at blowout levels.
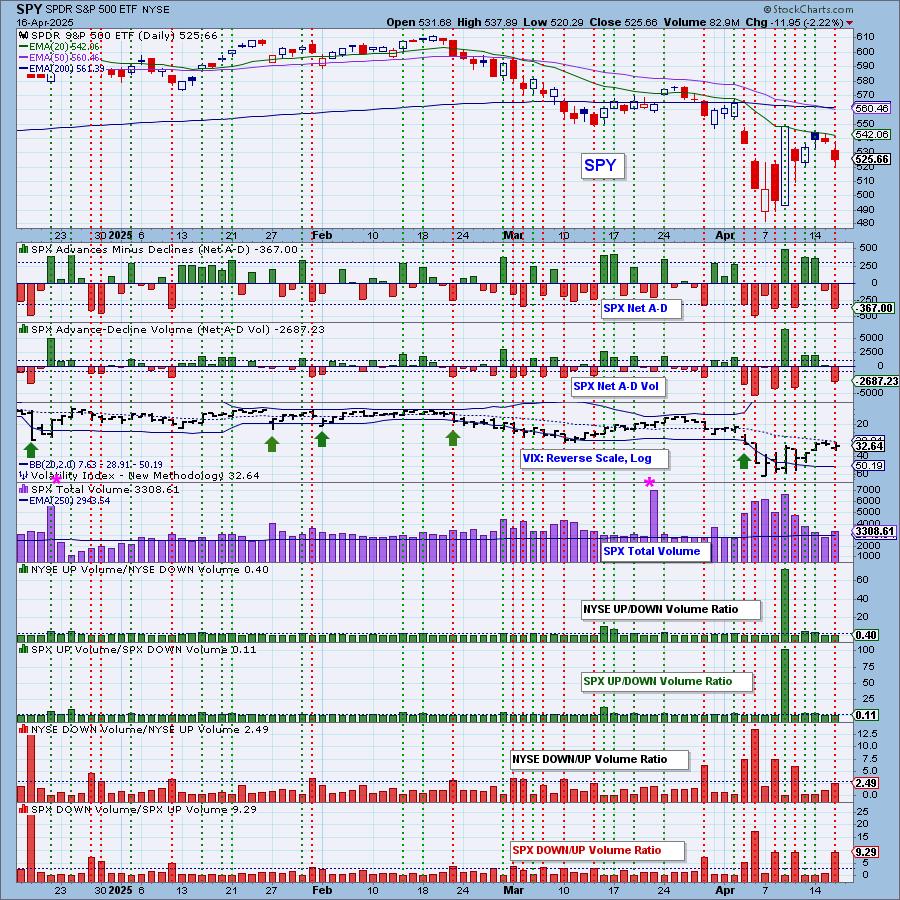
*A climax is a one-day event when market action generates very high readings in, primarily, breadth and volume indicators. We also include the VIX, watching for it to penetrate outside the Bollinger Band envelope. The vertical dotted lines mark climax days -- red for downside climaxes, and green for upside. Climaxes are at their core exhaustion events; however, at price pivots they may be initiating a change of trend.
Short-Term Market Indicators: The short-term market trend is DOWN and the condition is NEUTRAL.
The Swenlin Trading Oscillators (STOs) both turned lower today which leads us to believe that the market isn't done with this decline. Participation slipped further with now under 1/4 of the index above their 20-day EMAs. Rising PMOs were cut and are now below our bullish 50% threshold.
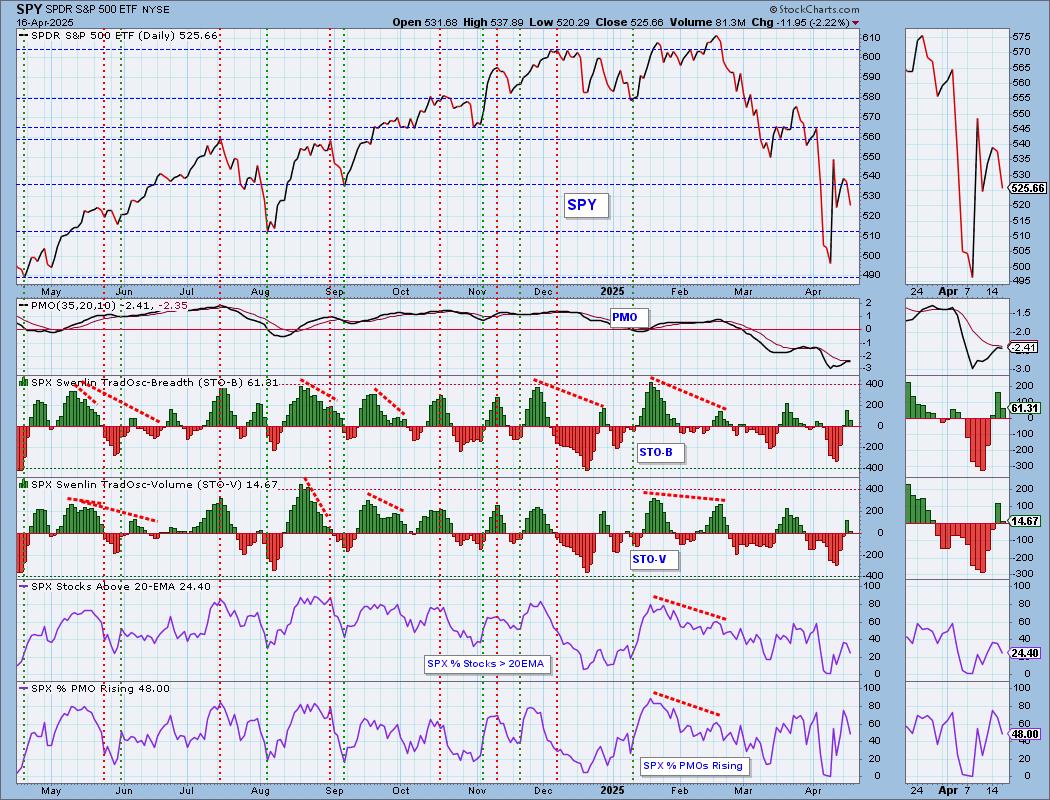
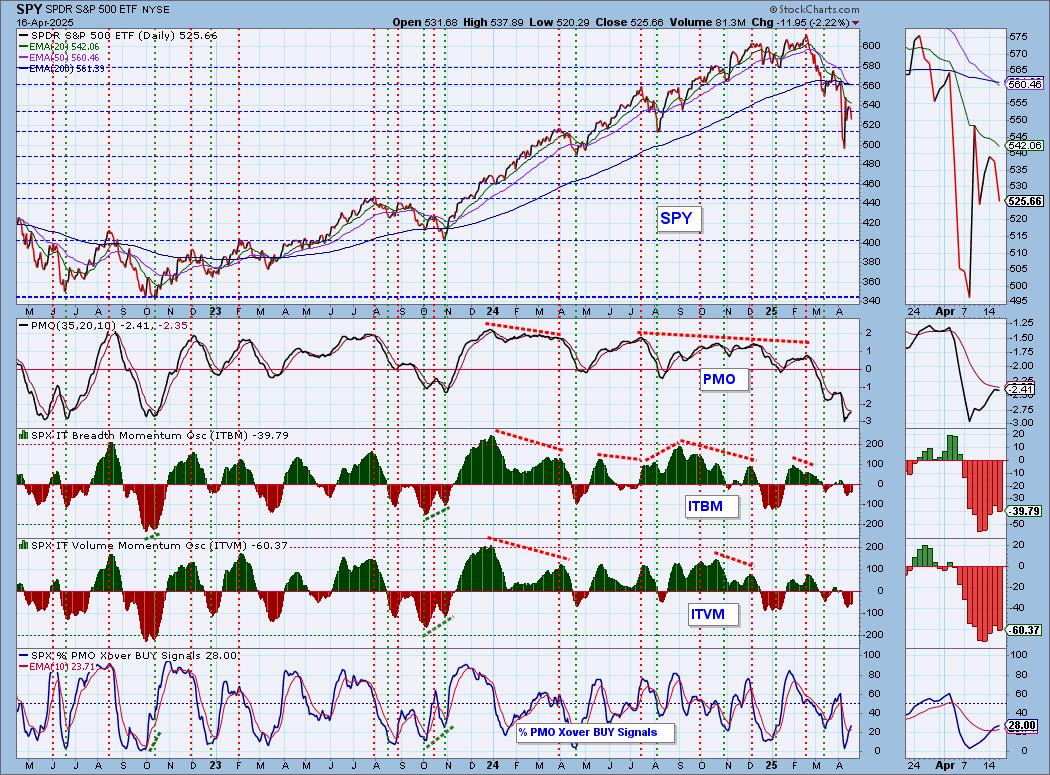
Intermediate-Term Market Indicators: The intermediate-term market trend is DOWN and the condition is NEUTRAL.
The ITBM and ITVM also turned down alongside the falling STOs which is a bearish confirmation. We did see more PMO BUY Signals, but given we have over 48% with rising PMOs, the indicator should continue rising further. It is likely to get hung up soon as rising PMOs are melting out of the market.
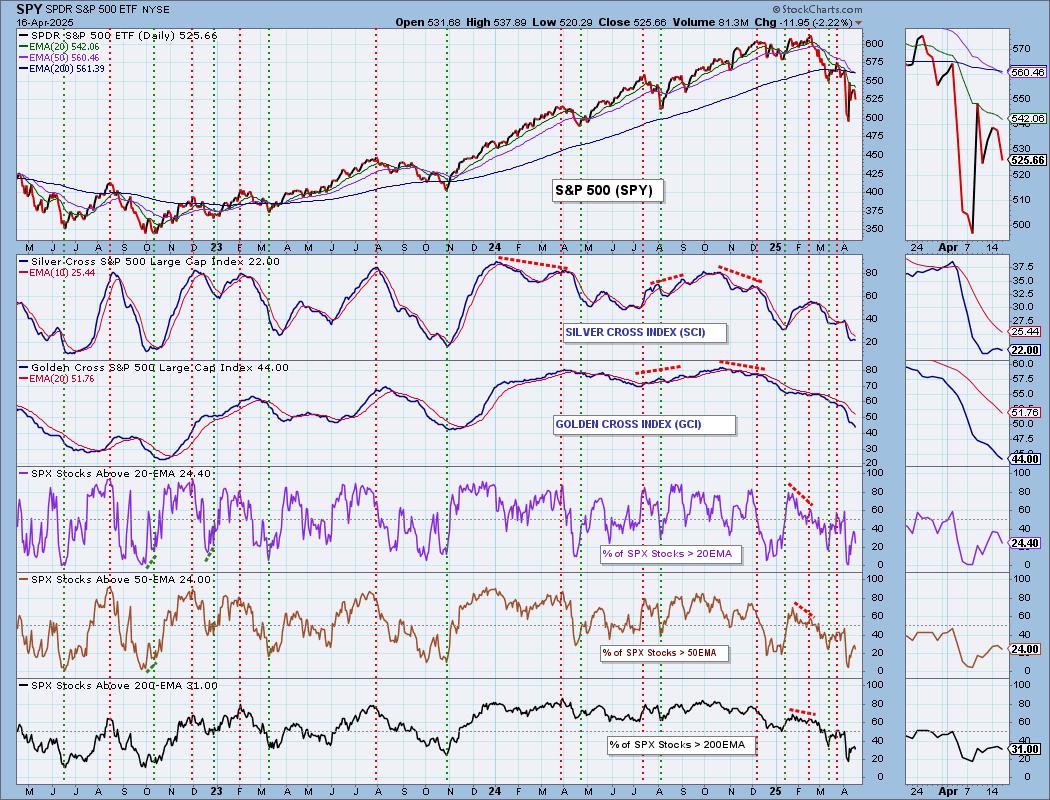
PARTICIPATION CHART (S&P 500): The following chart objectively shows the depth and trend of participation for the SPX in two time frames.
- Intermediate-Term - the Silver Cross Index (SCI) shows the percentage of SPX stocks on IT Trend Model BUY signals (20-EMA > 50-EMA). The opposite of the Silver Cross is a "Dark Cross" -- those stocks are, at the very least, in a correction.
- Long-Term - the Golden Cross Index (GCI) shows the percentage of SPX stocks on LT Trend Model BUY signals (50-EMA > 200-EMA). The opposite of a Golden Cross is the "Death Cross" -- those stocks are in a bear market.
The market bias is BEARISH in the intermediate and long terms.
We see continued declining trends on participation indicators. Presently less than 25% are above their 20/50-day EMAs. The Silver Cross Index turned back down today, topping below the signal line. It is below its signal line so the IT Bias is BEARISH. The Golden Cross Index continues to make its way lower and isn't oversold yet. It is below its signal line so the LT Bias remains BEARISH.
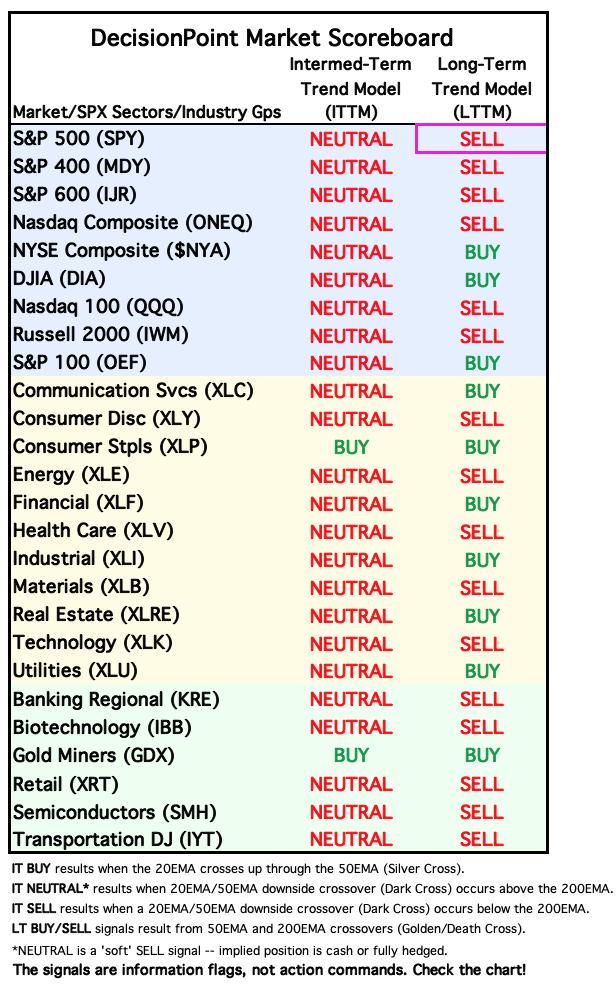
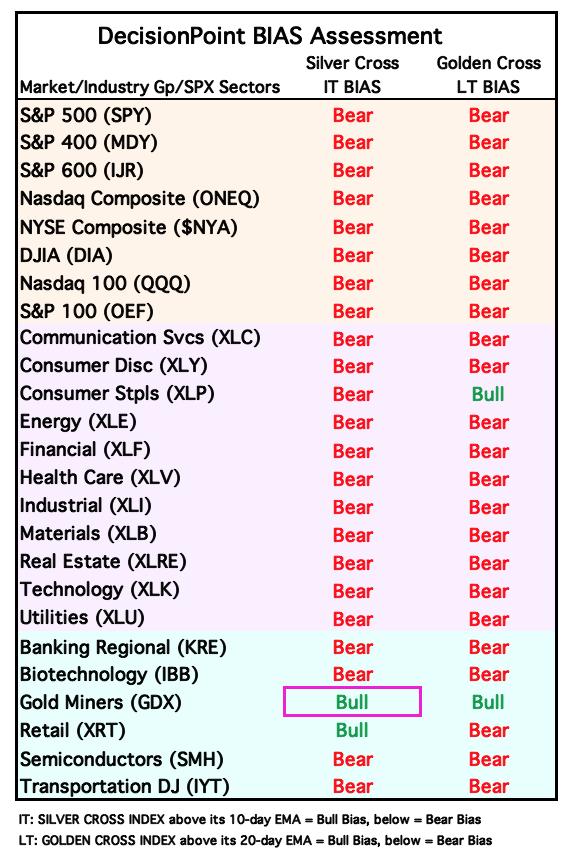
BIAS Assessment: The following table expresses the current BIAS of various price indexes based upon the relationship of the Silver Cross Index to its 10-day EMA (intermediate-term), and of the Golden Cross Index to its 20-day EMA (long-term). When the Index is above the EMA it is bullish, and it is bearish when the Index is below the EMA. The BIAS does not imply that any particular action should be taken. It is information to be used in the decision process.
The items with highlighted borders indicate that the BIAS changed today.
*****************************************************************************************************
CONCLUSION: Today saw a clear downside initiation climax that suggests the decline is not over yet. Our key indicators, the STOs and ITBM/ITVM all turned lower on the day suggesting to us that this decline could persist. Participation remains low and doesn't appear strong enough to turn this bus around. Bearish biases load our Bias Table above and most areas of the market are on Neutral IT Trend Model signals. We thought that this decline would be temporary but instead indicators turned south on us and tell us this decline will likely get legs.
Erin is 10% long, 0% short. (This is intended as information, not a recommendation.)
*****************************************************************************************************
CALENDAR

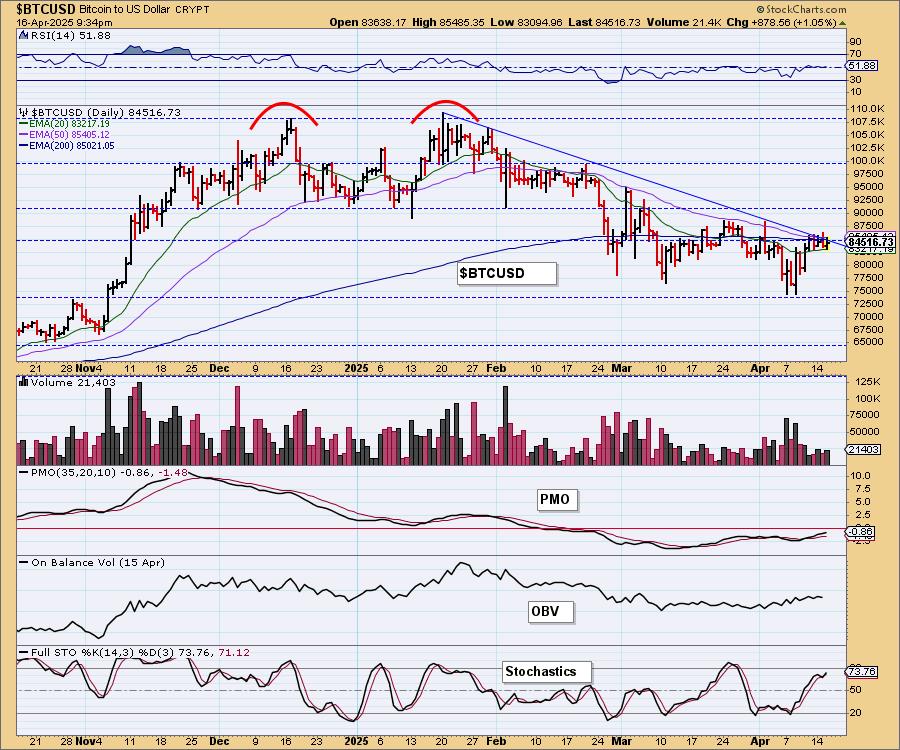
BITCOIN
Bitcoin is very close to an upside breakout, but price seems to be stalling. With Stochastics and the PMO rising, we don't expect a decline necessarily, more likely it will move sideways out of the declining trend which wouldn't be all that bullish, but certainly better than another decline.
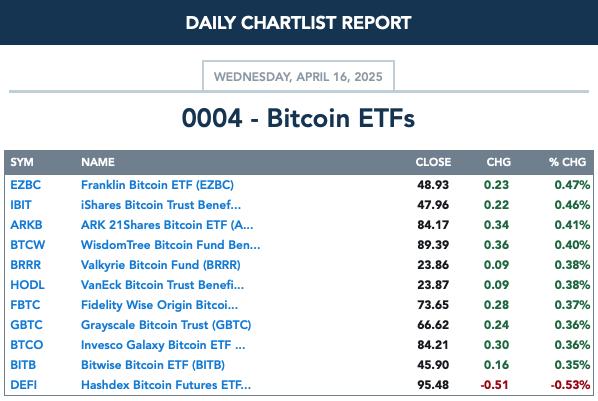
BITCOIN ETFs
INTEREST RATES
Yields are moving lower again so we should expect Bond funds to continue to enjoy some rally. It appears this condition will persist a bit longer.
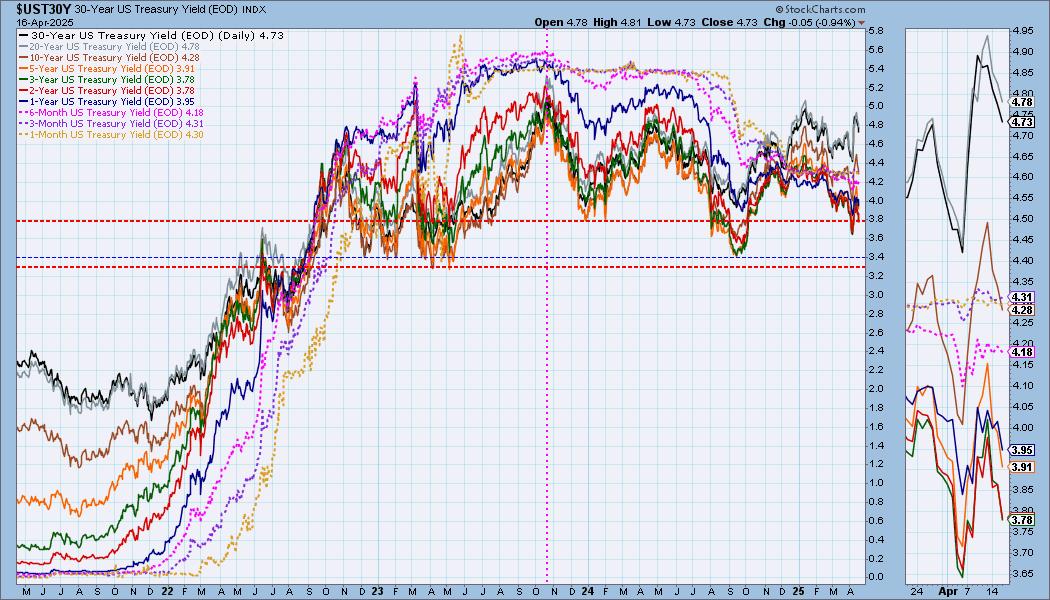
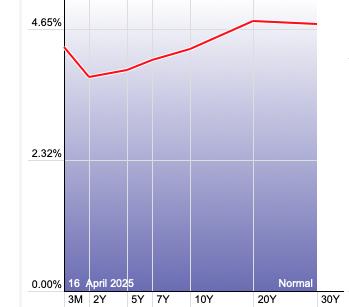
The Yield Curve Chart from StockCharts.com shows us the inversions taking place. The red line should move higher from left to right. Inversions are occurring where it moves downward.
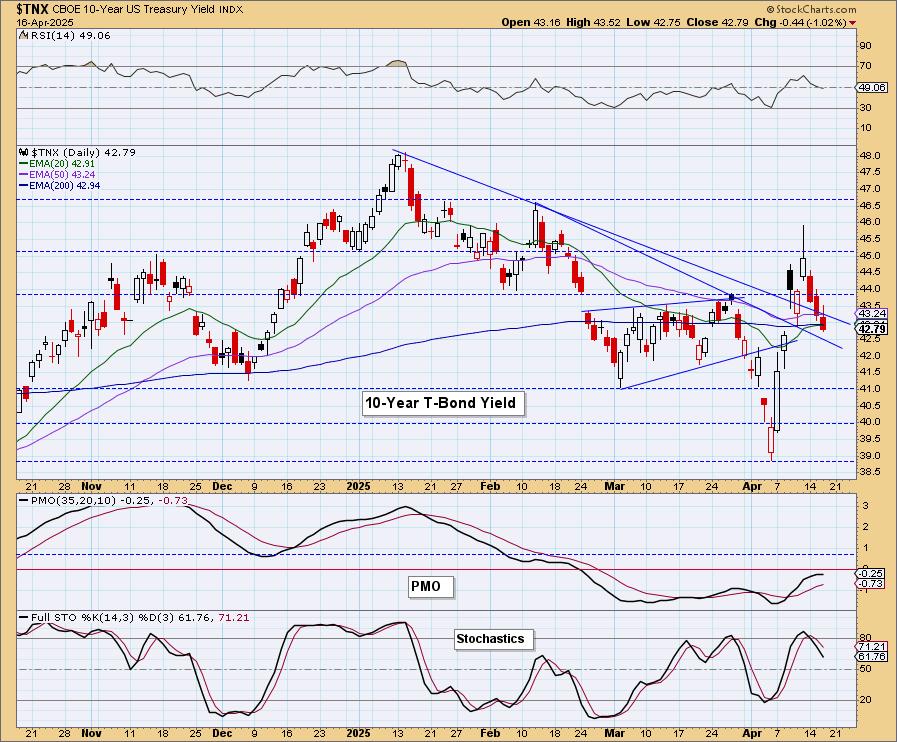
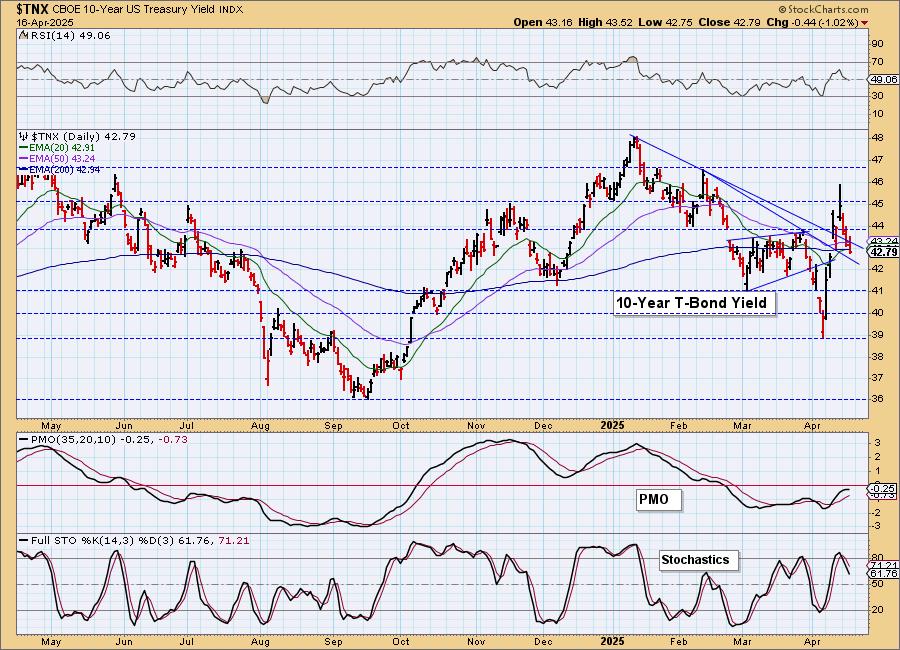
10-YEAR T-BOND YIELD
$TNX pulled back and dropped below the declining tops trendline out of the January high. The PMO is topping beneath the zero line so we are expecting the yield to fall further from here. Stochastics are in agreement.
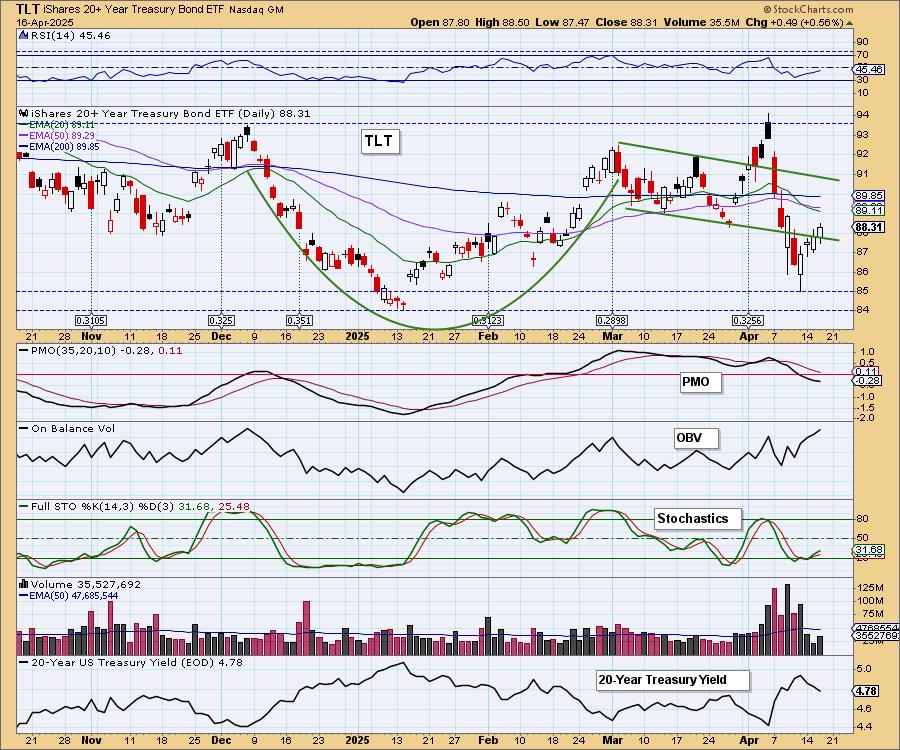
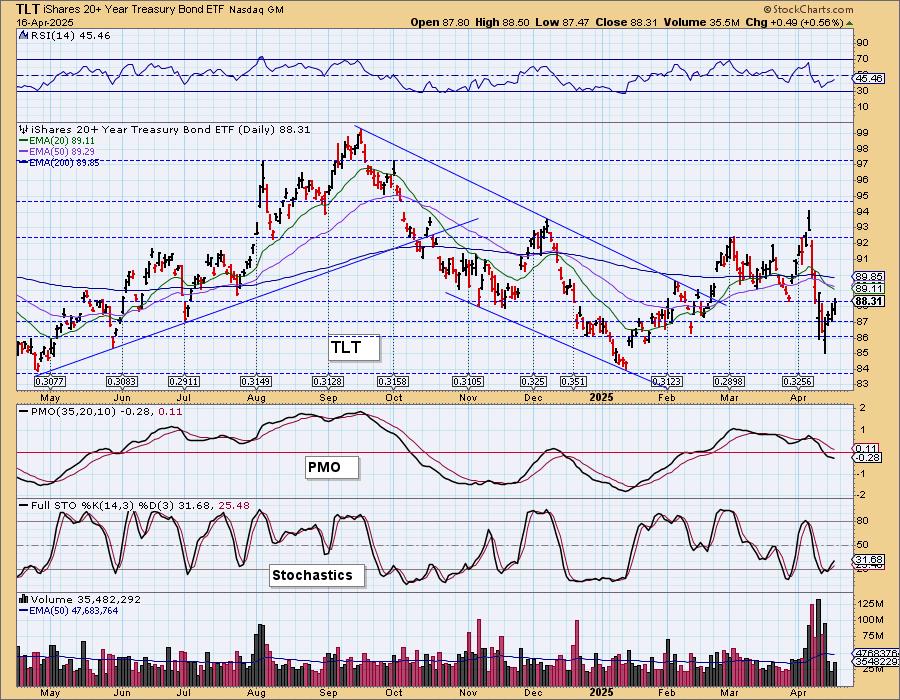
BONDS (TLT)
IT Trend Model: SELL as of 4/14/2025
LT Trend Model: SELL as of 12/13/2024
TLT Daily Chart: This looks like a good rally coming off support, but it does look like a bear flag so we shouldn't get too excited as upside potential is likely going to be limited. However, we do see that yields are looking more bearish so the flag could continue to form. We believe the cup with handle pattern has aborted.
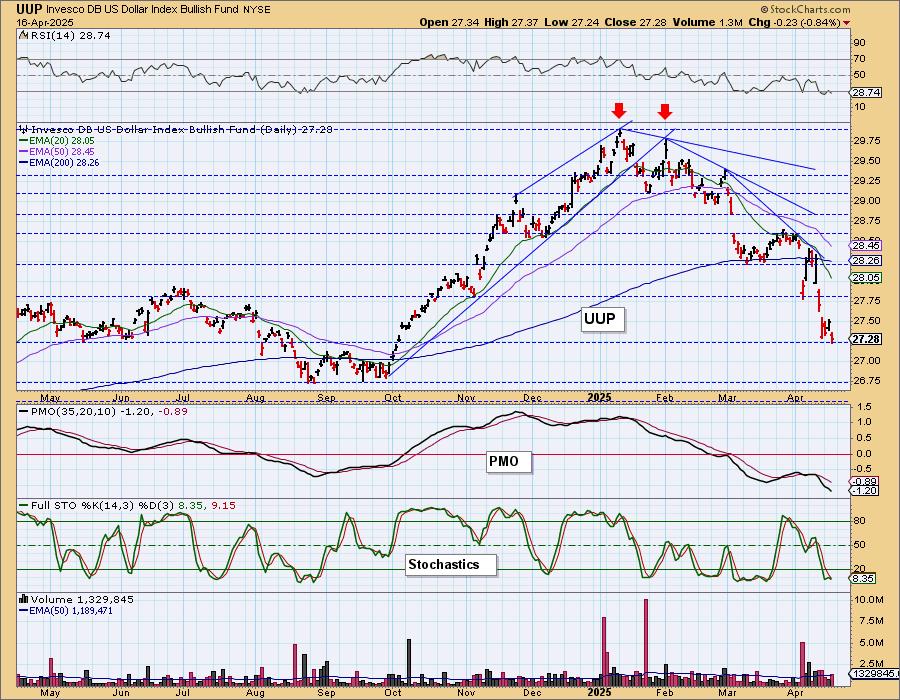
DOLLAR (UUP)
IT Trend Model: NEUTRAL as of 3/5/2025
LT Trend Model: BUY as of 5/25/2023
UUP Daily Chart: The Dollar fell below support today and looks very weak. The PMO is well below the zero line and that implies weakness. Stochastics topped below 20 which is especially bearish. The RSI may be oversold right now, but we see more decline in the Dollar's future.
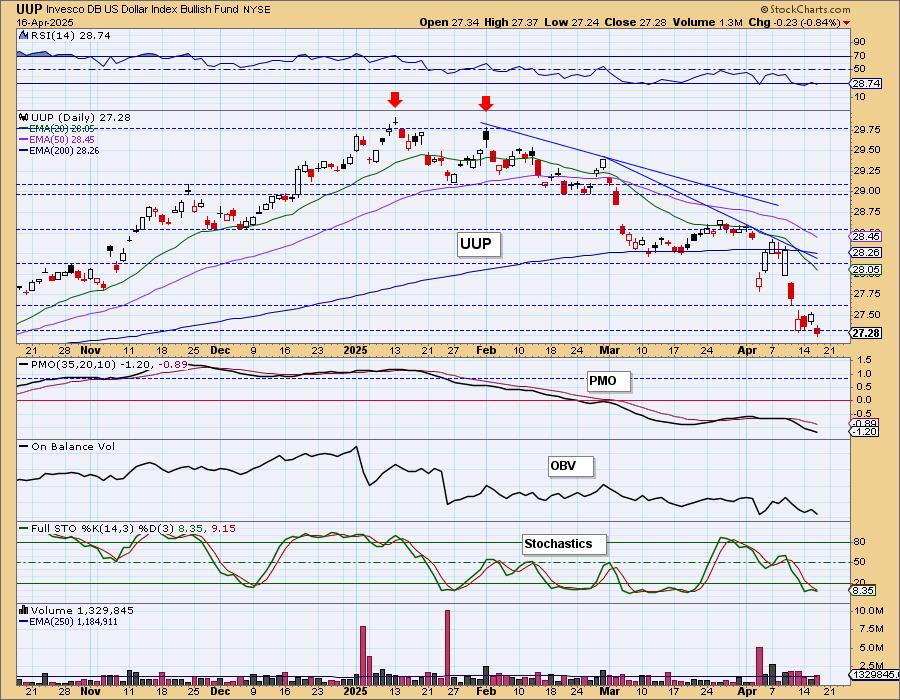
The next level of support that we are watching is 26.75.
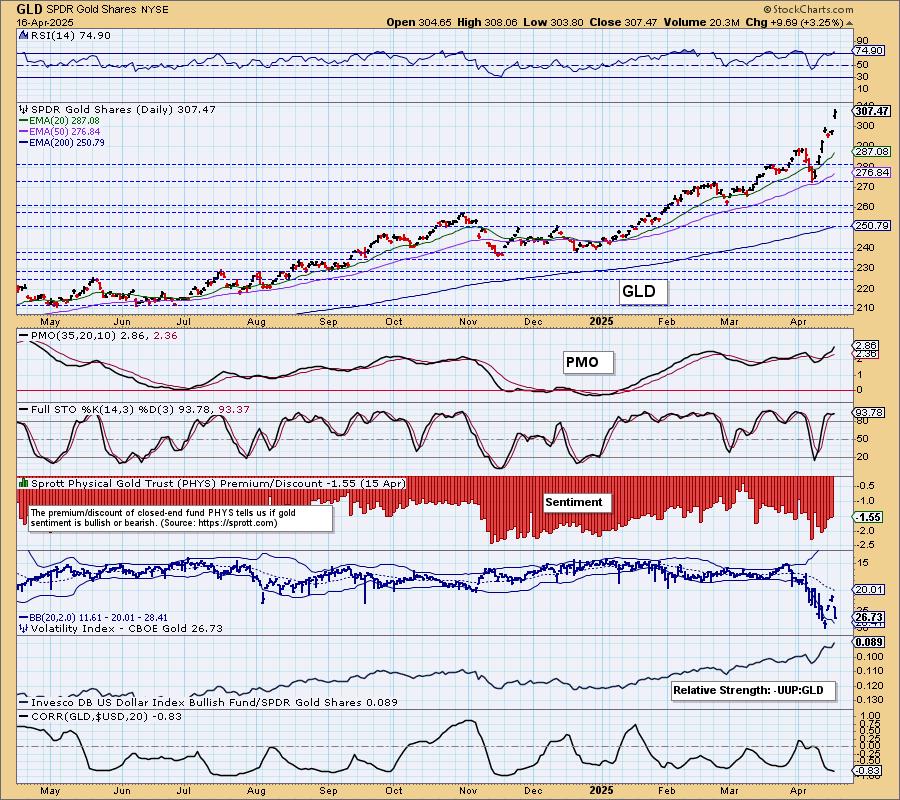
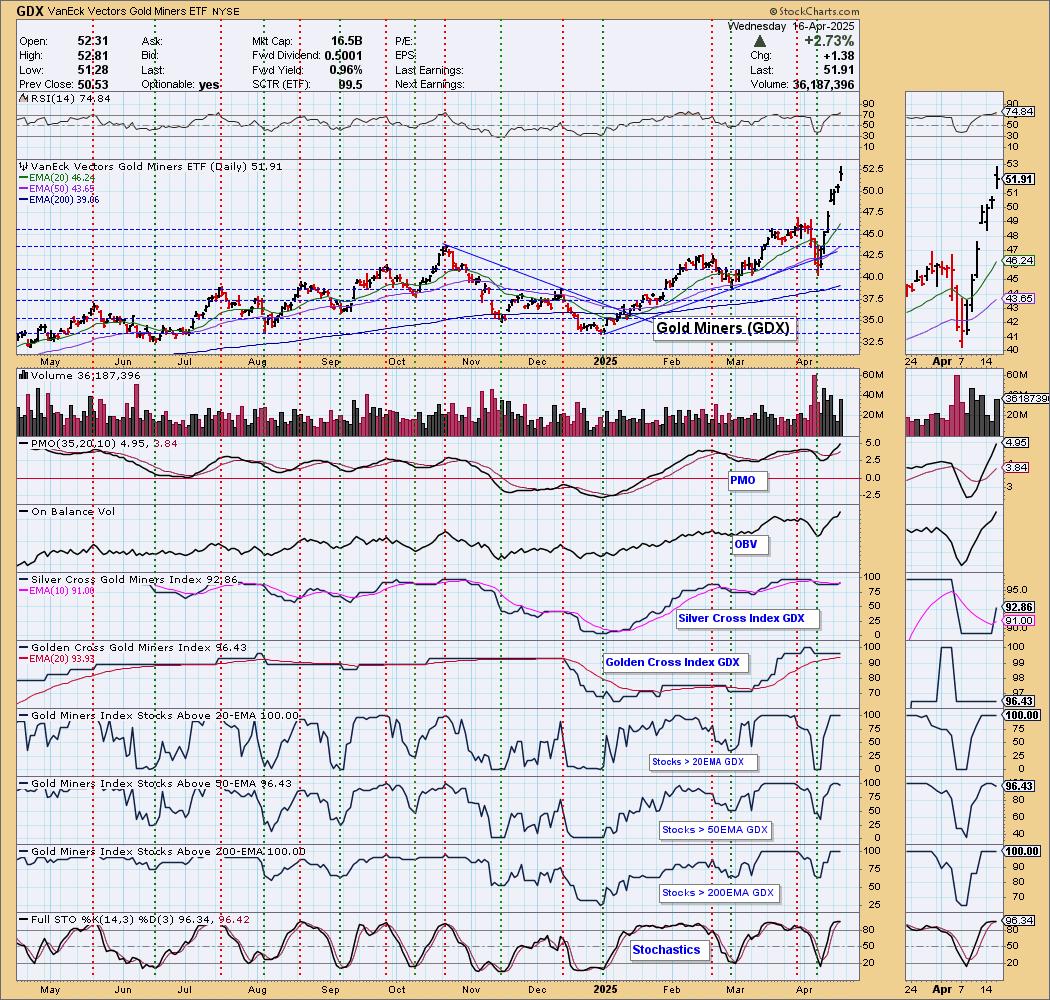
GOLD
IT Trend Model: BUY as of 1/10/2025
LT Trend Model: BUY as of 10/20/2023
GLD Daily Chart: Gold is ignoring overbought conditions and gapped up to new all-time highs. It is incredibly strong right now against the Dollar and the Dollar looks weak. We see more upside ahead, but wouldn't be surprised if we did at least see some consolidation given its overbought condition. However, with the Dollar so weak the wind will be at Gold's back.

Gold is definitely due for a cooling off period, but indicators are still very bullish. The PMO is rising strongly well above the zero line and Stochastics turned back up above 80. The rally in Gold isn't likely over.
GOLD MINERS (GDX) Daily Chart: Gold Miners are in a vertical rally and that will be hard to maintain. Of course Gold looks very bullish and that could easily keep this rally going further. It appears to be one of the teflon areas of the market right now. Participation is about as good as it can get so while it is a vertical rally, we don't think it is through moving higher. The RSI is overbought now so it is certainly due to cool off, but Gold just looks too good right now.
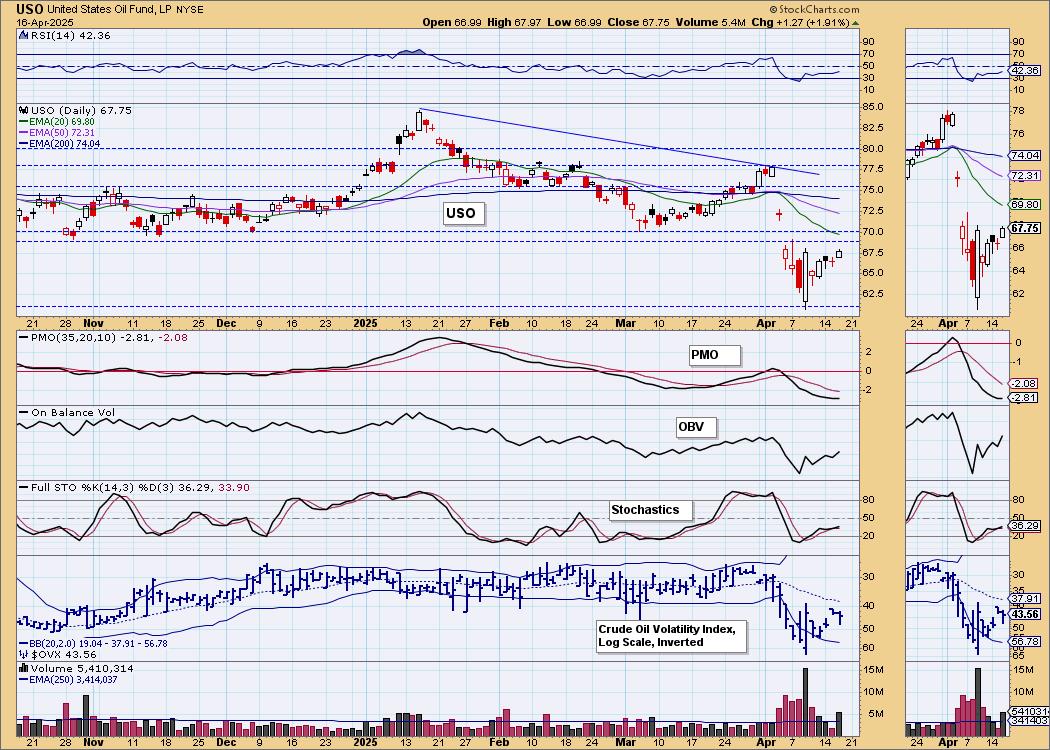
CRUDE OIL (USO)
IT Trend Model: NEUTRAL as of 2/27/2025
LT Trend Model: SELL as of 3/18/2025
USO Daily Chart: Crude is slowly making its way higher but there is a strong resistance zone arriving soon and we believe it will struggle there given how negative the PMO reading is. It is trying to turn up, but it is still weak below the zero line. We could see a bit more rally given Stochastics are still rising.

Good Luck & Good Trading!
Erin Swenlin and Carl Swenlin
Technical Analysis is a windsock, not a crystal ball. --Carl Swenlin
(c) Copyright 2025 DecisionPoint.com
Disclaimer: This blog is for educational purposes only and should not be construed as financial advice. The ideas and strategies should never be used without first assessing your own personal and financial situation, or without consulting a financial professional. Any opinions expressed herein are solely those of the author, and do not in any way represent the views or opinions of any other person or entity.
DecisionPoint is not a registered investment advisor. Investment and trading decisions are solely your responsibility. DecisionPoint newsletters, blogs or website materials should NOT be interpreted as a recommendation or solicitation to buy or sell any security or to take any specific action.
NOTE: The signal status reported herein is based upon mechanical trading model signals, specifically, the DecisionPoint Trend Model. They define the implied bias of the price index based upon moving average relationships, but they do not necessarily call for a specific action. They are information flags that should prompt chart review. Further, they do not call for continuous buying or selling during the life of the signal. For example, a BUY signal will probably (but not necessarily) return the best results if action is taken soon after the signal is generated. Additional opportunities for buying may be found as price zigzags higher, but the trader must look for optimum entry points. Conversely, exit points to preserve gains (or minimize losses) may be evident before the model mechanically closes the signal.
Helpful DecisionPoint Links:
DecisionPoint Alert Chart List
DecisionPoint Golden Cross/Silver Cross Index Chart List
DecisionPoint Sector Chart List
Price Momentum Oscillator (PMO)