
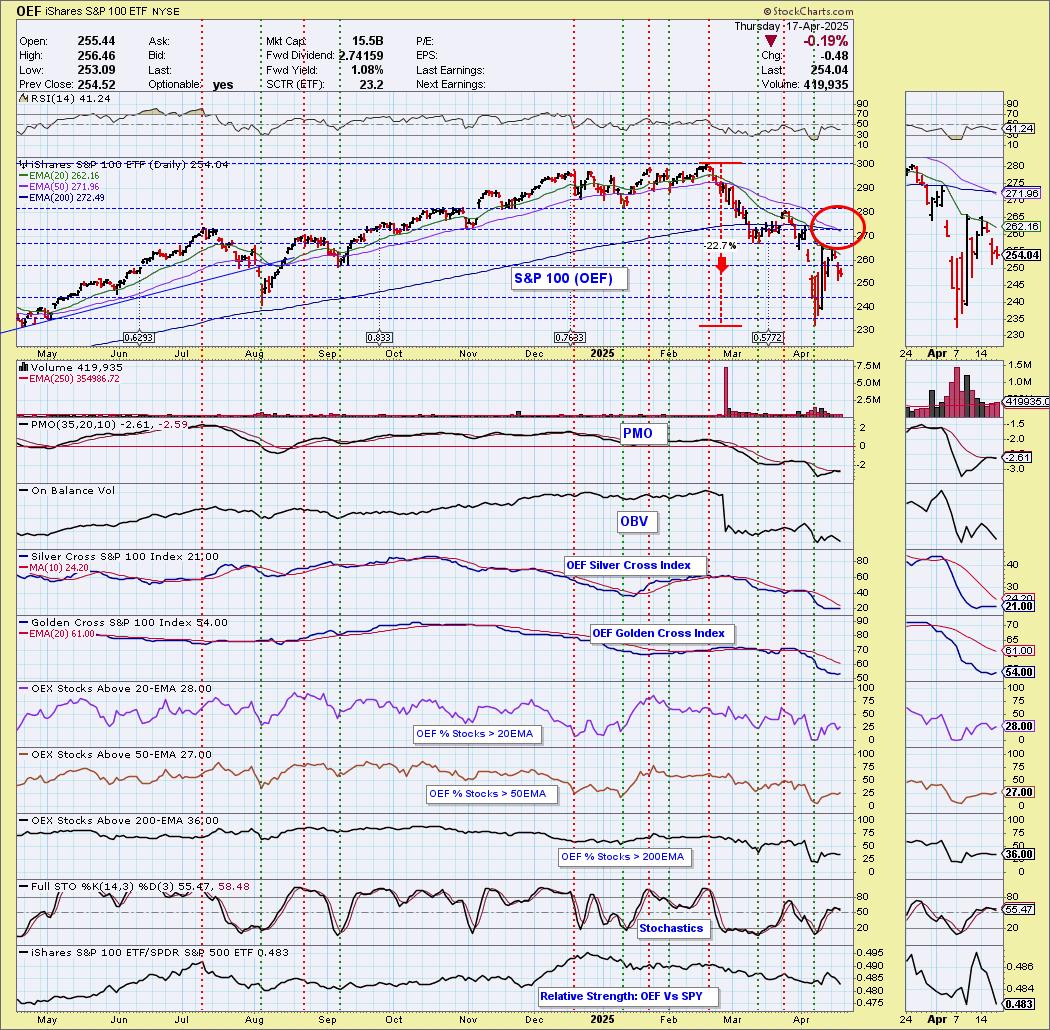
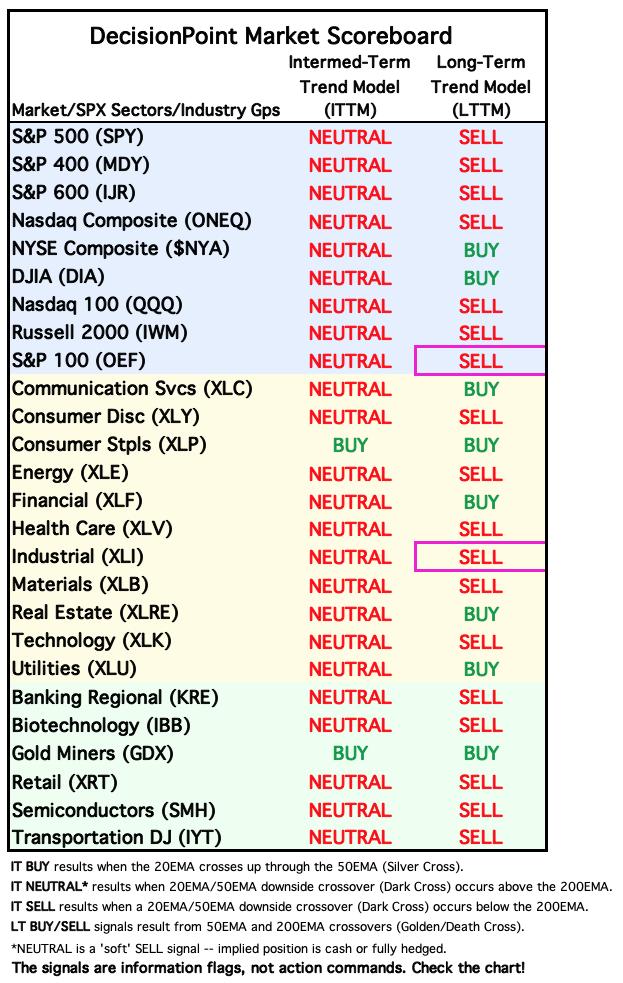
Today the S&P 100 Index ETF (OEF) 50-day EMA crossed down through the 200-day EMA (Death Cross), generating an IT Trend Model SELL Signal. Price is in a clear declining trend and is falling from there. The PMO is turning back down. Participation is very thin suggesting it will be difficult to get an upside reversal right now. Stochastics have topped and that is bearish for the short term as well. It is really underperforming the SPY right now and the SPY doesn't look that good.
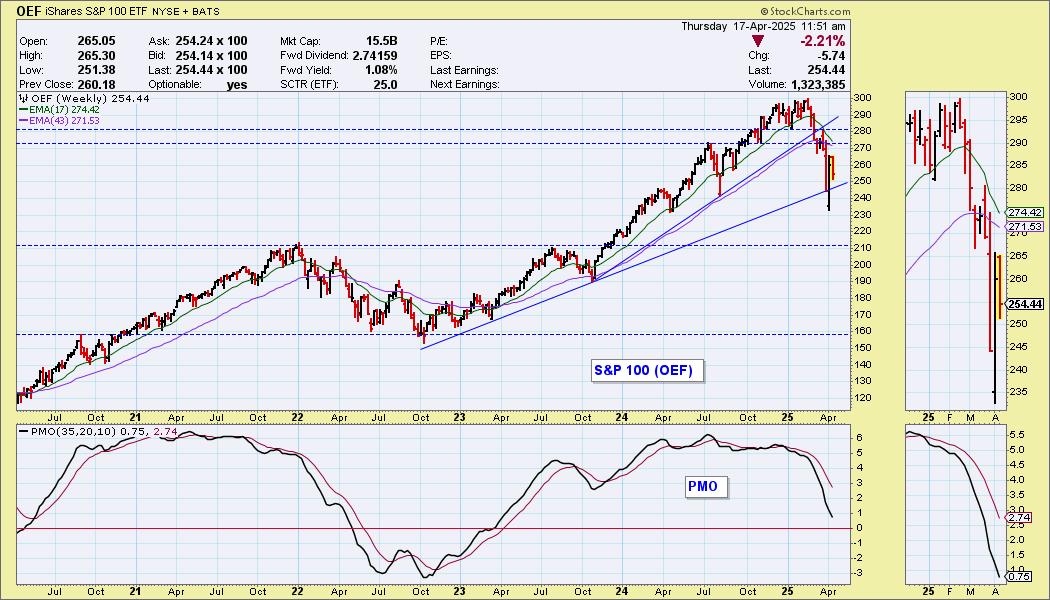
Last week saw a puncture of the long-term rising bottoms trendline. It held within this week, but the picture is still quite bearish given the weekly PMO is dropping almost vertically. The bear market doesn't look over for OEF.
__________
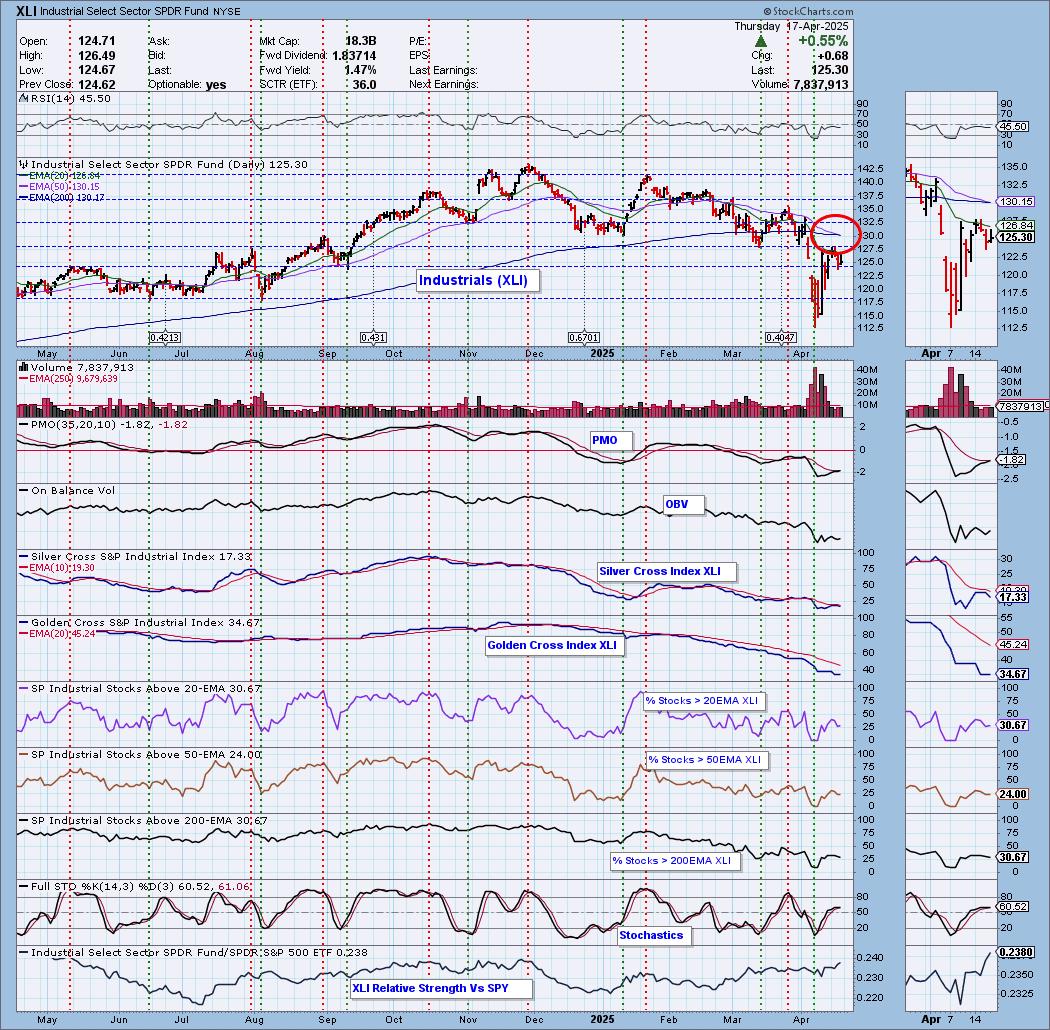
Today the Industrial Sector ETF (XLI) 50-day EMA crossed down through the 200-day EMA (Death Cross), generating an IT Trend Model SELL Signal. XLI hit overhead resistance and was turned away. We do have a new PMO Crossover BUY Signal in the making, but note that it is very negative. Not a lot to hang your hat on. The RSI is negative and not oversold. Participation is slowly bleeding out of the sector. The declining trend seems sturdy.
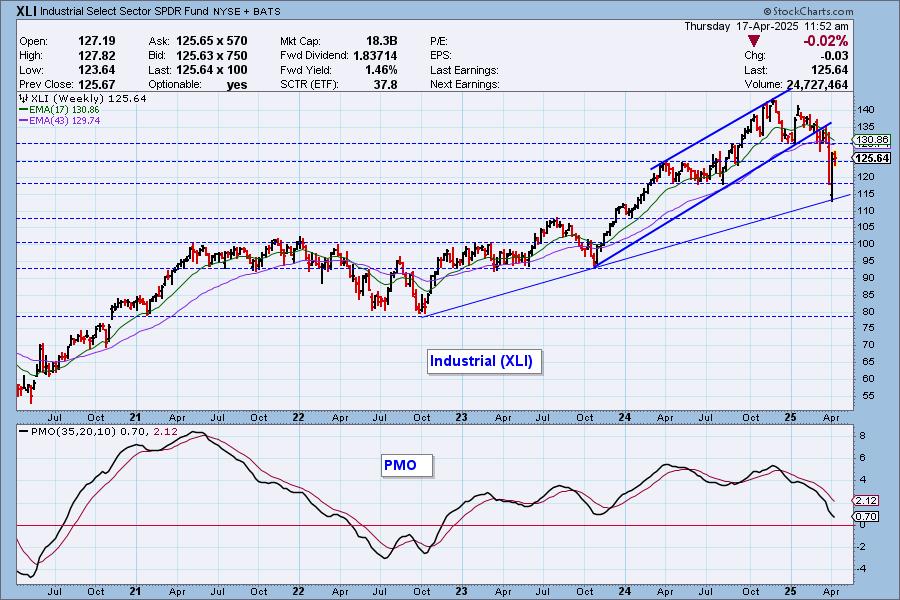
XLI managed an upside reversal before a serious puncture of the rising bottoms trendline. As with OEF though, the weekly PMO is dropping quickly and the declining trend doesn't look ready to be broken.
The DecisionPoint Alert Weekly Wrap presents an end-of-week assessment of the trend and condition of the Stock Market, the U.S. Dollar, Gold, Crude Oil, and Bonds. The DecisionPoint Alert daily report (Monday through Thursday) is abbreviated and gives updates on the Weekly Wrap assessments.
Watch the latest episode of DecisionPoint on our YouTube channel here!
MARKET/SPX SECTOR/INDUSTRY GROUP INDEXES
Change Today: 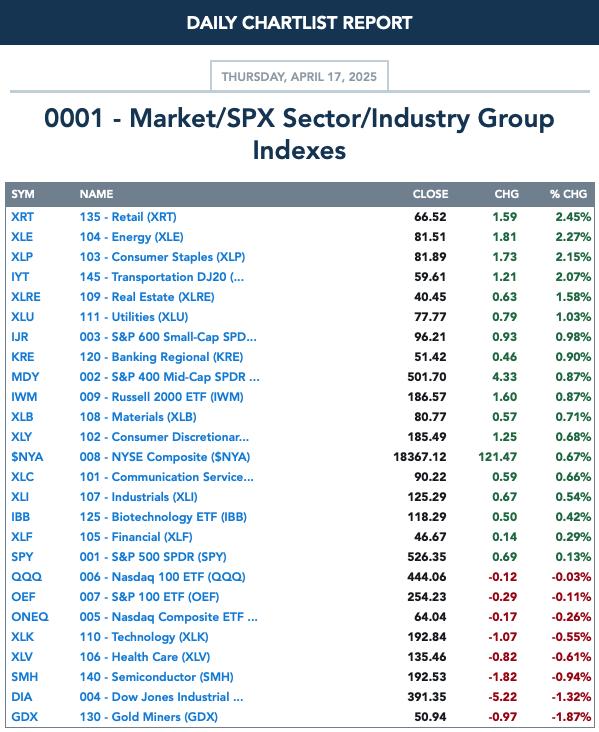
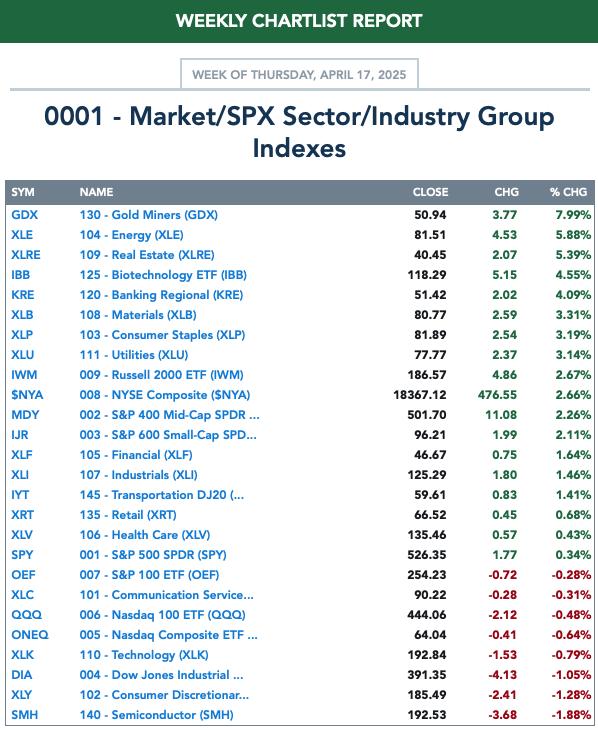
Change for the Week:
CLICK HERE for Carl's annotated Market Index, Sector, and Industry Group charts.
THE MARKET (S&P 500)
IT Trend Model: NEUTRAL as of 3/4/2025
LT Trend Model: BUY as of 3/29/2023
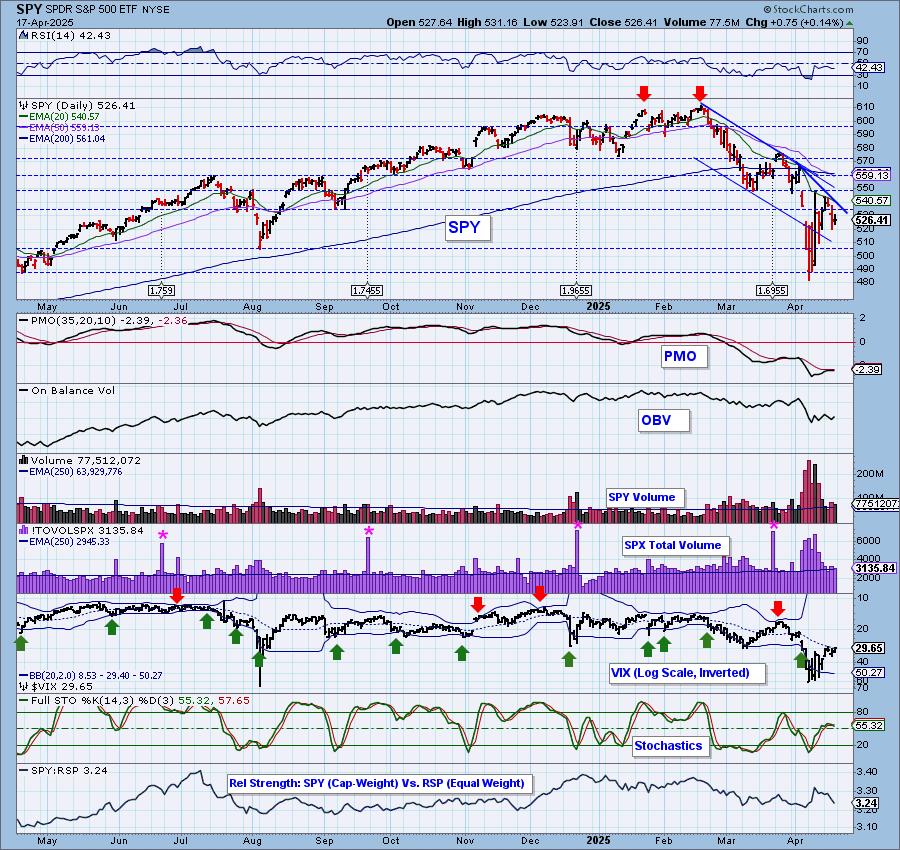
SPY 10-Minute Chart: The market was up most of the day, but price began to fail in the afternoon and it closed near the open. The 10-minute PMO is falling on a Crossover SELL Signal so it doesn't look too good for Monday.
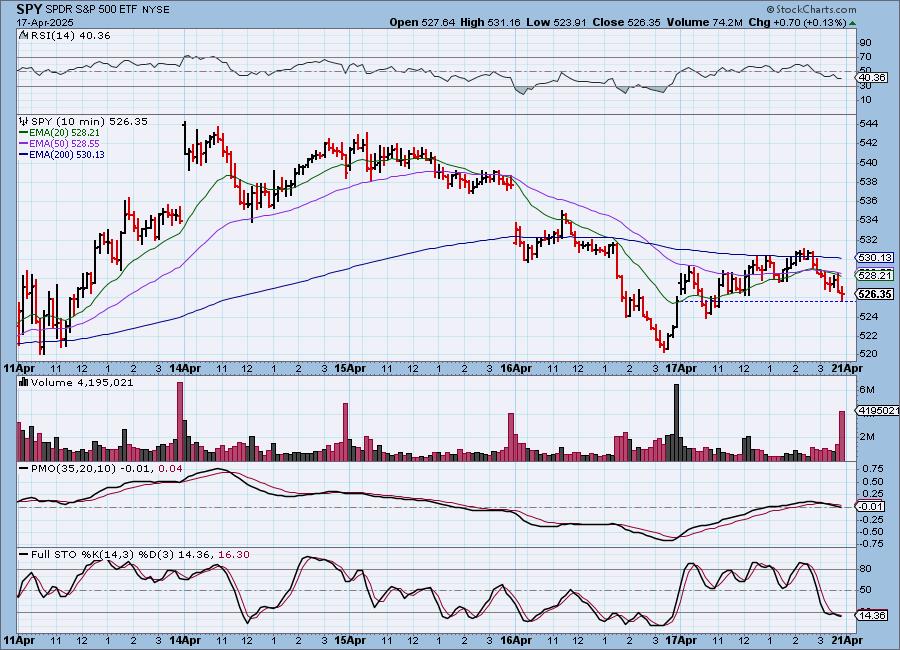
SPY Daily Chart: We formed an accelerated declining trend this week as the rally from last week was damaged. We checked and the PMO is still technically rising, but remember it is very negative below the zero line so this is likely showing us diminishing weakness, not new strength.
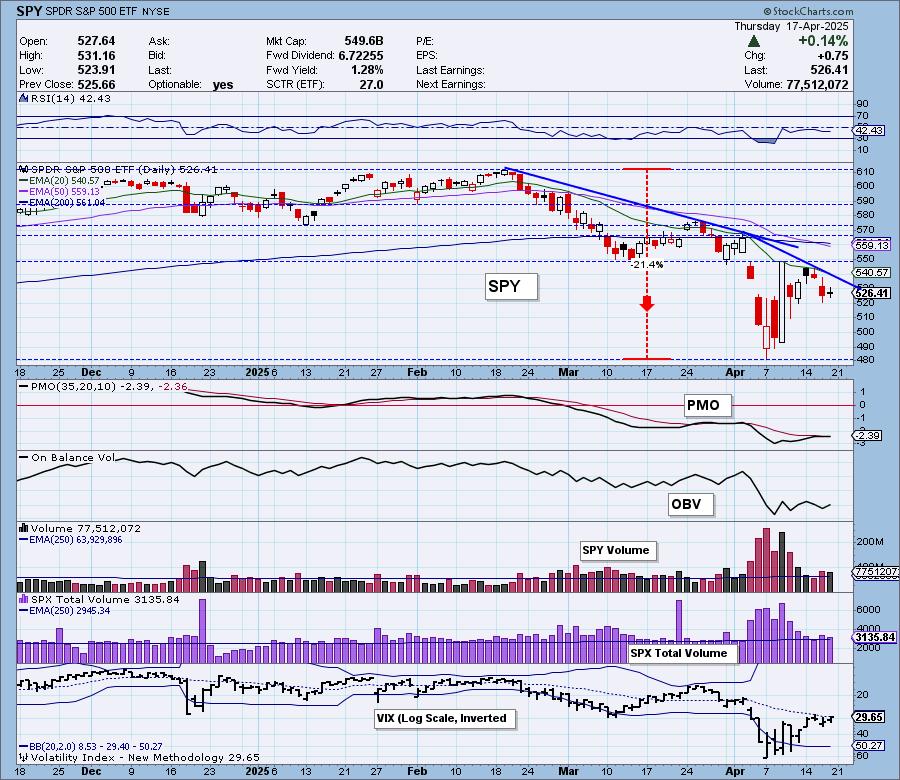
The VIX stayed below its moving average on the inverted scale as fear is still showing in the reading. Stochastics have topped. We see internal weakness with both these indicators.
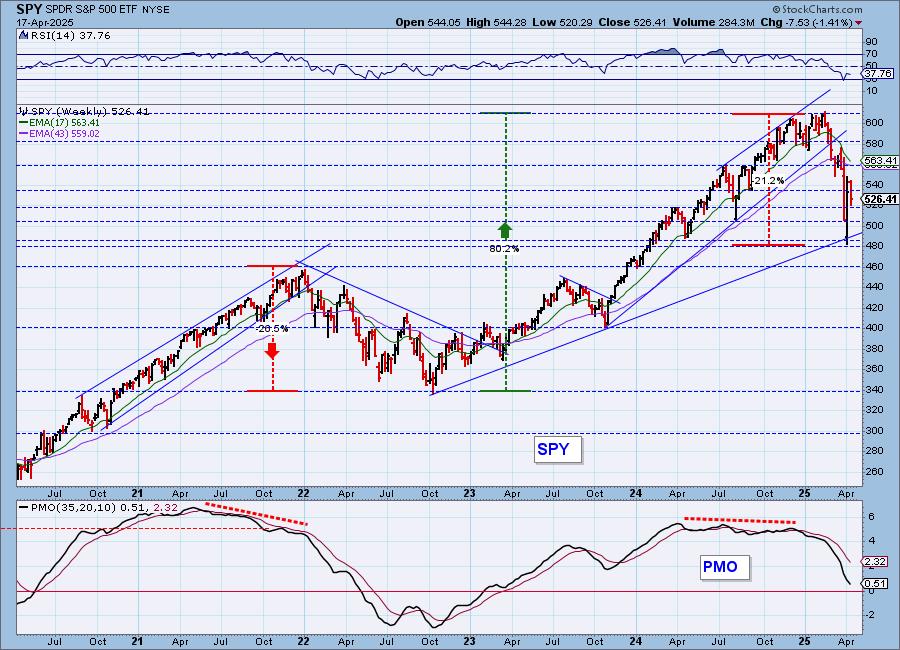
SPY Weekly Chart: Last week the rising bottoms trendline was broken but price closed well above it and this week it is holding above it. Still the decline looks very dangerous as price moves almost vertically lower. The weekly PMO is dropping quickly so this rising trend is still vulnerable.
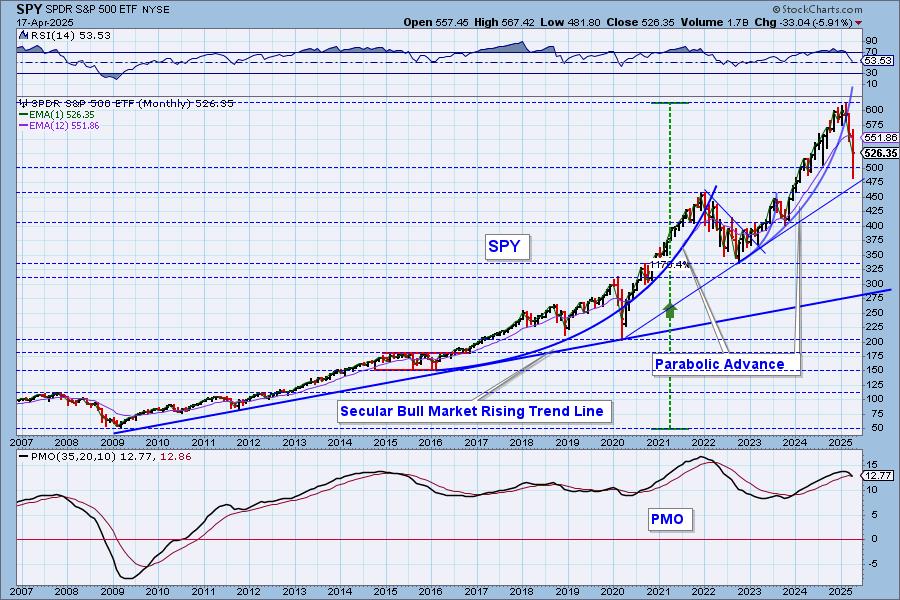
SPY Monthly Chart: It's not the end of the month, but we thought it a good idea to show you this chart. The decline looks treacherous on the monthly chart out of a parabolic advance. We have new monthly PMO SELL Signal currently on the chart (it won't be 'final' until the end of the month). It's hard to imagine that this decline will turn around when we see it on the monthly chart.
New 52-Week Highs/Lows: We saw an equal amount of New Highs and New Lows. They are still negligible and aren't telling us much. We do note that the High-Low Differential has turned up which is very good. We'll see how this plays out.
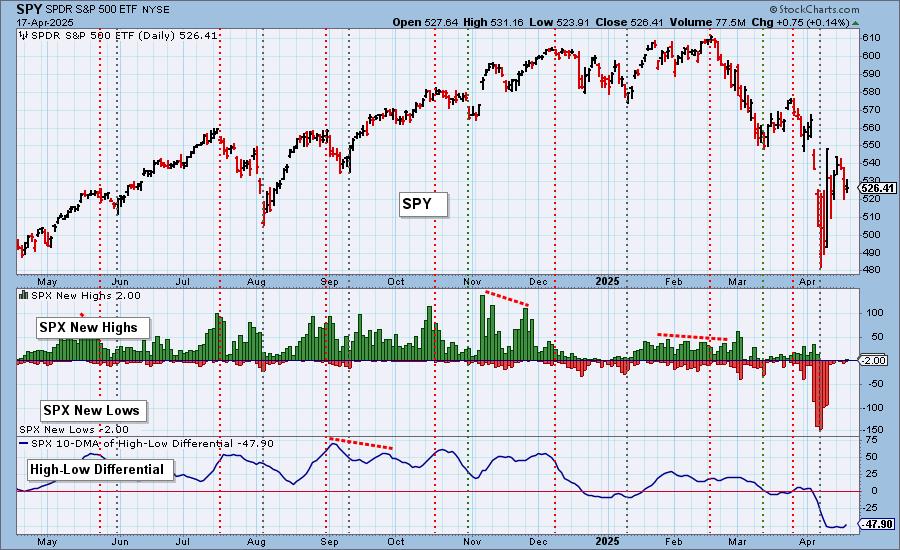
Climax Analysis: There was only one climax reading today so it is not a climax day. Total Volume was on its average.
*A climax is a one-day event when market action generates very high readings in, primarily, breadth and volume indicators. We also include the VIX, watching for it to penetrate outside the Bollinger Band envelope. The vertical dotted lines mark climax days -- red for downside climaxes, and green for upside. Climaxes are at their core exhaustion events; however, at price pivots they may be initiating a change of trend.
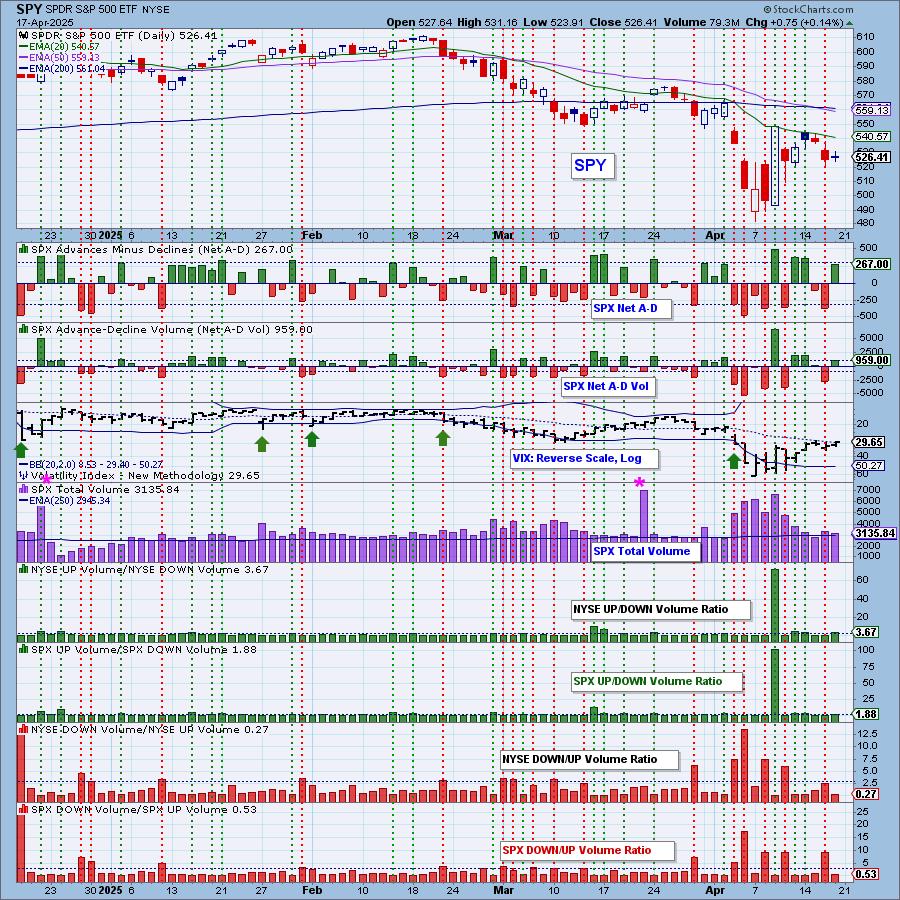
Short-Term Market Indicators: The short-term market trend is DOWN and the condition is NEUTRAL.
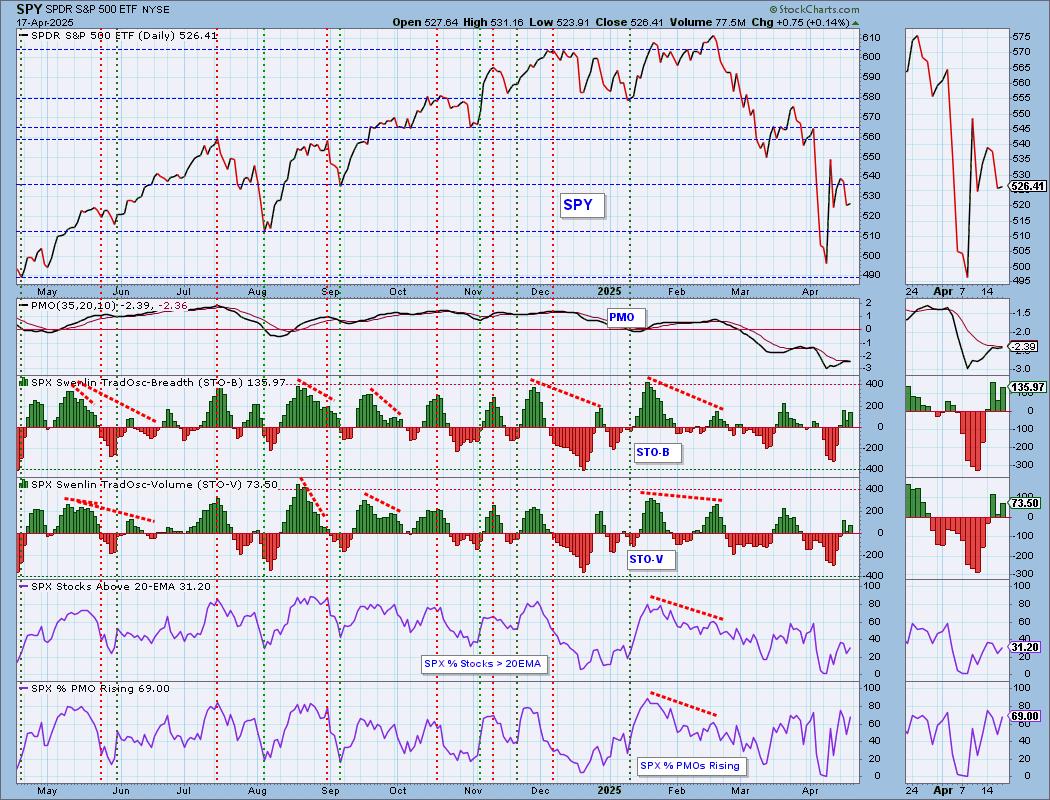
Both Swenlin Trading Oscillators (STOs) have reversed higher and are in positive territory. This could mean a possible upside move next week, but they have been hit and miss as they rise and fall. Right now they are struggling to come up with a direction. Participation did inch higher on the rally and we saw an improvement in the number of rising PMOs. Both of those indicators are in rising trends.
Intermediate-Term Market Indicators: The intermediate-term market trend is DOWN and the condition is NEUTRAL.
STOs turned up and so did the ITBM and ITVM. This is confirming the STOs which are also now rising. This is promising. We also saw more PMO BUY Signals enter the market.

_______
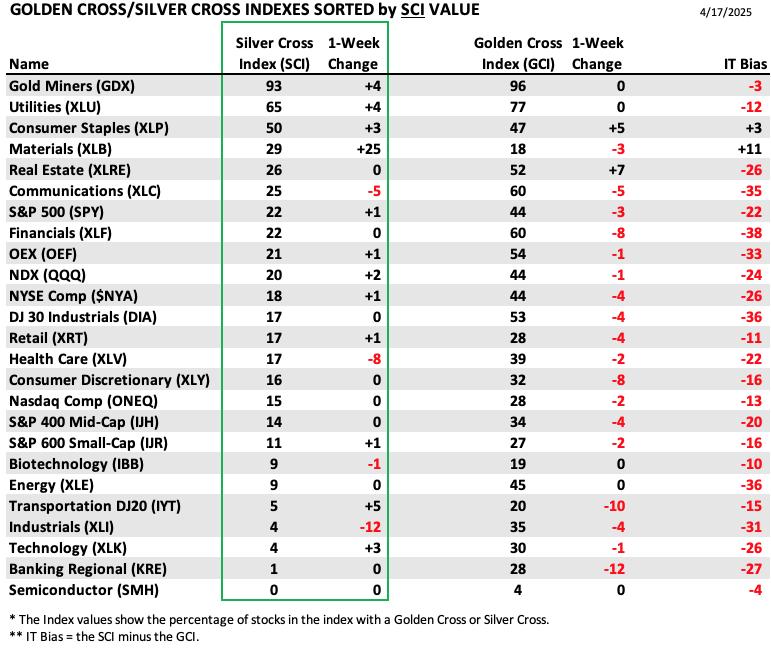
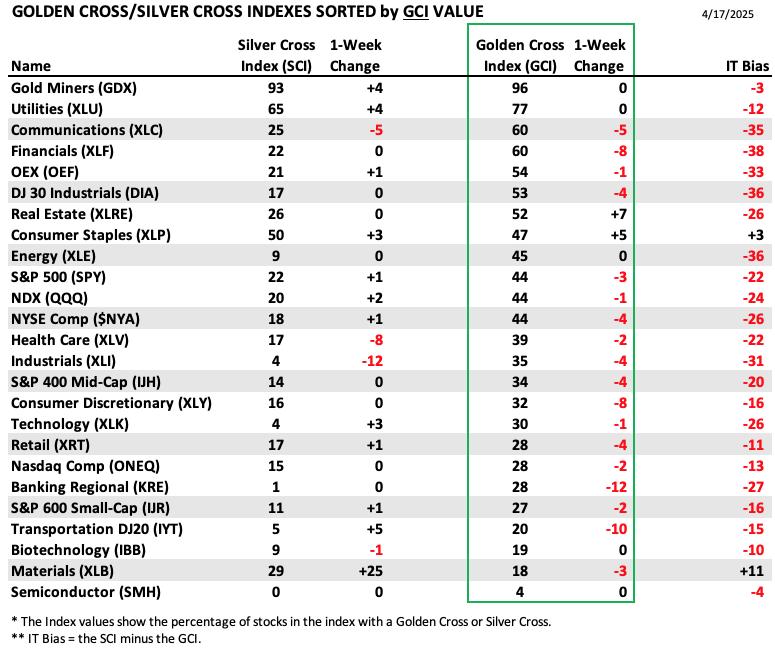
PARTICIPATION TABLES: The following tables summarize participation for the major market indexes and sectors. The 1-Week Change columns inject a dynamic aspect to the presentation. There are three groups: Major Market Indexes, Miscellaneous Industry Groups, and the 11 S&P 500 Sectors.
Materials (XLB) surprisingly holds the highest IT Bias. This is due to the huge gains it saw on the Silver Cross Index. This is a sector we should keep an eye on given this big push on the Silver Cross Index.
The worst IT Bias belongs to Financials (XLF). The foundation is slipping away as it lost 8 percentage points on the Golden Cross Index.
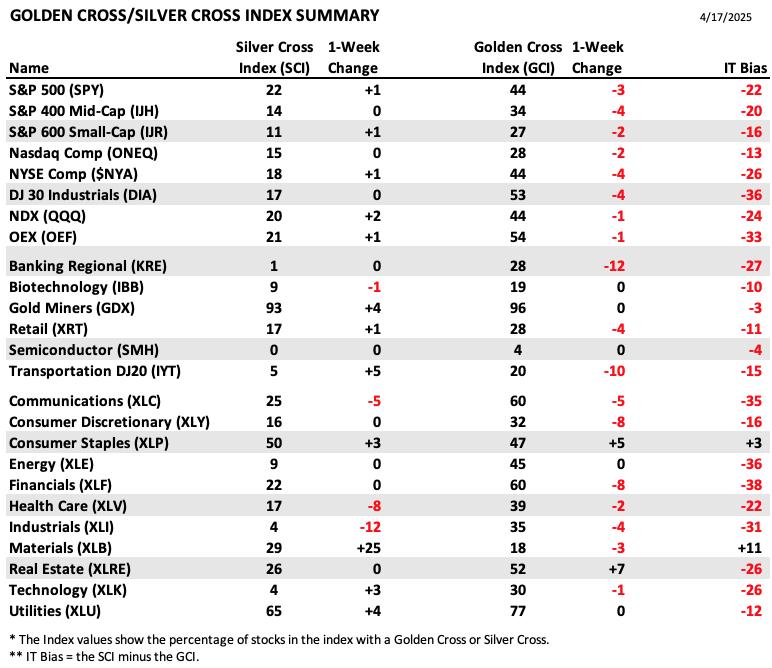
This table is sorted by SCI values. This gives a clear picture of strongest to weakest index/sector in terms of intermediate-term participation.
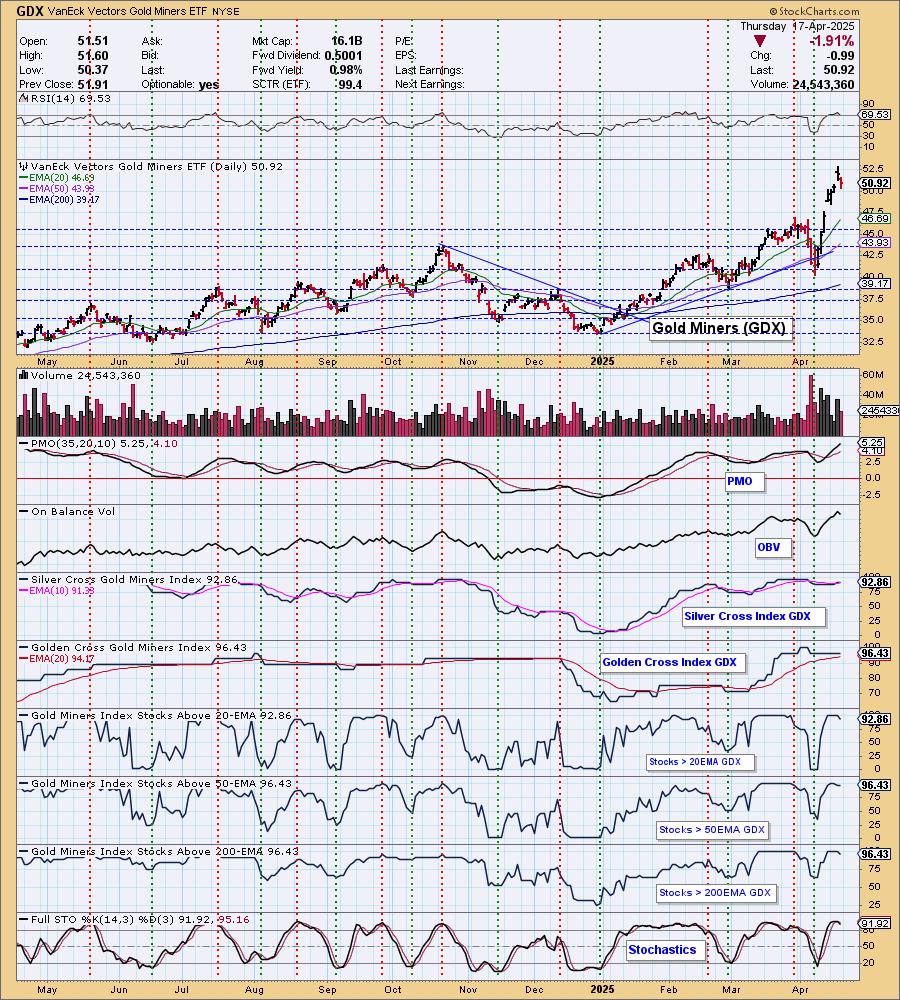
Gold Miners (GDX) are the clear winners right now as you can see they gained more points on the SCI this week and are at the top of the table.
Semiconductors currently show NO stocks with a 20-day EMA greater than the 50-day EMA as the SCI is at zero. This beat down group is certainly oversold, but this market isn't going to be conducive to a rally for SMH.
This table is sorted by GCI values. This gives a clear picture of strongest to weakest index/sector in terms of long-term participation.
Gold Miners (GDX) not surprisingly are at the top of the GCI table as well. They didn't gain any points, but there aren't too many more they can gain.
Regional Banks (KRE) lost 12 points on the GCI. This is a group in serious trouble right now as the foundation is clearly cracking. They only hold one percentage point on the SCI as well. Beware.
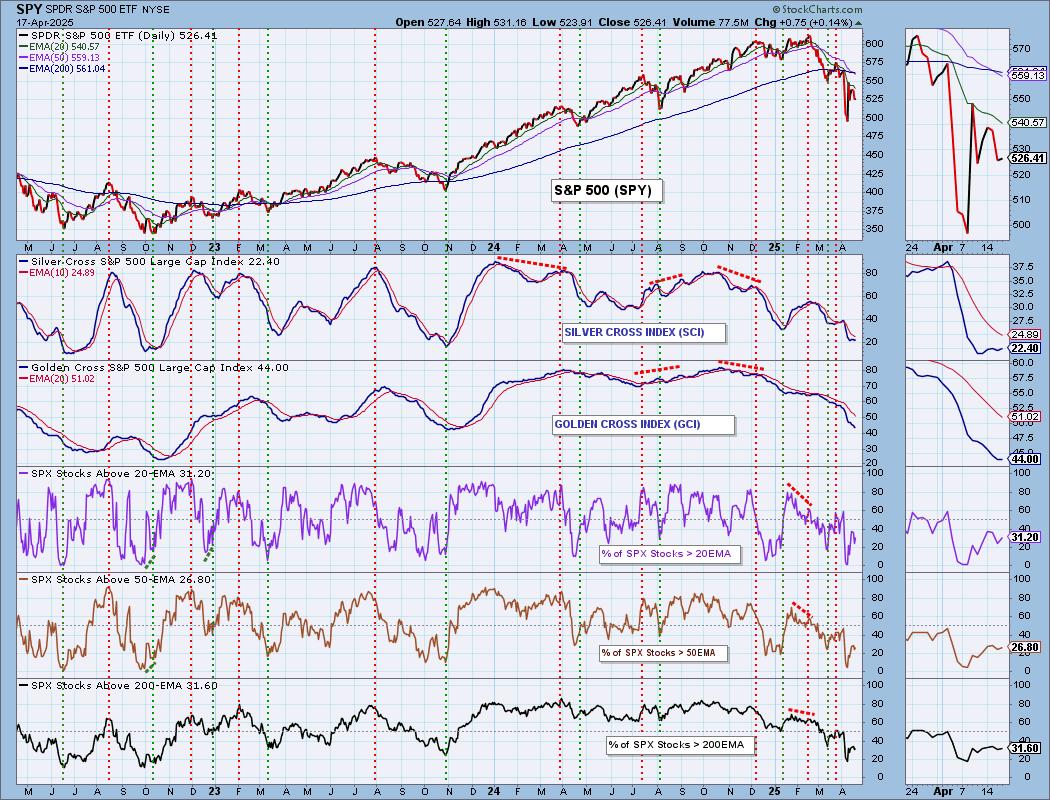
PARTICIPATION CHART (S&P 500): The following chart objectively shows the depth and trend of participation for the SPX in two time frames.
- Intermediate-Term - the Silver Cross Index (SCI) shows the percentage of SPX stocks on IT Trend Model BUY signals (20-EMA > 50-EMA). The opposite of the Silver Cross is a "Dark Cross" -- those stocks are, at the very least, in a correction.
- Long-Term - the Golden Cross Index (GCI) shows the percentage of SPX stocks on LT Trend Model BUY signals (50-EMA > 200-EMA). The opposite of a Golden Cross is the "Death Cross" -- those stocks are in a bear market.
The market bias is BEARISH in the intermediate and long terms.
Participation did inch higher on today's rally, but ultimately all are in declining trends which is confirming the decline in the market. Interestingly the Silver Cross Index turned back up today. It could still continue to rise as we do have more stocks above their 20/50-day EMAs versus those holding silver crosses. The Golden Cross Index on the other hand is higher than stocks above their 200-day EMAs so it should continue to move even lower from here. Both the Silver Cross Index and Golden Cross Index are below their signal lines so the IT and LT Biases are BEARISH.
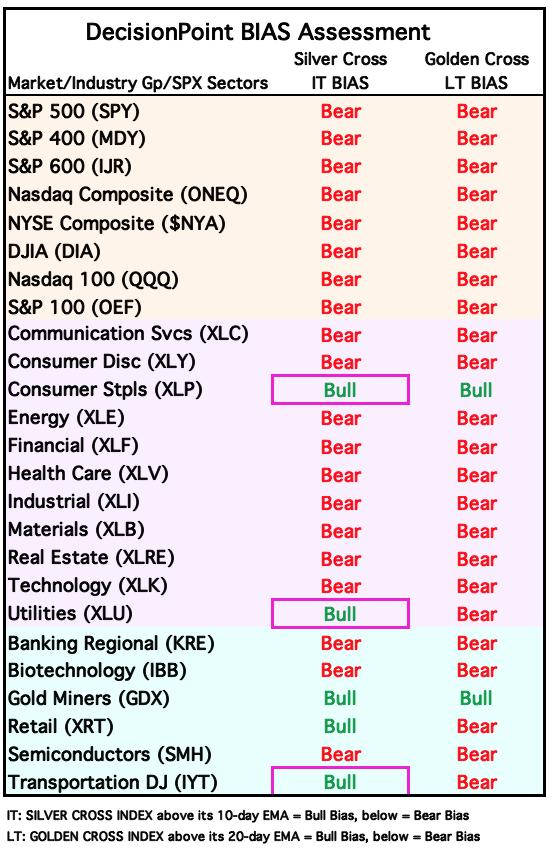
BIAS Assessment: The following table expresses the current BIAS of various price indexes based upon the relationship of the Silver Cross Index to its 10-day EMA (intermediate-term), and of the Golden Cross Index to its 20-day EMA (long-term). When the Index is above the EMA it is bullish, and it is bearish when the Index is below the EMA. The BIAS does not imply that any particular action should be taken. It is information to be used in the decision process.
The items with highlighted borders indicate that the BIAS changed today.
*****************************************************************************************************
CONCLUSION: We still think we need to further work out yesterday's downside initiation climax. The fact that the rally failed to hold up today suggests short-term weakness. We have an accelerated declining tops trendline. Granted the STOs, ITBM/ITVM and High-Low Differential turned up today, but we don't see much strength based declining Stochastics and a weak VIX. It is encouraging that indicators turned up so we can't rule out a possible rally next week. The PMO while rising (barely) is in highly negative territory so if we do get a rally, the foundation is still weak. Have a wonderful Easter weekend!
Erin is __% long, __% short. (This is intended as information, not a recommendation.)
*****************************************************************************************************
CALENDAR
BITCOIN
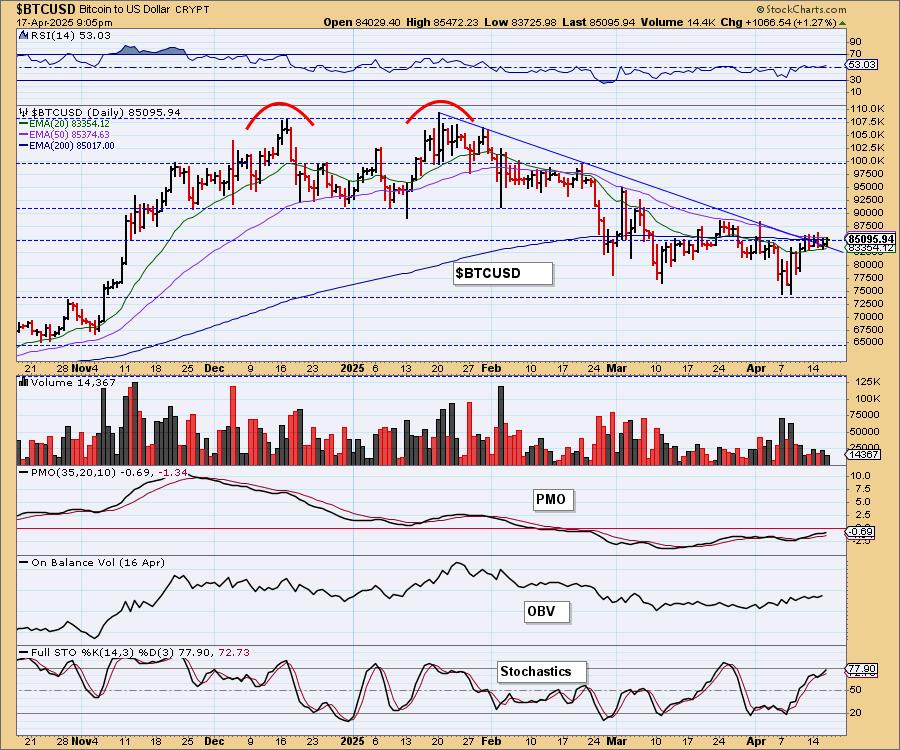
Bitcoin Daily Chart: Bitcoin is now beginning to break from its declining tops trendline. We've been waiting for this for weeks. Unfortunately it isn't really a 'breakout' as price is simply drifting sideways out of the trend. That isn't a huge vote of confidence. The RSI is neutral and while the PMO is rising, it is negative. Stochastics look good, but we haven't gotten much off their rise so far. We would suggest that we'll see more sideways action as Bitcoin waits for some type of catalyst to higher prices.
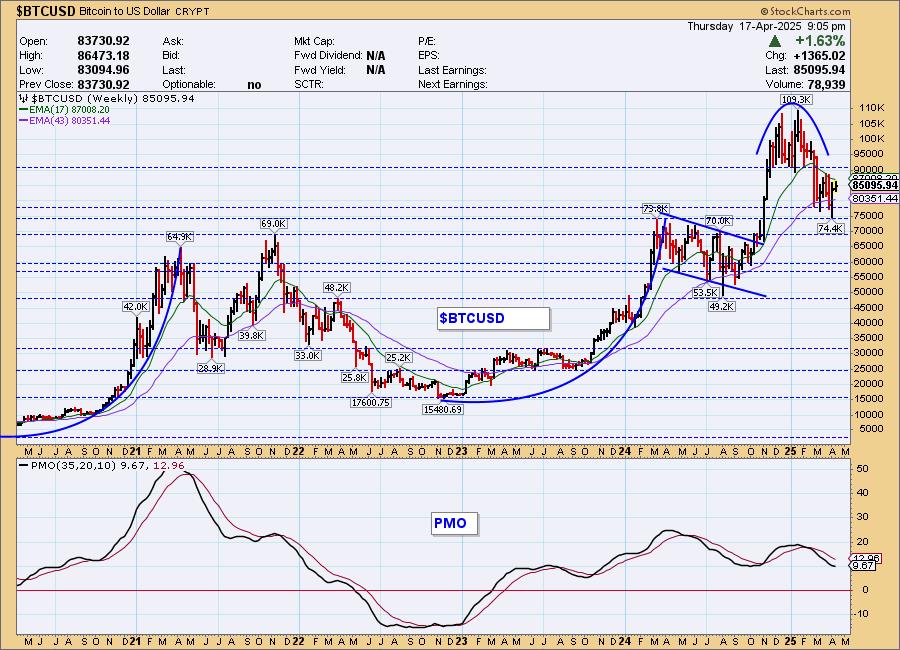
Bitcoin Weekly Chart: After dropping out of the rounded top formation, price is now consolidating sideways and we think that will likely continue. The weekly PMO has decelerated, but is still in decline.
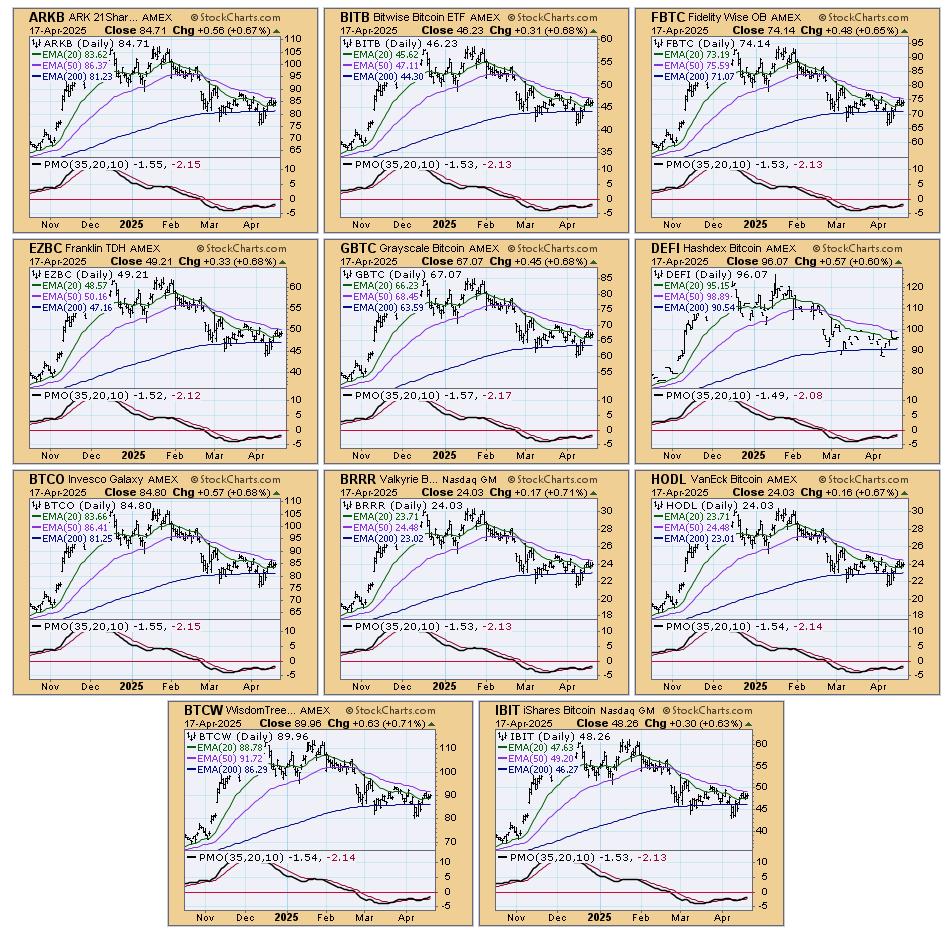
BITCOIN ETFs
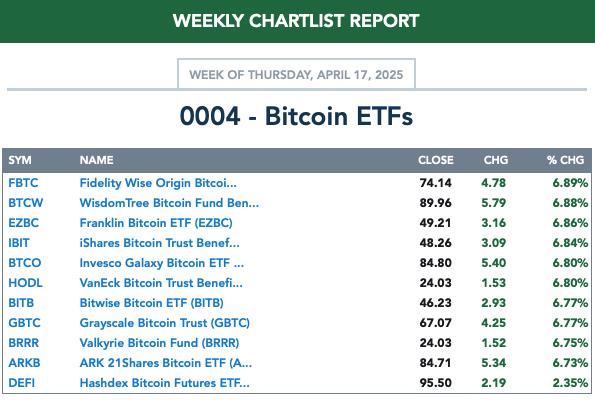
Today:
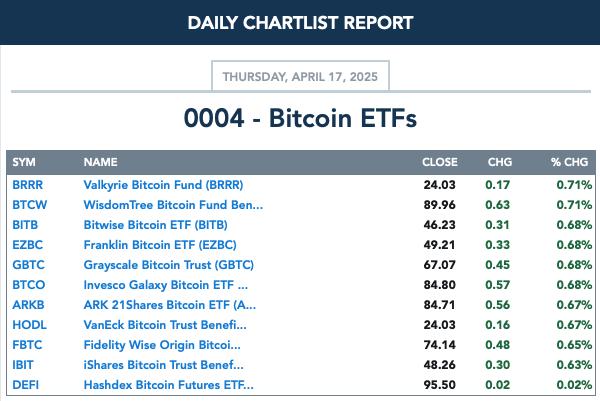
This Week:
INTEREST RATES
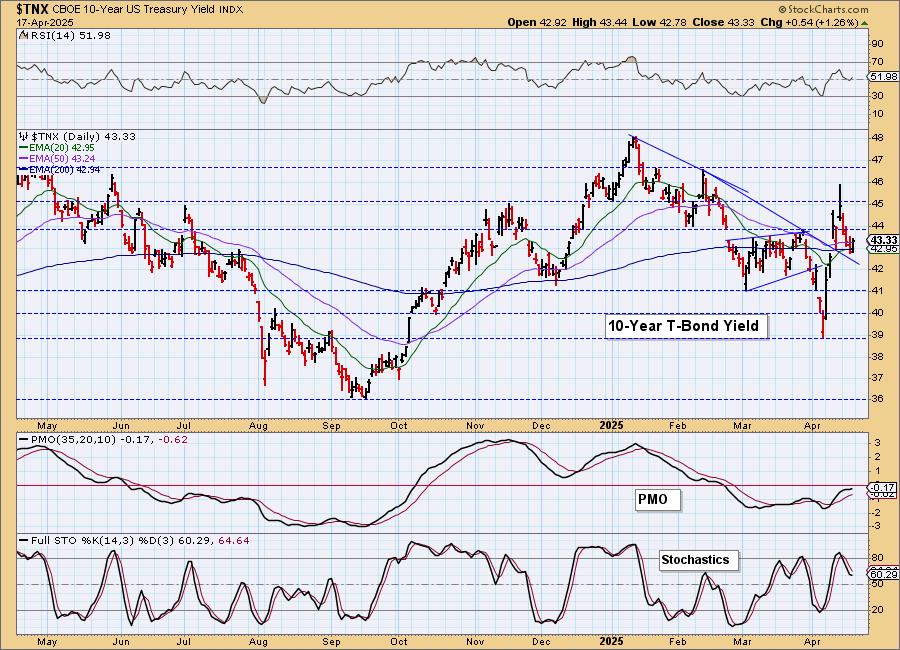
Yields ticked higher today. $TNX, the 10-year yield is looking a little more bullish so we do think that yields could rise from here. Bond buying is muted right now.
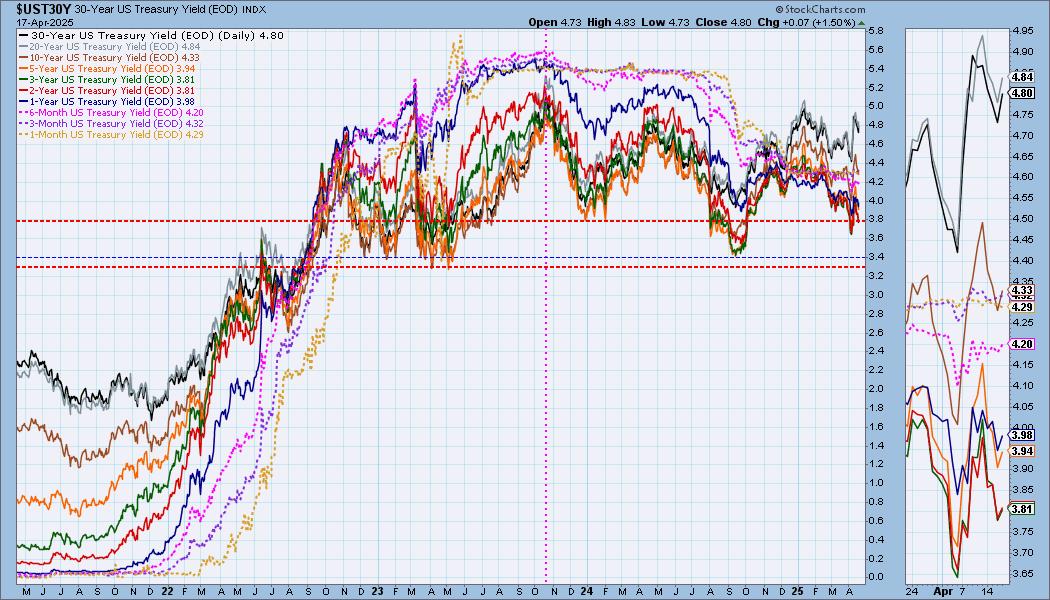
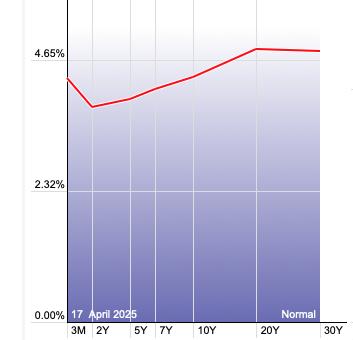
The Yield Curve Chart from StockCharts.com shows us the inversions taking place. The red line should move higher from left to right. Inversions are occurring where it moves downward.
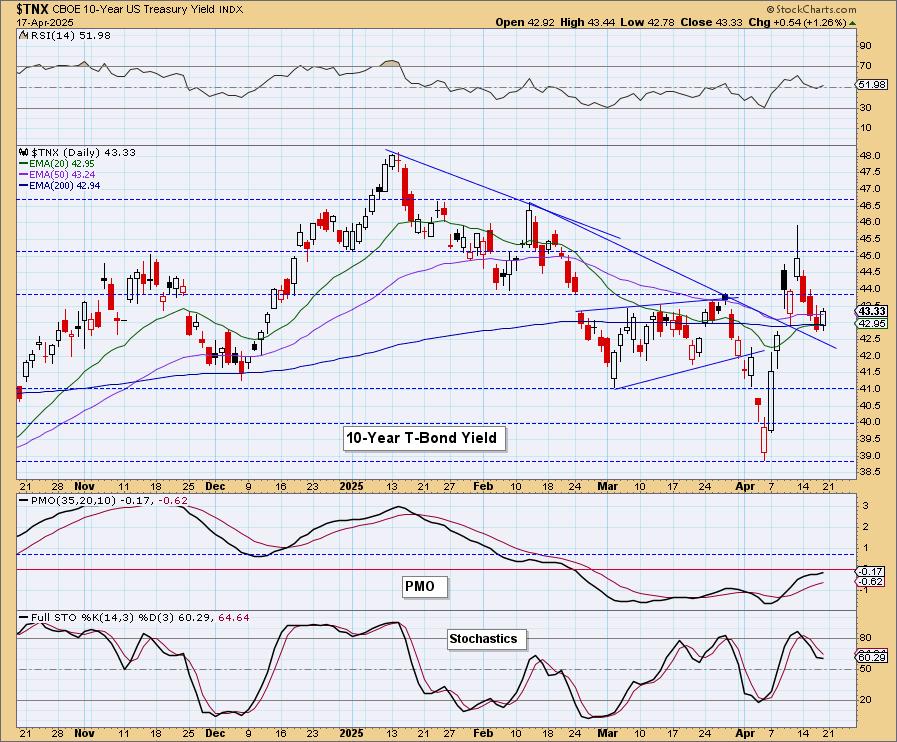
10-YEAR T-BOND YIELD
$TNX rebounded off the 200-day EMA today. Stochastics aren't inspiring so we aren't looking for a big rebound here, but we can't count it out given the PMO is rising and is almost back above the zero line. We're also considering that we could have a flag formation here which is bullish.
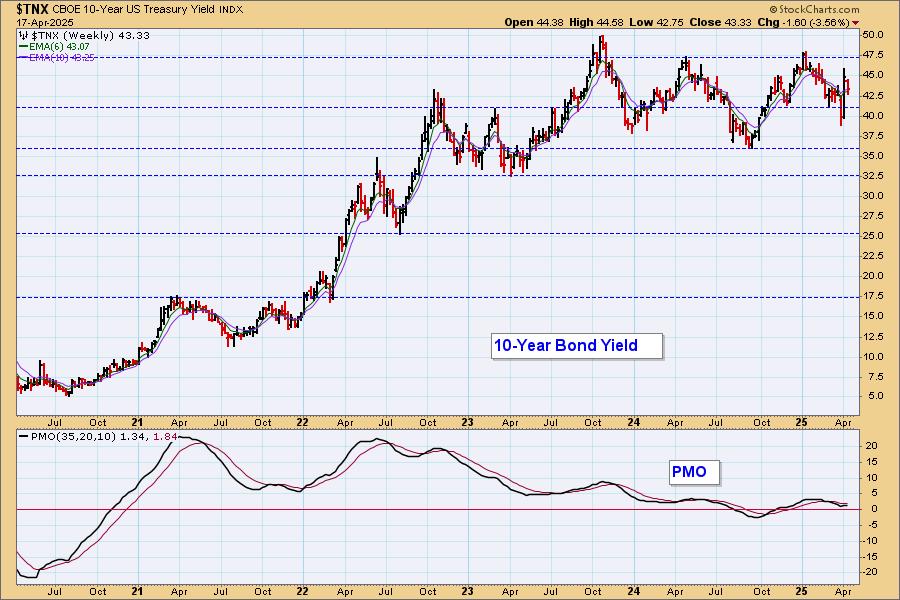
10-Year Bond Yield Weekly Chart: The yield has been in a sideways range for weeks. It really appeared it was ready to test the bottom of the range, but it reversed higher. If it does rise further, we wouldn't expect a breakout as overhead resistance appears very strong. The weekly PMO is technically rising above the zero line.
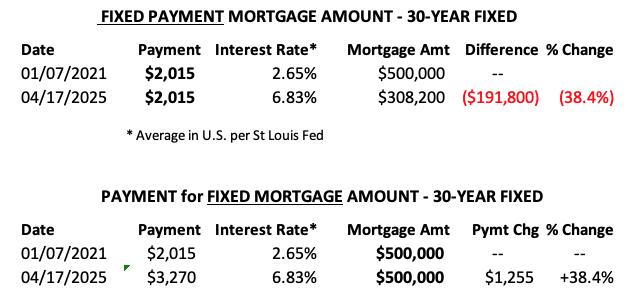
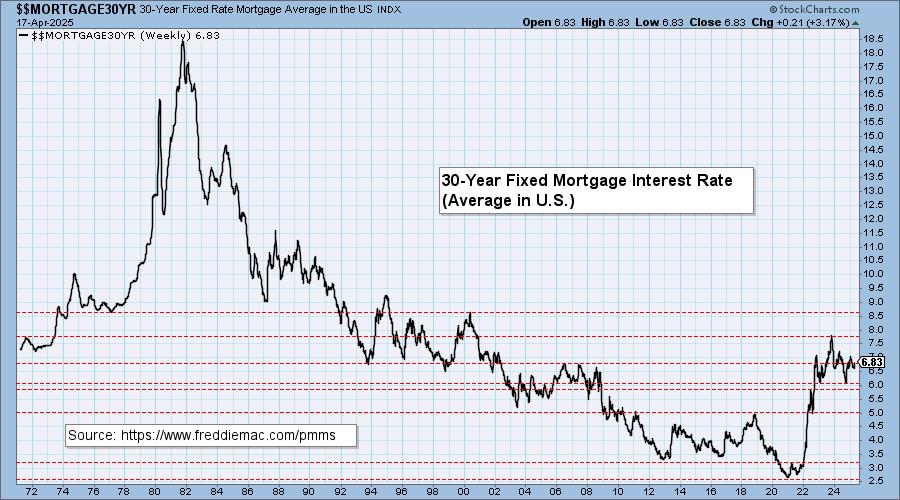
MORTGAGE INTEREST RATES (30-Yr)**
**We watch the 30-Year Fixed Mortgage Interest Rate, because, for the most part, people buy homes based upon the maximum monthly payment they can afford. As rates rise, a fixed monthly payment will carry a smaller mortgage amount, which shuts many buyers out of the market, and potential sellers will experience pressure to lower prices (to no effect so far).
--
This week the 30-Year Fixed Rate changed from 6.62 to 6.83.

Here is a 50-year chart for better perspective.
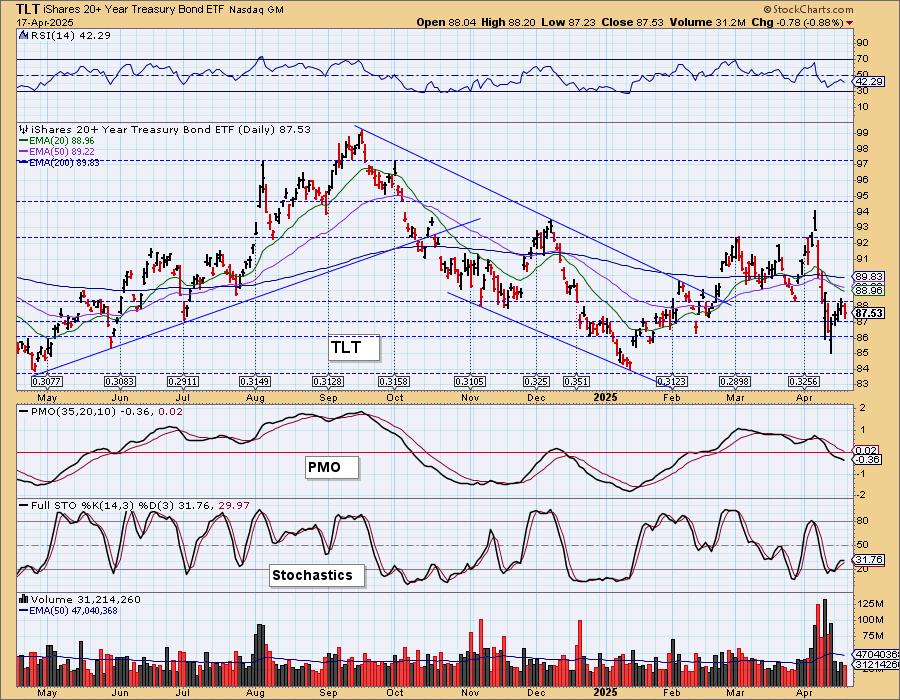
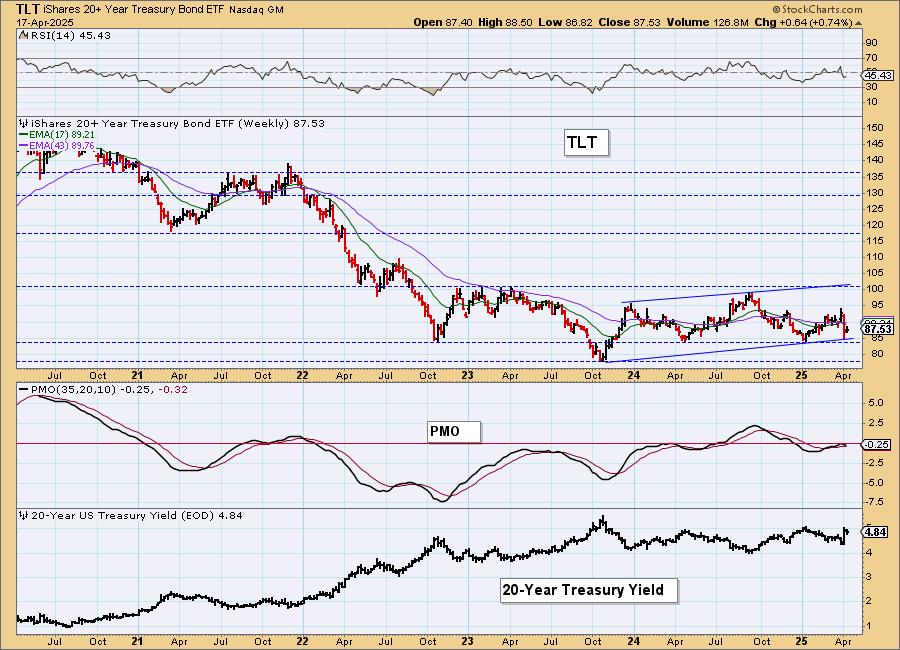
BONDS (TLT)
IT Trend Model: SELL as of 4/14/2025
LT Trend Model: SELL as of 12/13/2024
TLT Daily Chart: We've been monitoring a bullish cup with handle pattern, but the handle has gotten unruly. We see a bearish reverse flag on the chart right now and Stochastics are turning back down. The PMO is in decline. It appears this rally may be over.
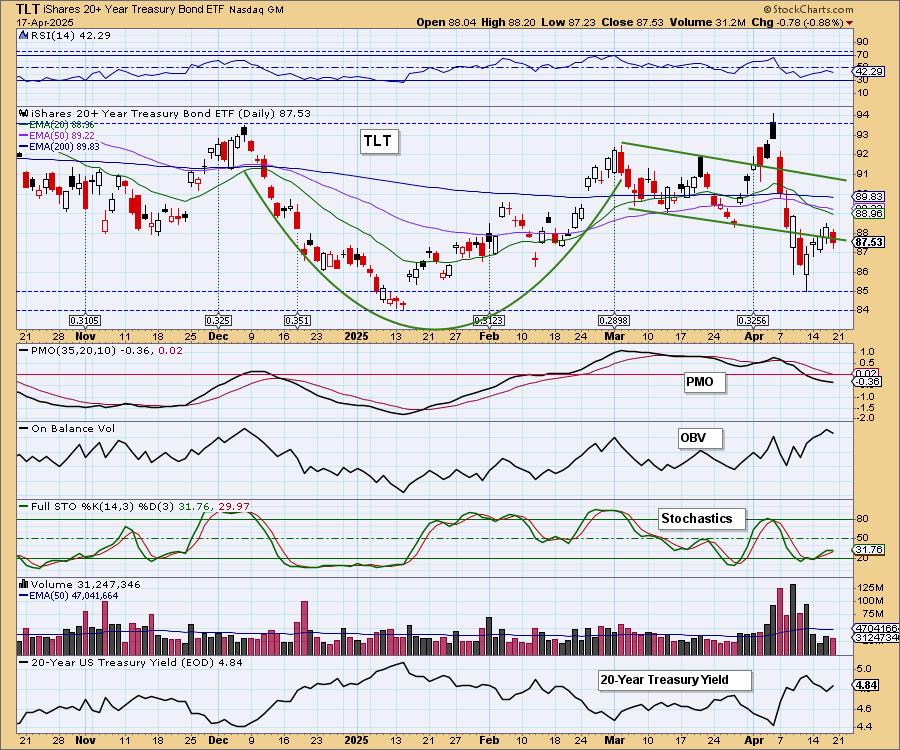
TLT Weekly Chart: We see a rising trend on the weekly chart and so far price is holding above it. However, the weekly PMO has topped beneath the zero line so it isn't likely to hold up.
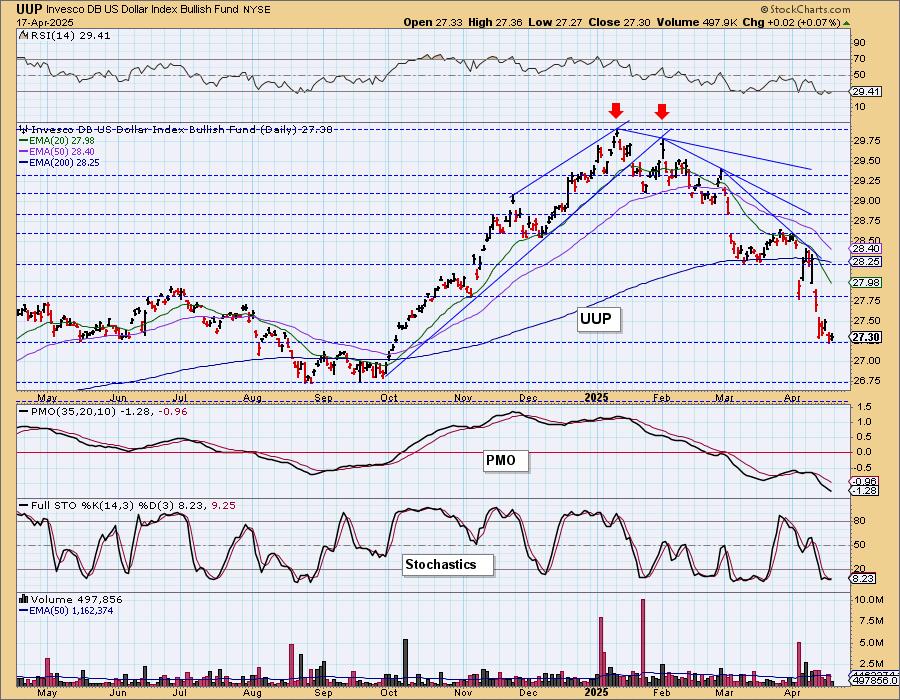
DOLLAR (UUP)
IT Trend Model: NEUTRAL as of 3/5/2025
LT Trend Model: BUY as of 5/25/2023
UUP Daily Chart: The Dollar remains weak. It is overdue for a bounce given the RSI is in oversold territory. Weakness is still very visible with the very negative PMO falling further and Stochastics camping out below 20. We would look for more decline in spite of the oversold RSI.
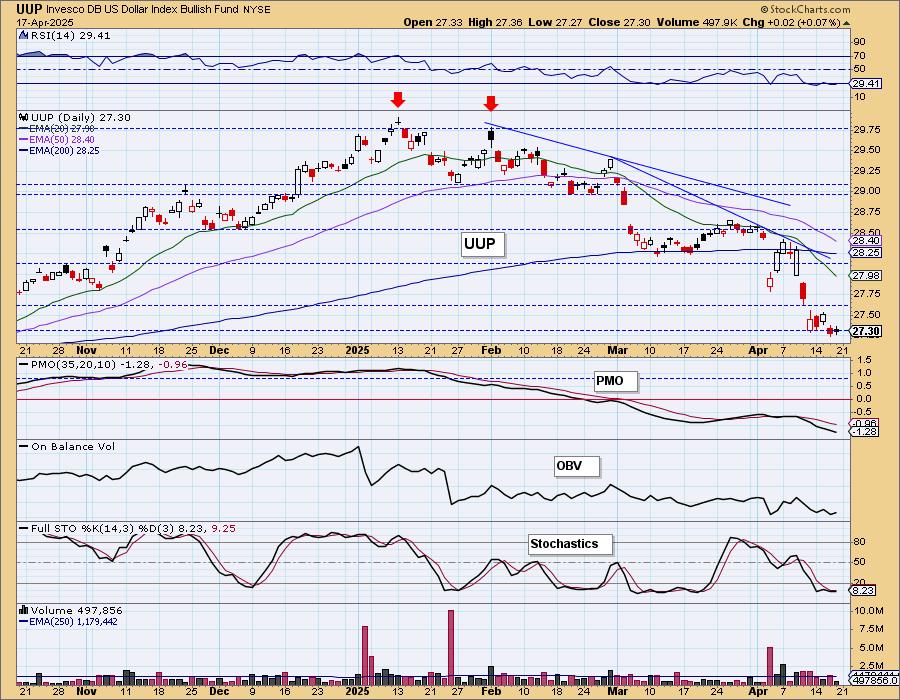
We will watch support at 26.75 closely. That looks like a good place to get an upside reversal.
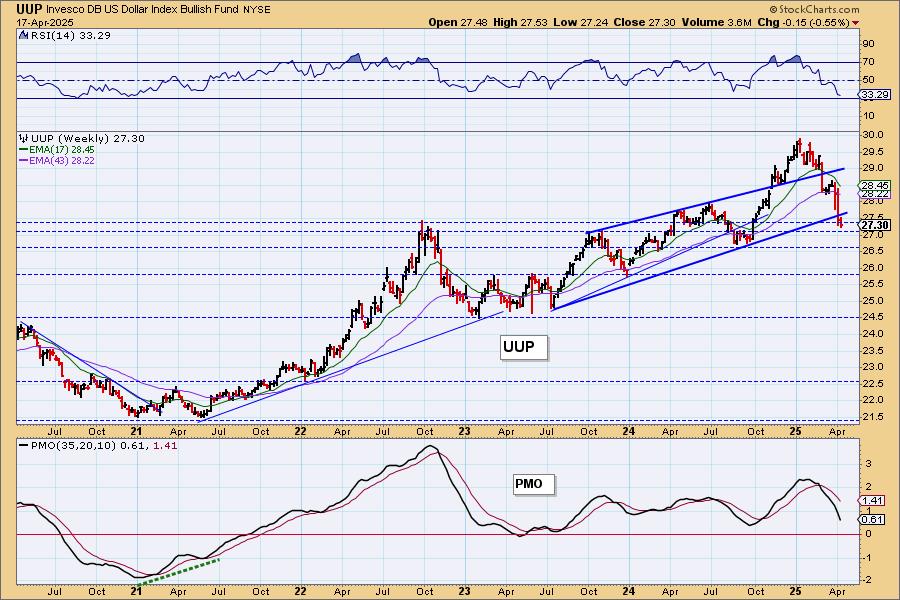
UUP Weekly Chart: The weekly chart definitely implies more weakness ahead given the breakdown from the rising trend. The weekly PMO is falling vertically. On the weekly chart, support looks strongest at 26.50.
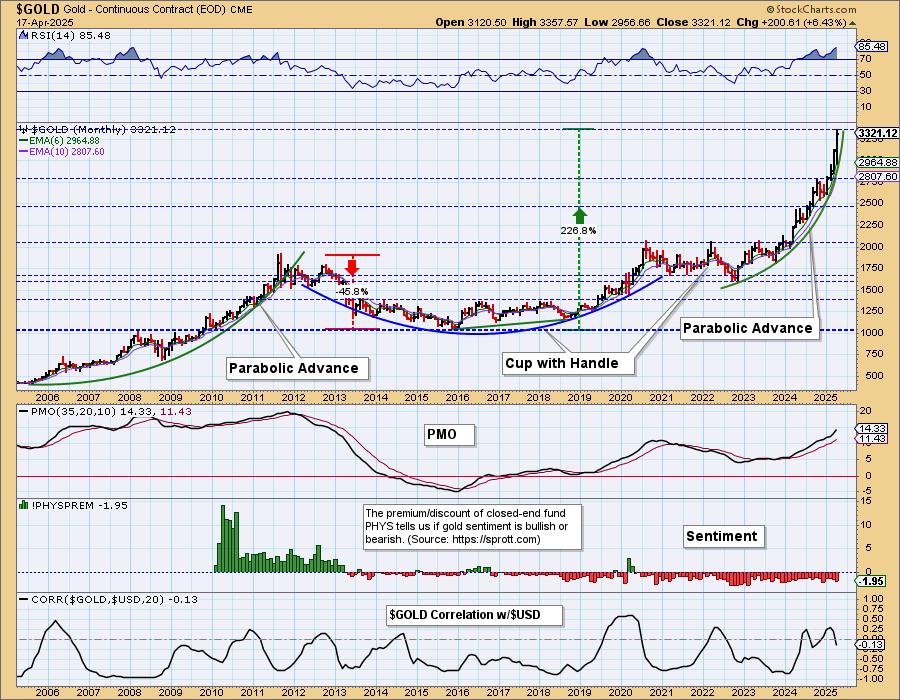
GOLD
IT Trend Model: NEUTRAL as of 12/23/2024
LT Trend Model: BUY as of 10/20/2023
GLD Daily Chart: Gold took a breather today. It remains overbought based on the RSI so more consolidation would be welcome to digest the recent rally. The PMO remains strong and Stochastics are holding above 80, both imply internal strength so any decline isn't likely to catch hold at this point. With market uncertainty, there is always certainty with Gold's store of value and that is getting investors interested.
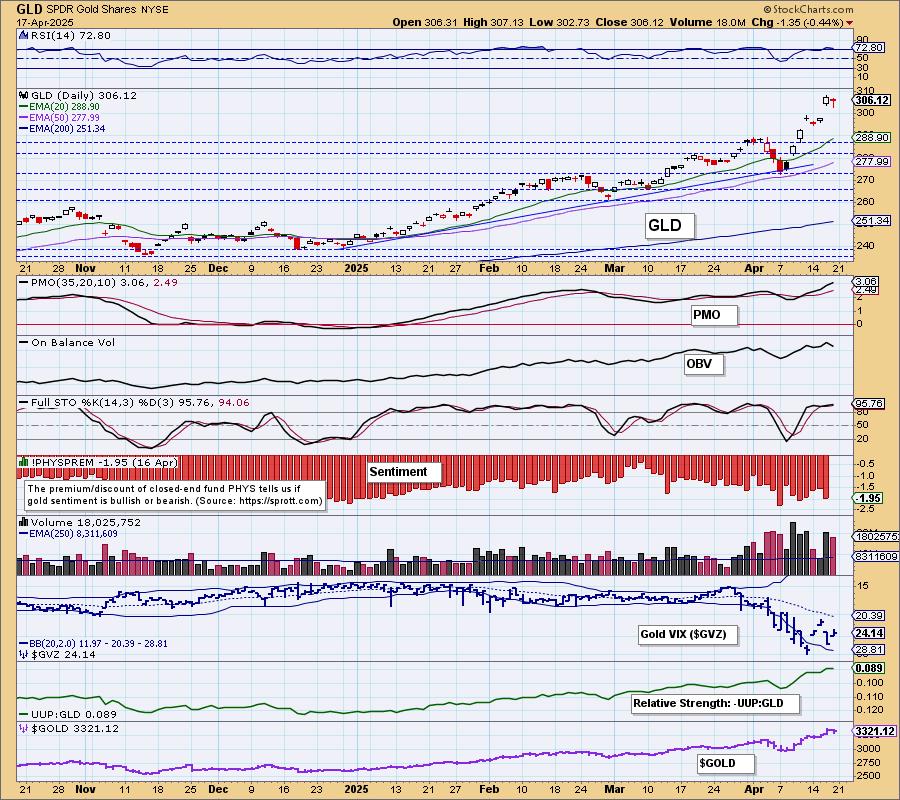
It doesn't really matter what the Dollar does right now as Gold is showing incredible relative strength. However, the inverse correlation is strong. This isn't bad for Gold given how weak the Dollar looks.

GLD Weekly Chart: We do have a parabolic advance on the weekly chart. The last time we saw this Gold did pull back and consolidate. If the advance is broken, we expect it to result in high level consolidation given the strength of the weekly PMO. Interestingly, sentiment is bearish as discounts are high. That usually works in Gold's favor.
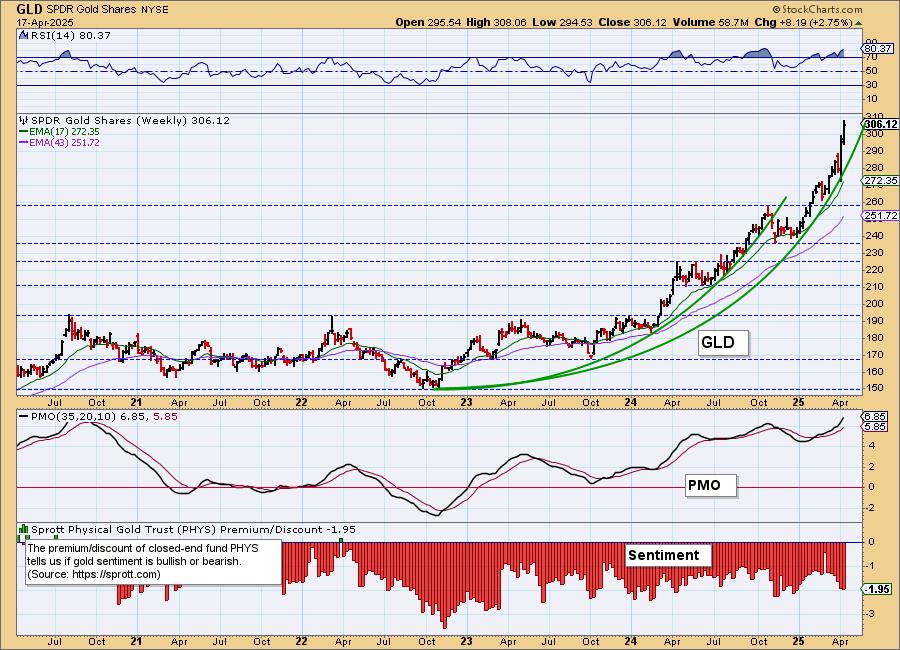
GLD Monthly Chart: The parabolic advance looks far more dangerous on the monthly chart. However, we just don't see much downside ahead for Gold giving market uncertainty. The monthly PMO looks very bullish so we aren't looking for a parabolic breakdown yet.
GOLD MINERS Daily Chart: Gold Miners pulled back with Gold today. We'd like to see more decline to offer another opportunity to enter. The long-term picture for Gold is excellent and that will translate to much higher prices on GDX. They are close to overbought even with today's decline so we would look for a bit more retracement. Participation slumped a little bit, but remains incredibly strong. Overall we like GDX, it just may be time for a little more decline.
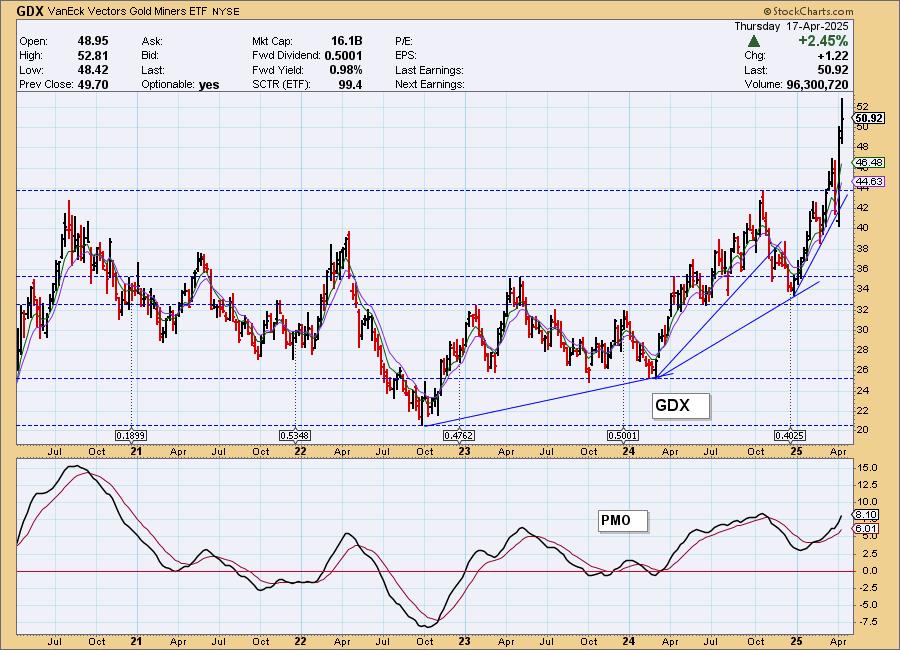
GDX Weekly Chart: We definitely have a parabolic advance on GDX and those tend to end badly. It has the backdrop of Gold though and Gold looks very strong. Both are in parabolic advances but we think we'll see consolidation rather than a major breakdown here.
CRUDE OIL (USO)
IT Trend Model: NEUTRAL as of 2/27/2025
LT Trend Model: BUY as of 3/31/2025
USO Daily Chart: Crude Oil has begun to rally again but it is already up against overhead resistance. The PMO is scooping upward, but remains very negative so we aren't ready to call it new strength. Stochastics are gently rising. We don't think this rally will last much longer with resistance so close, but it is coming off strong support.
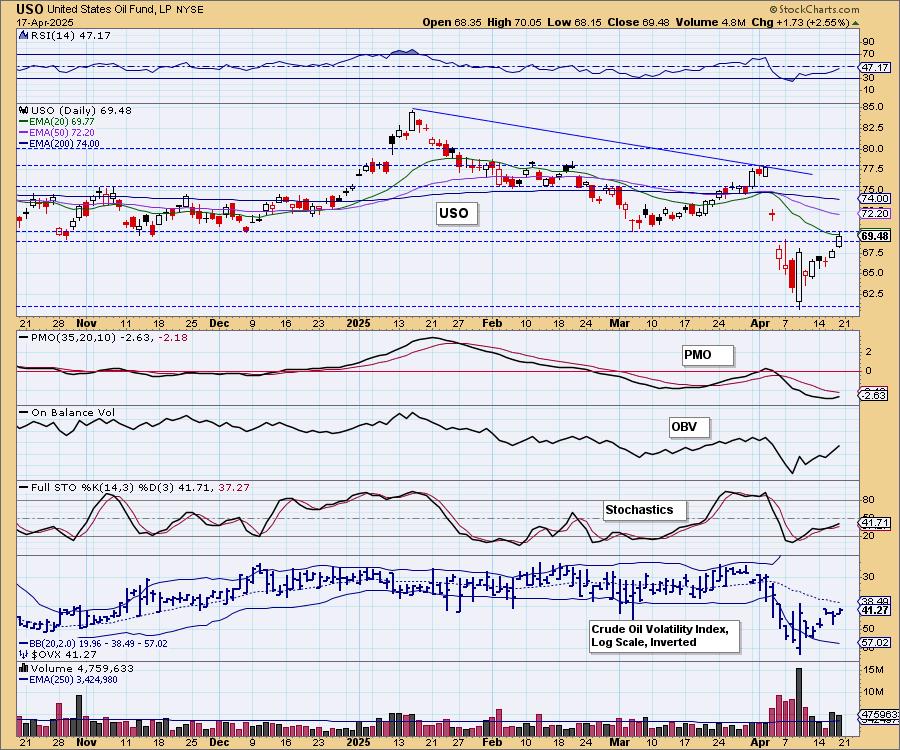
You have to go to the weekly chart to see actual support lines.
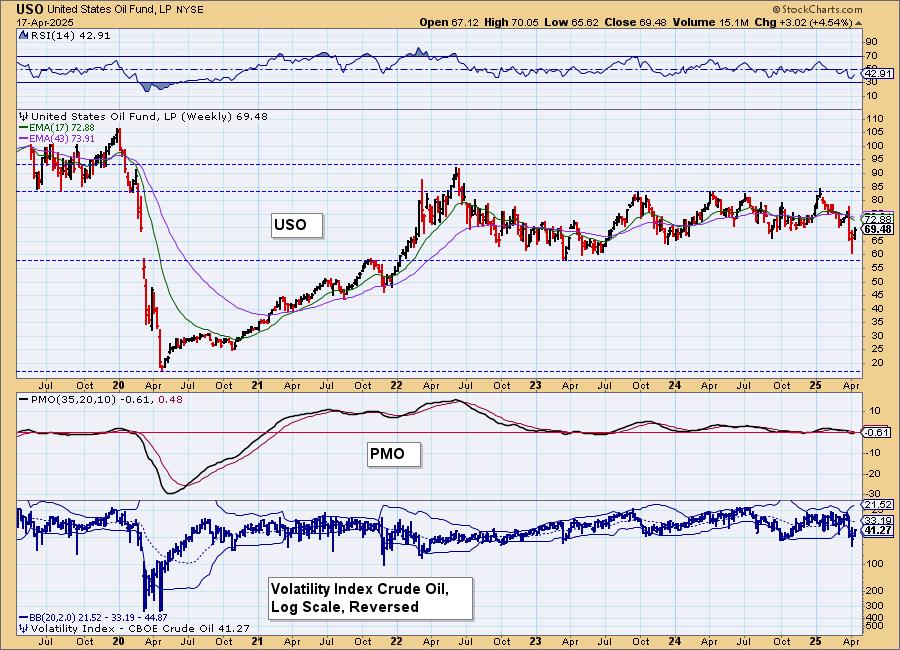
USO Weekly Chart: As you can see, this is a good place to see a Crude rally as it is coming off lows of its long-term trading range. The administration will be working hard to keep energy prices down which is why we are skeptical as to how much further it will advance, but technically when you see a rally off support like this, you get a move back up to the top of the range. We'll look for prices to rise a bit further from here.
Good Luck & Good Trading!
Erin Swenlin and Carl Swenlin
Technical Analysis is a windsock, not a crystal ball. --Carl Swenlin
(c) Copyright 2025 DecisionPoint.com
Disclaimer: This blog is for educational purposes only and should not be construed as financial advice. The ideas and strategies should never be used without first assessing your own personal and financial situation, or without consulting a financial professional. Any opinions expressed herein are solely those of the author, and do not in any way represent the views or opinions of any other person or entity.
DecisionPoint is not a registered investment advisor. Investment and trading decisions are solely your responsibility. DecisionPoint newsletters, blogs or website materials should NOT be interpreted as a recommendation or solicitation to buy or sell any security or to take any specific action.
NOTE: The signal status reported herein is based upon mechanical trading model signals, specifically, the DecisionPoint Trend Model. They define the implied bias of the price index based upon moving average relationships, but they do not necessarily call for a specific action. They are information flags that should prompt chart review. Further, they do not call for continuous buying or selling during the life of the signal. For example, a BUY signal will probably (but not necessarily) return the best results if action is taken soon after the signal is generated. Additional opportunities for buying may be found as price zigzags higher, but the trader must look for optimum entry points. Conversely, exit points to preserve gains (or minimize losses) may be evident before the model mechanically closes the signal.
Helpful DecisionPoint Links:
DecisionPoint Alert Chart List
DecisionPoint Golden Cross/Silver Cross Index Chart List
DecisionPoint Sector Chart List
Price Momentum Oscillator (PMO)