
Today the Nasdaq Composite Index ETF (ONEQ) 50-day EMA crossed up through the 200-day EMA (Golden Cross), generating an LT Trend Model BUY Signal. Price looks like it wants to turn over right now, but it is technically holding above support for now. The PMO has decelerated and the Silver Cross Index is about to top. Participation is above our bullish 50% threshold for %Stocks > 20/50EMAs, but just barely. Stochastics have topped. It appears we will see more decline in the short term.
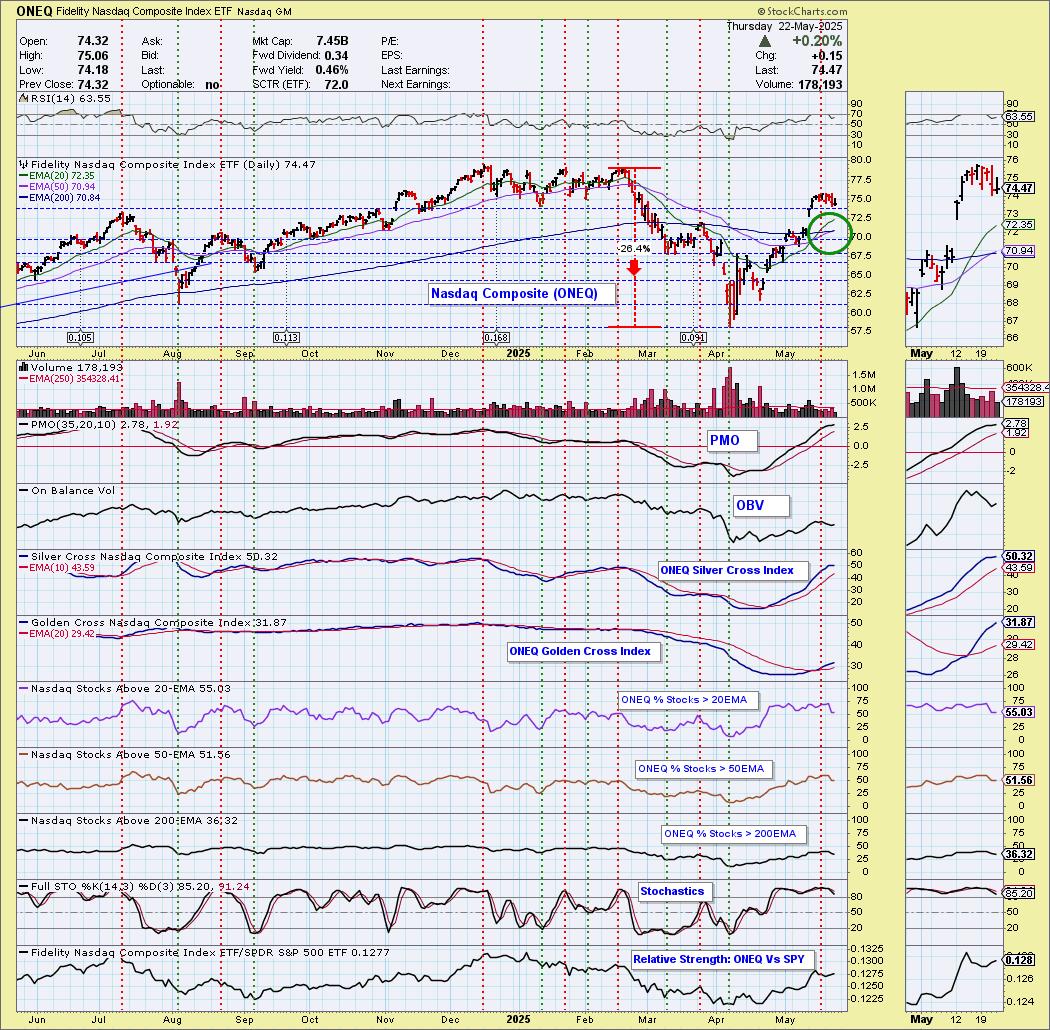
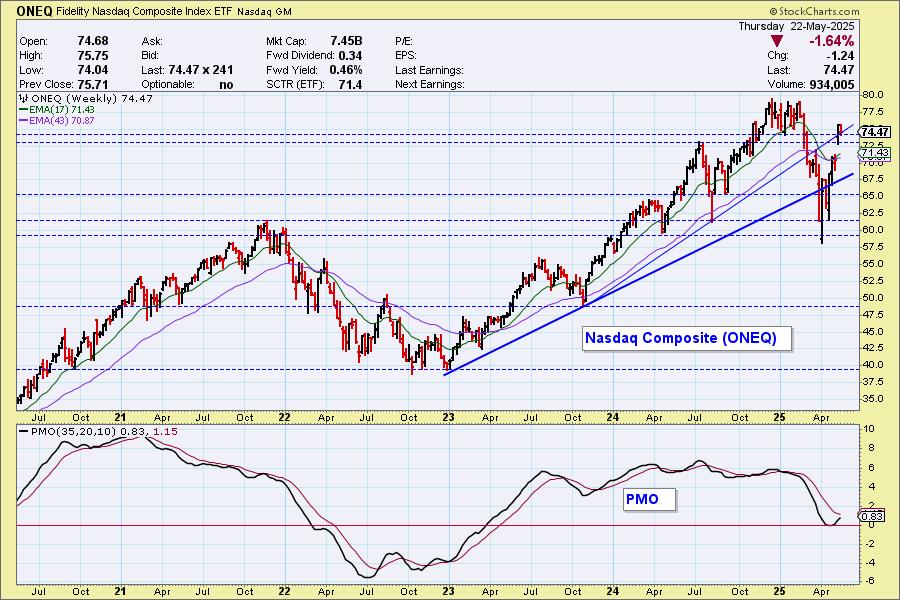
We do have a bullish "V" Bottom on price in the intermediate term and the weekly PMO is rising so it does suggest that any downturn will be absorbed mostly in the short term.
The DecisionPoint Alert Weekly Wrap presents an end-of-week assessment of the trend and condition of the Stock Market, the U.S. Dollar, Gold, Crude Oil, and Bonds. The DecisionPoint Alert daily report (Monday through Thursday) is abbreviated and gives updates on the Weekly Wrap assessments.
MARKET/INDUSTRY GROUP/SECTOR INDEXES
CLICK HERE for Carl's annotated Market Index, Sector, and Industry Group charts.
THE MARKET (S&P 500)
IT Trend Model: NEUTRAL as of 3/4/2025
LT Trend Model: SELL as of 4/16/2025
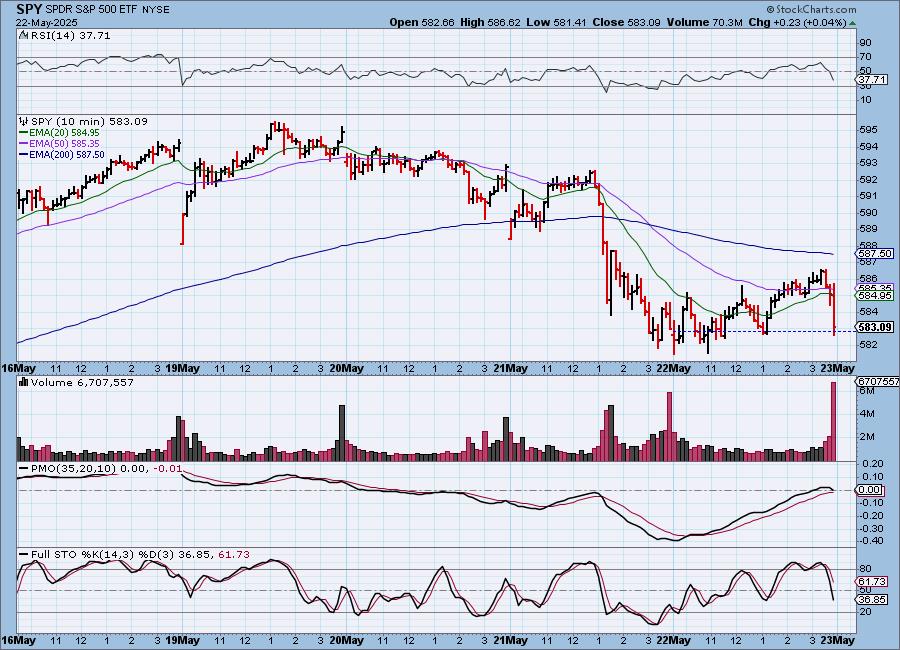
SPY 10-Minute Chart: Price was doing alright most of the day with a nice rising trend. However, the market dove lower in the last half hour of trading, taking out that rising trend. The 10-minute PMO has topped and Stochastics are diving lower suggesting we will see more downside tomorrow.
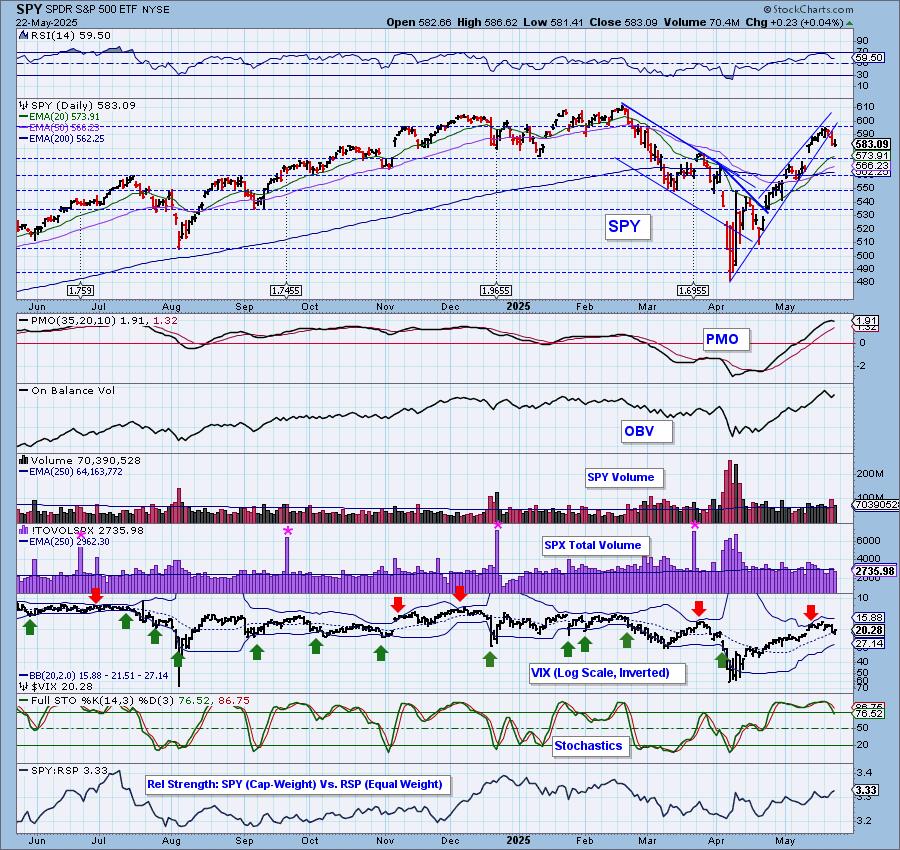
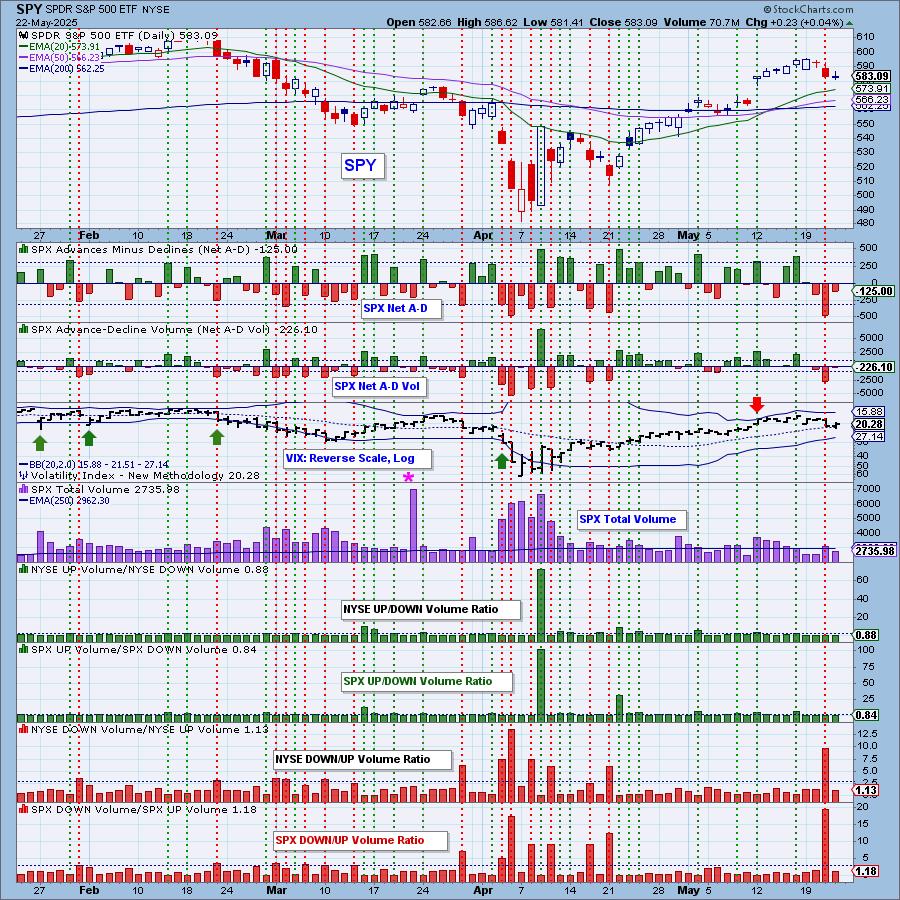
SPY Daily Chart: The market finished nearly unchanged on the day. It formed a doji candlestick which implies indecision. Bulls and bears are fighting it out right now. The PMO has now topped suggesting more downside ahead.
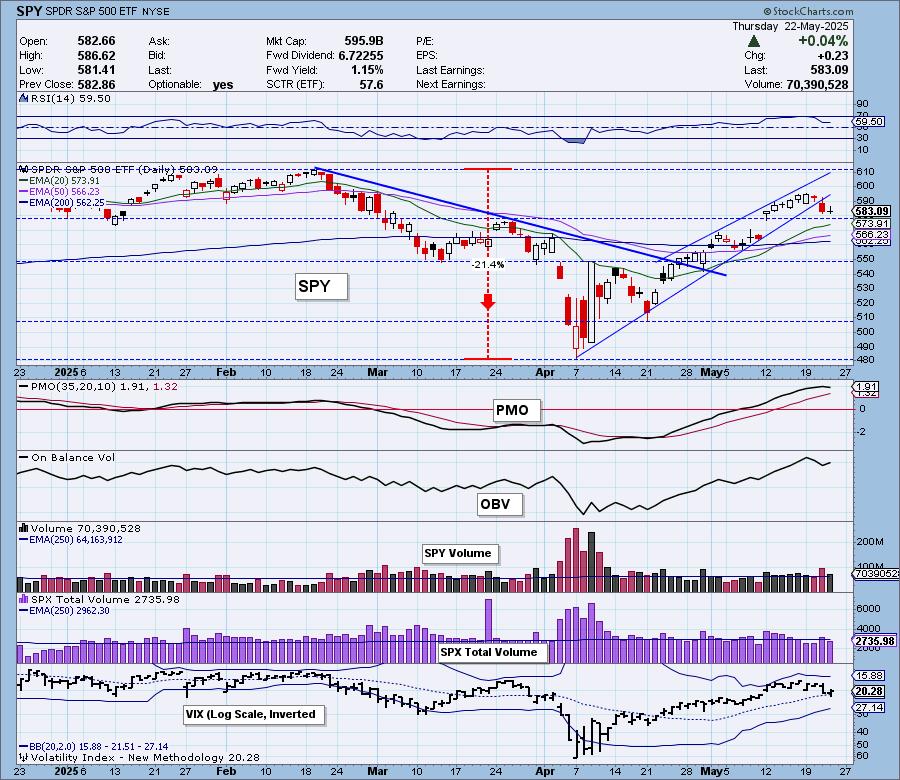
The VIX is sitting on its moving average on the inverted scale which also implies indecision. Stochastics dropped below 80 so we have internal weakness seeping in on the daily chart.
S&P 500 New 52-Week Highs/Lows: New Lows were more prevalent today with New Highs paring back considerably. This has caused the High-Low Differential to top.
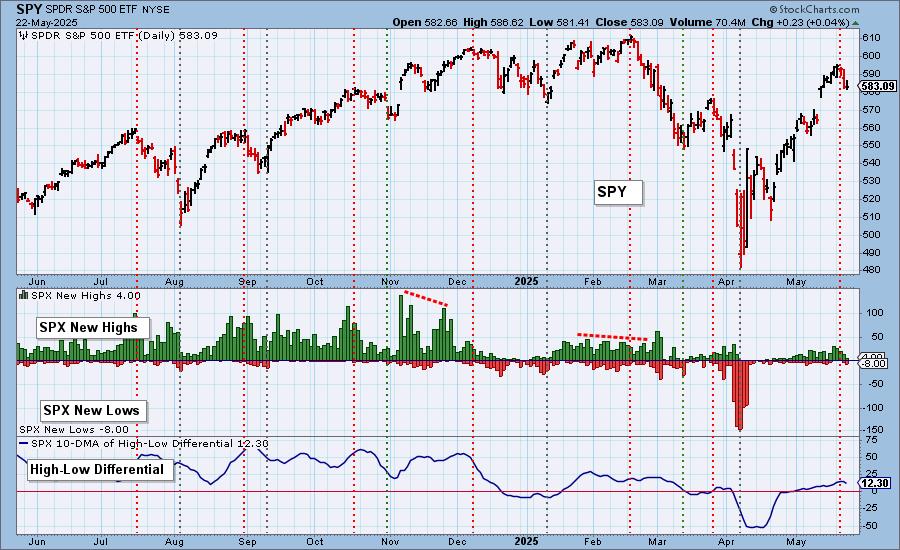
Climax* Analysis: There were no climax readings today. It appears investors are starting to sit on the sidelines as Total Volume has been below average most of this week.
*A climax is a one-day event when market action generates very high readings in, primarily, breadth and volume indicators. We also include the VIX, watching for it to penetrate outside the Bollinger Band envelope. The vertical dotted lines mark climax days -- red for downside climaxes, and green for upside. Climaxes are at their core exhaustion events; however, at price pivots they may be initiating a change of trend.
Short-Term Market Indicators: The short-term market trend is UP and the condition is NEUTRAL.
As noted yesterday, the negative divergences on the Swenlin Trading Oscillators (STOs) is playing out with new weakness in price. Both STOs hit negative territory today which also doesn't bode well. Participation has been slashed as %Stocks > 20EMA have moved almost to our bullish 50% threshold. Less than one-third of the index have rising momentum. That will make it hard to get more rally.
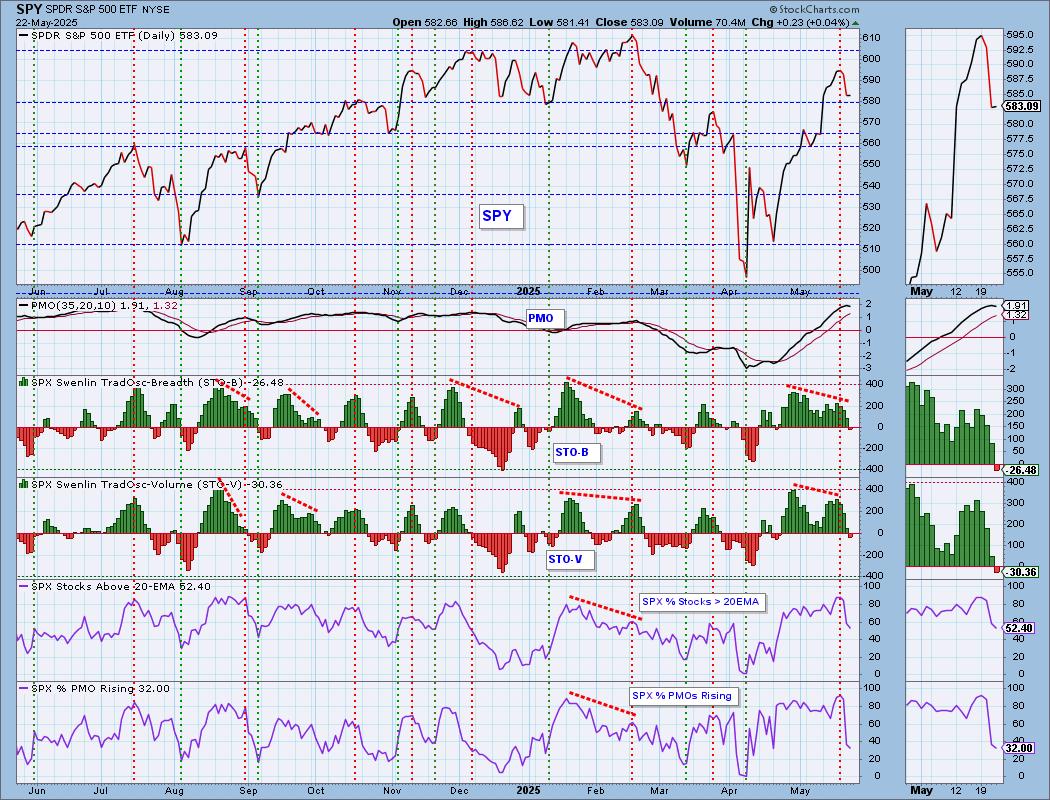
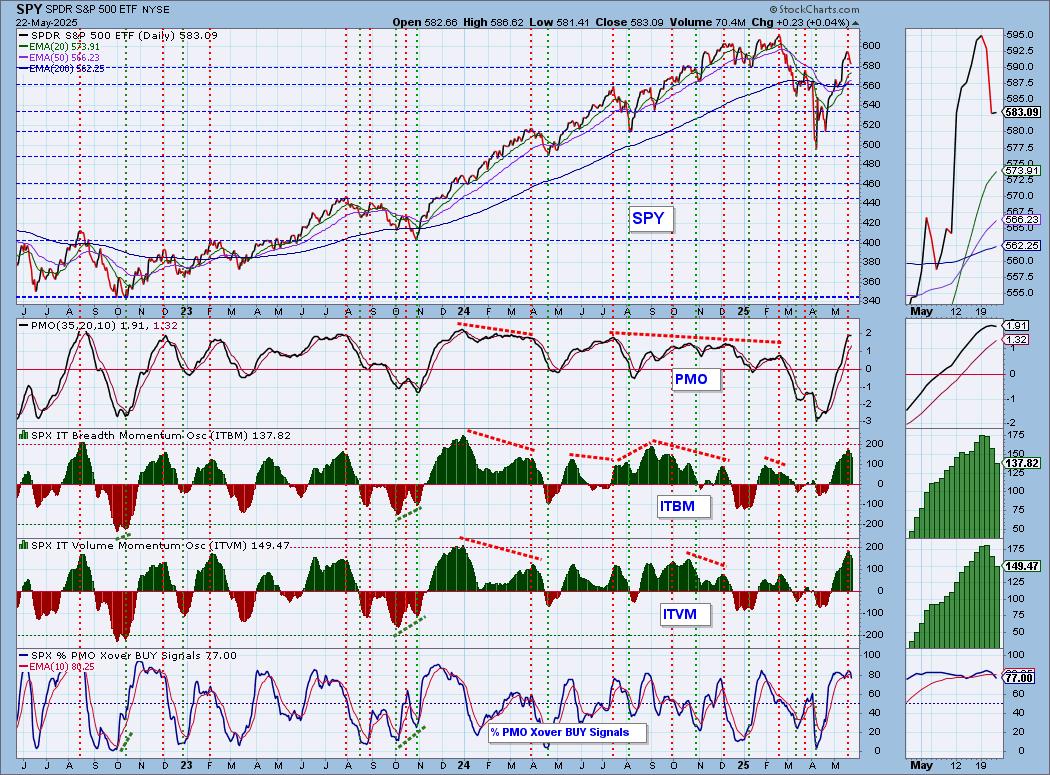
Intermediate-Term Market Indicators: The intermediate-term market trend is UP and the condition is OVERBOUGHT.
The ITBM and ITVM continued lower today out of very overbought conditions. This also suggests we have more downside to absorb. %PMO Xover BUY Signals dropped below the signal line.
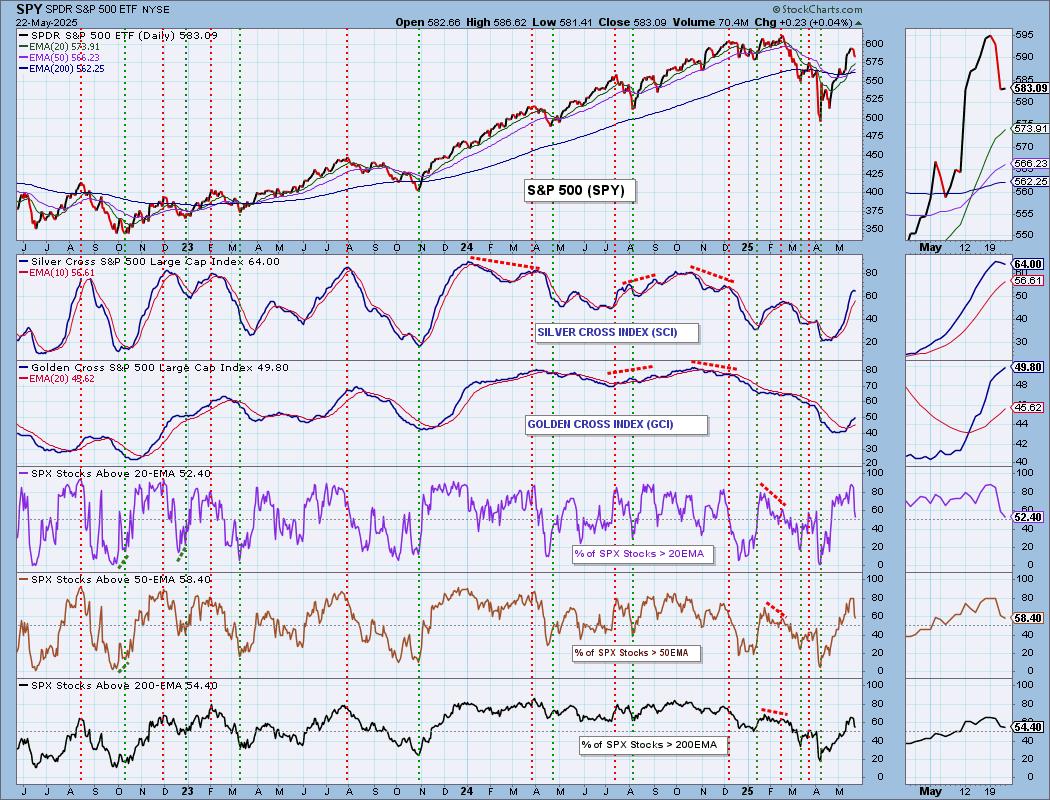
PARTICIPATION CHART (S&P 500): The following chart objectively shows the depth and trend of participation for the SPX in two time frames.
- Intermediate-Term - the Silver Cross Index (SCI) shows the percentage of SPX stocks on IT Trend Model BUY signals (20-EMA > 50-EMA). The opposite of the Silver Cross is a "Dark Cross" -- those stocks are, at the very least, in a correction.
- Long-Term - the Golden Cross Index (GCI) shows the percentage of SPX stocks on LT Trend Model BUY signals (50-EMA > 200-EMA). The opposite of a Golden Cross is the "Death Cross" -- those stocks are in a bear market.
The market bias is BULLISH in the intermediate and long terms.
Participation continues to drop out of the market. It is still holding above our bullish 50% threshold, but that isn't likely to continue if this decline gets going. The big news is that the Silver Cross Index has topped. It is still above its signal line so the IT Bias still reads BULLISH, but this downturn is a big problem. The Golden Cross Index continues to move higher and it could continue to, but not for much longer if participation doesn't improve. It is holding above its signal line so the LT Bias is BULLISH.
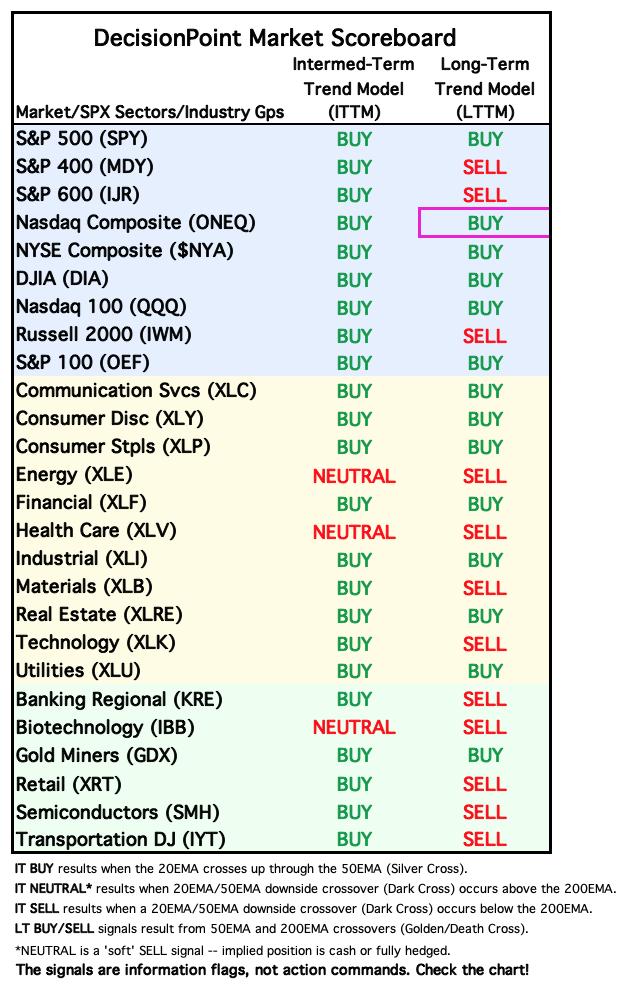
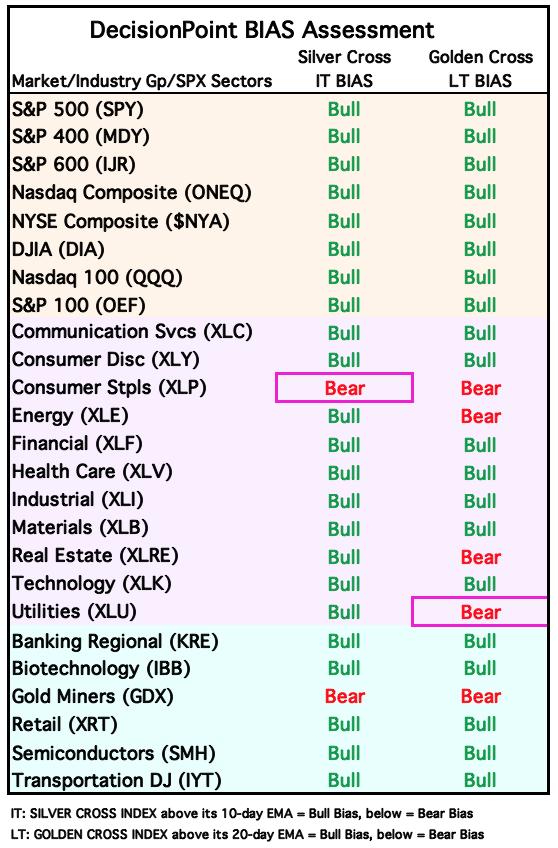
BIAS Assessment: The following table expresses the current BIAS of various price indexes based upon the relationship of the Silver Cross Index to its 10-day EMA (intermediate-term), and of the Golden Cross Index to its 20-day EMA (long-term). When the Index is above the EMA it is bullish, and it is bearish when the Index is below the EMA. The BIAS does not imply that any particular action should be taken. It is information to be used in the decision process.
The items with highlighted borders indicate that the BIAS changed today.
*****************************************************************************************************
CONCLUSION: It appeared that yesterday's downside initiation climax would not materialize with lower prices. The market did finish positive, but it could easily have slid into negative territory with today's late day decline. Indicators have really switched gears from bullish to bearish. The PMO topped, participation is losing ground and the STOs/ITBM/ITVM are all falling. There are other issues as well, like negative divergences and very little rising momentum left in the market. Did we mention the Silver Cross Index has topped? It's time for the market to roll over. If participation doesn't improve, the decline could get problematic.
Erin is 70% long, 0% short. (This is intended as information, not a recommendation.)
*****************************************************************************************************
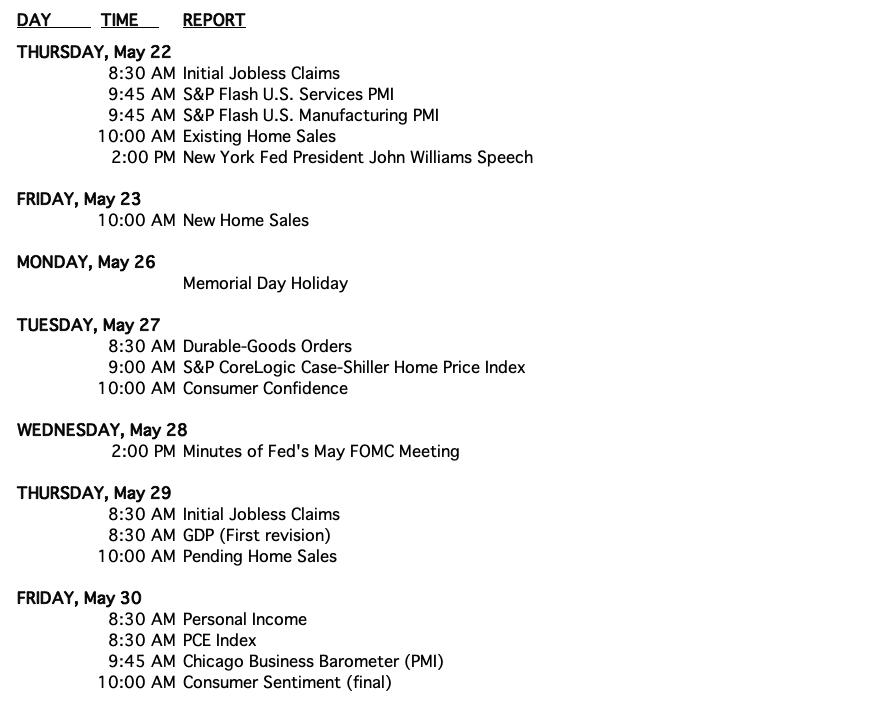
CALENDAR
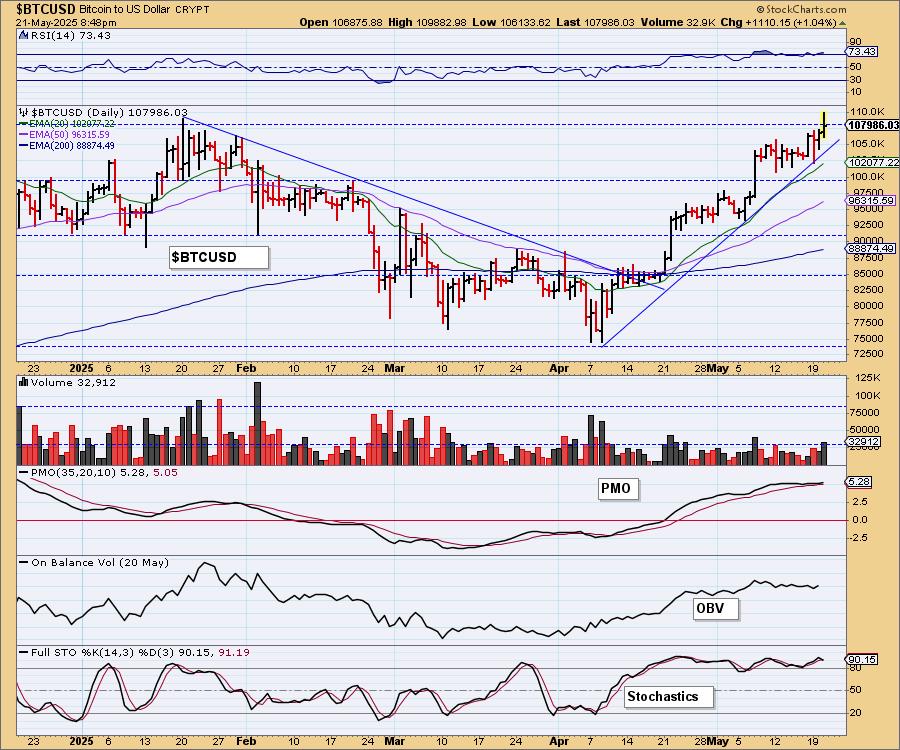
BITCOIN
Bitcoin hit new all-time highs again today and it is likely off to the races again. This rising trend is solid and not parabolic. The PMO is bottoming above the signal line. Stochastics are holding above 80. The one issue could be the overbought RSI, but Bitcoin doesn't really get bothered by overbought conditions, particularly when it is in a bullish configuration like we have now.
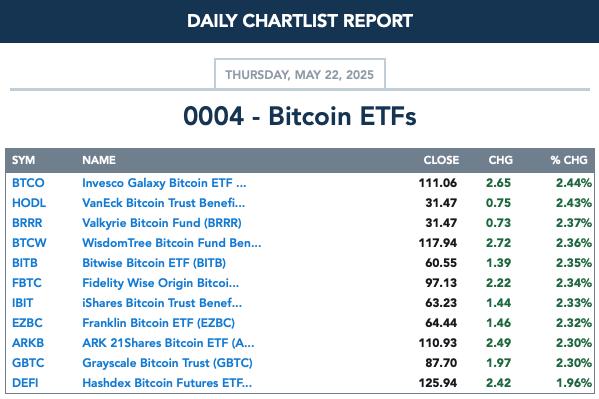
BITCOIN ETFs
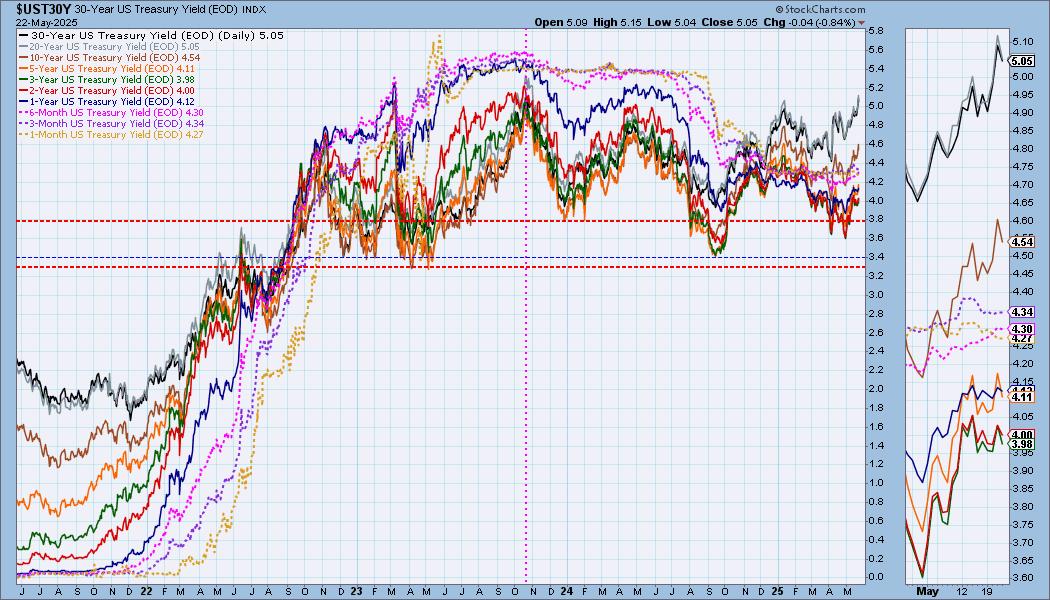
INTEREST RATES
Yields dropped today, but we sense there are still problems with the bond market in general so we would look for rising trends to continue along further. 2025 highs are beginning to be challenged by the 20/30-yr yields.
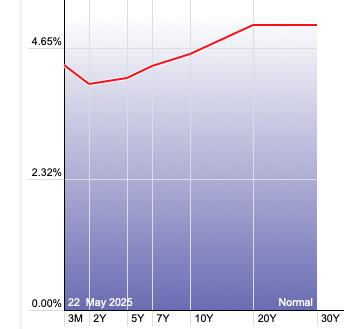
The Yield Curve Chart from StockCharts.com shows us the inversions taking place. The red line should move higher from left to right. Inversions are occurring where it moves downward.
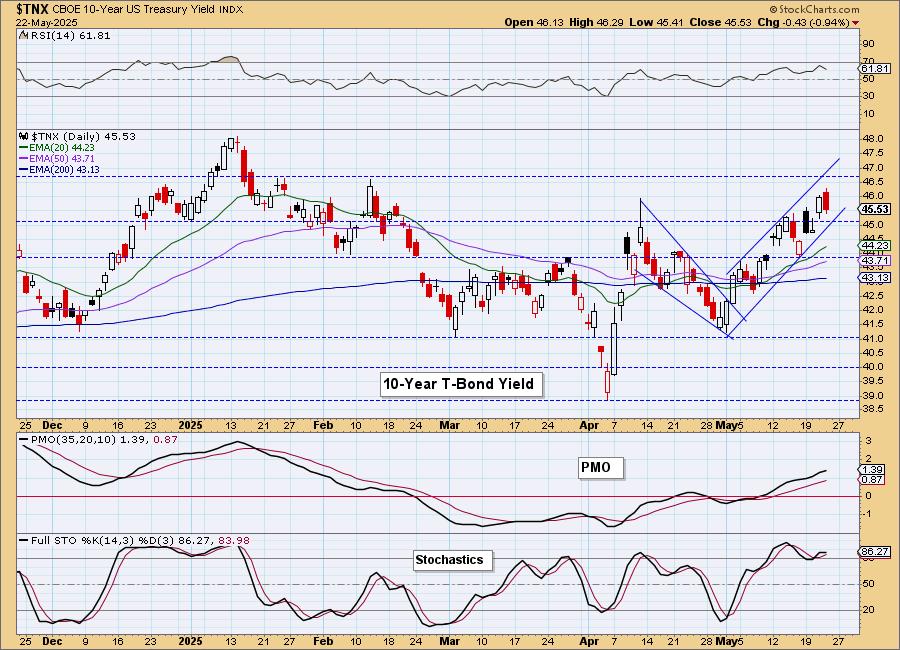
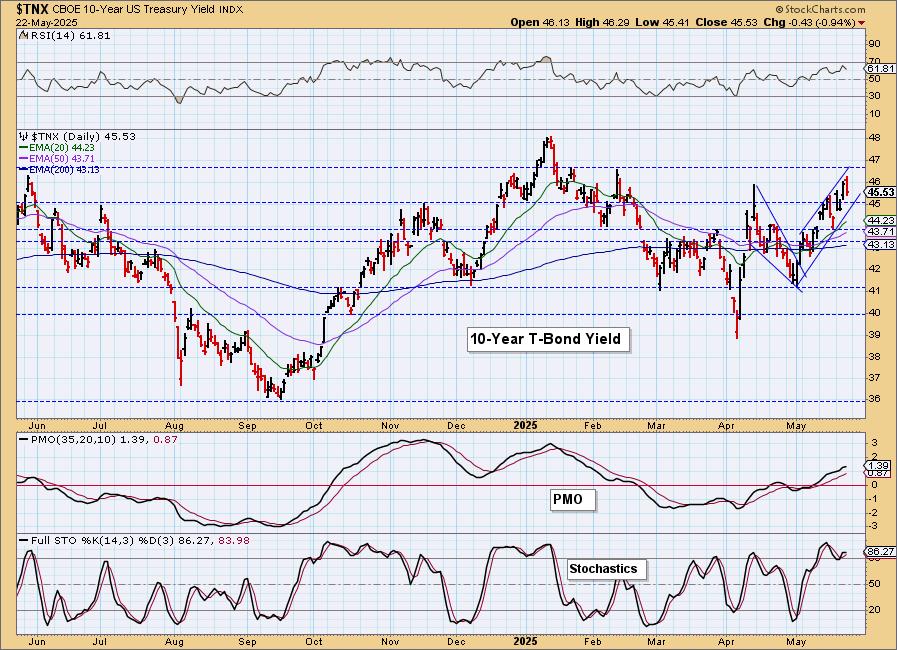
10-YEAR T-BOND YIELD
We see this as a rising trend channel and $TNX is likely to stay in it right up to the 2025 high. At that point, we think they will begin dropping again, but for now look for that top to be challenged. The PMO is rising and the RSI is not overbought. Stochastics are also holding above 80.
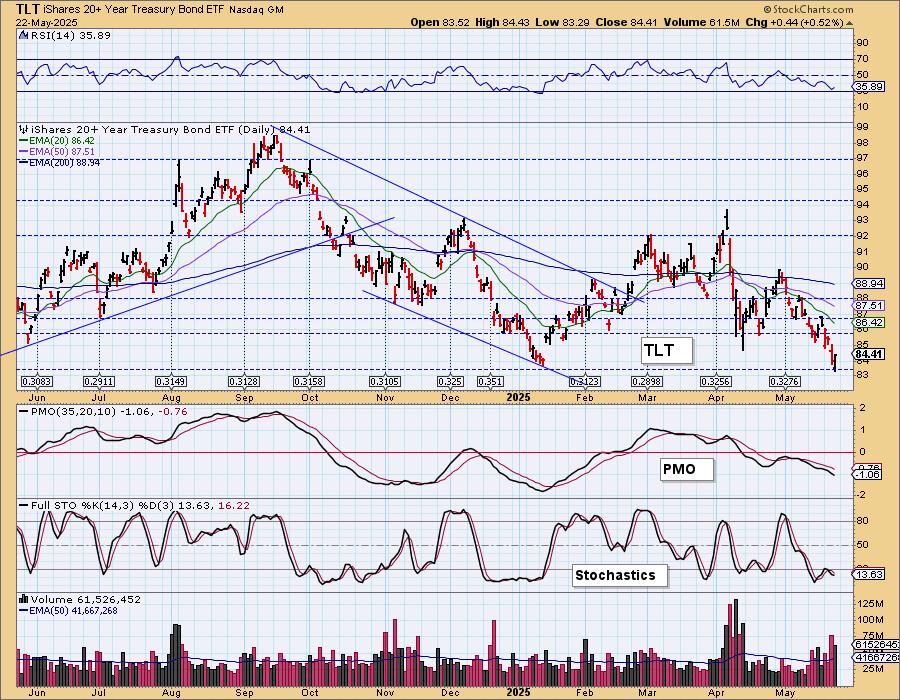
BONDS (TLT)
IT Trend Model: SELL as of 4/14/2025
LT Trend Model: SELL as of 12/13/2024
TLT Daily Chart: TLT was higher on the day, but formed a lower low and a lower high. It doesn't look that bullish to us particularly given the weak indicators. We are looking for a breakdown given the PMO is still in decline.
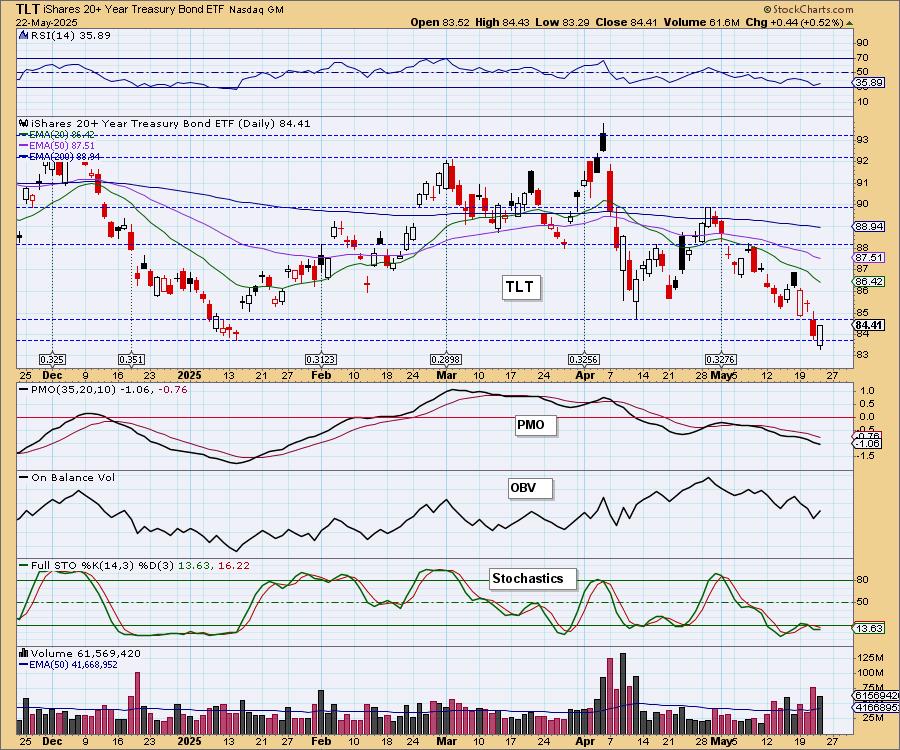
Support is definitely vulnerable at 83.
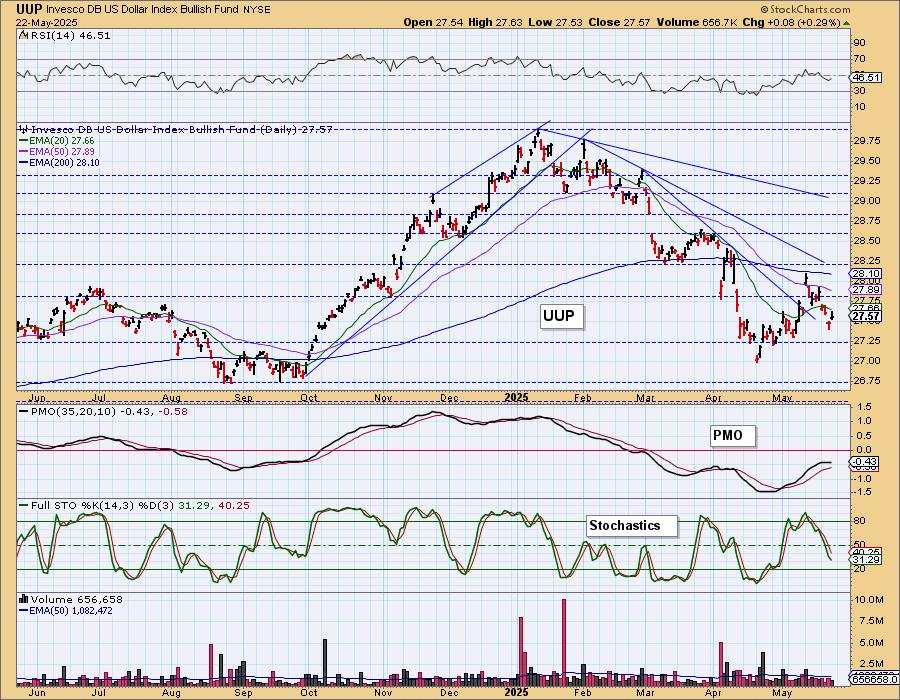
DOLLAR (UUP)
IT Trend Model: NEUTRAL as of 3/5/2025
LT Trend Model: SELL as of 4/25/2025
UUP Daily Chart: The Dollar managed a small rally today, but the declining trend out of the May top continues. Note that it was unable to test the declining tops trendline out of the February high. That is generally a bearish setup. The PMO has topped below the zero line and Stochastics are dropping in negative territory. We expect lower prices.
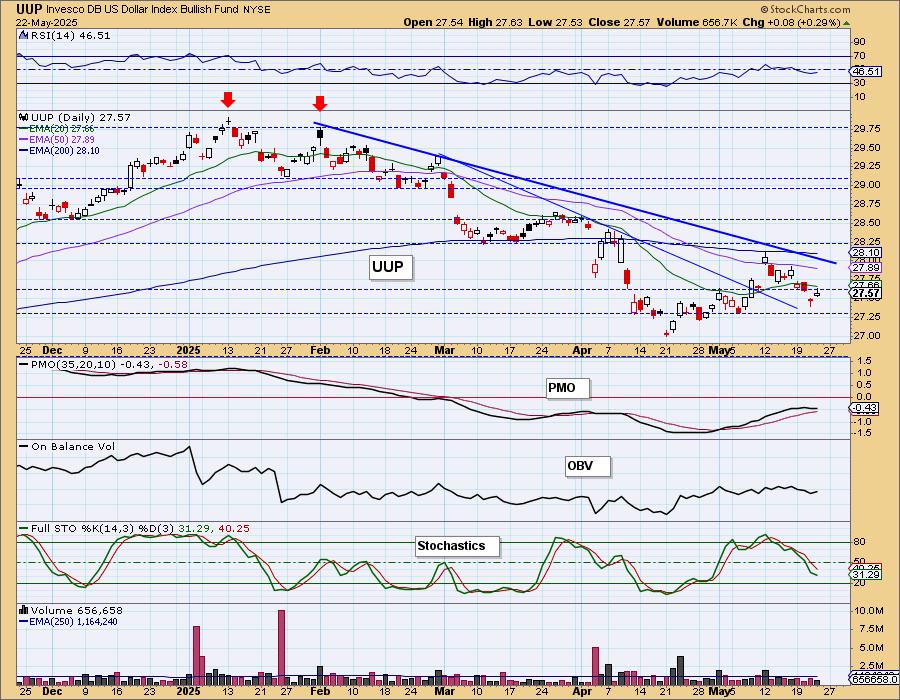
Price failed at the 200-day EMA and retreated. We would look past support for a drop to test the April low.
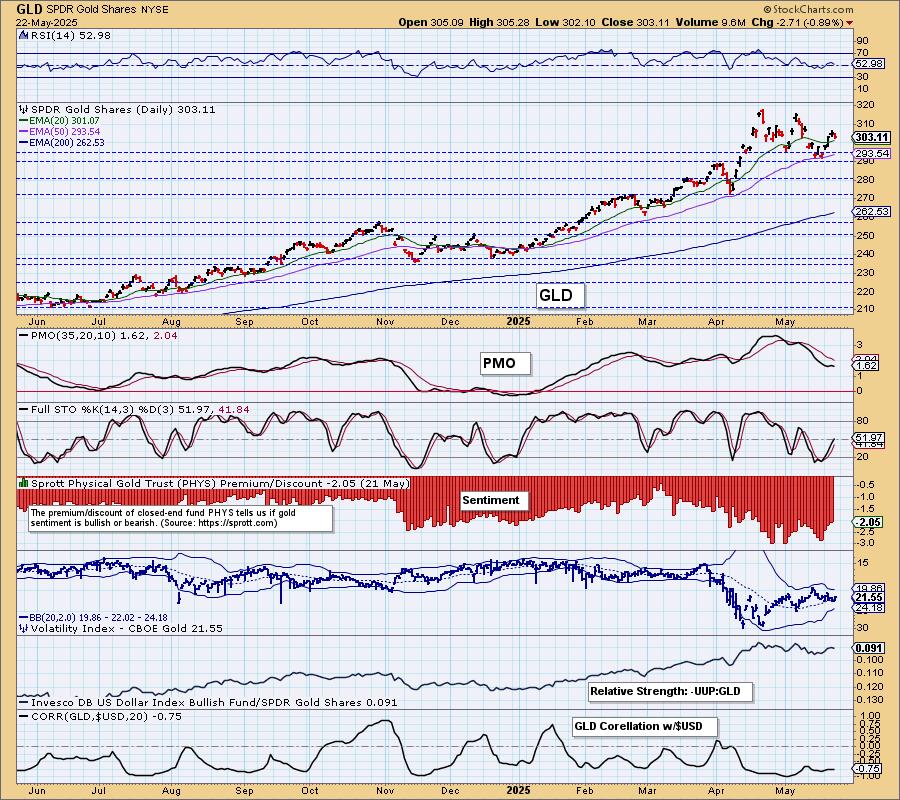
GOLD
IT Trend Model: BUY as of 1/10/2025
LT Trend Model: BUY as of 10/20/2023
GLD Daily Chart: Gold fell back today on a rising Dollar, but it was down further than the inverse correlation called for telling us we had quite a few sellers today. We do like Gold again mainly due to the weakening Dollar. Today's decline did do some damage. The PMO is topping beneath the signal line which is especially bearish. However, Stochastics are rising in positive territory. We would look for at least a test of the top of this declining trend channel.
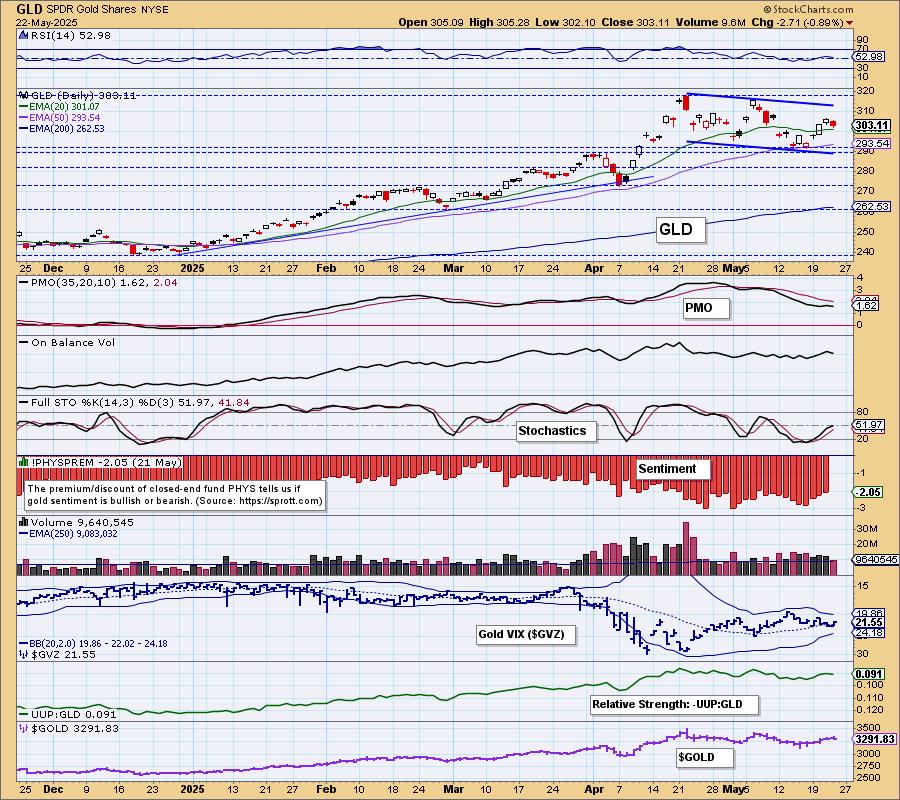
There is a good chance that this is a bull flag formation. You could extend the flagpole back to the December low if you wanted to, but we'll look at the last vertical rally as the flagpole for now. The minimum upside target of that pattern would be about 365.00. That isn't out of the question. Bearish sentiment is dropping with discounts. We don't have a breakout from this flag, but it looks possible.
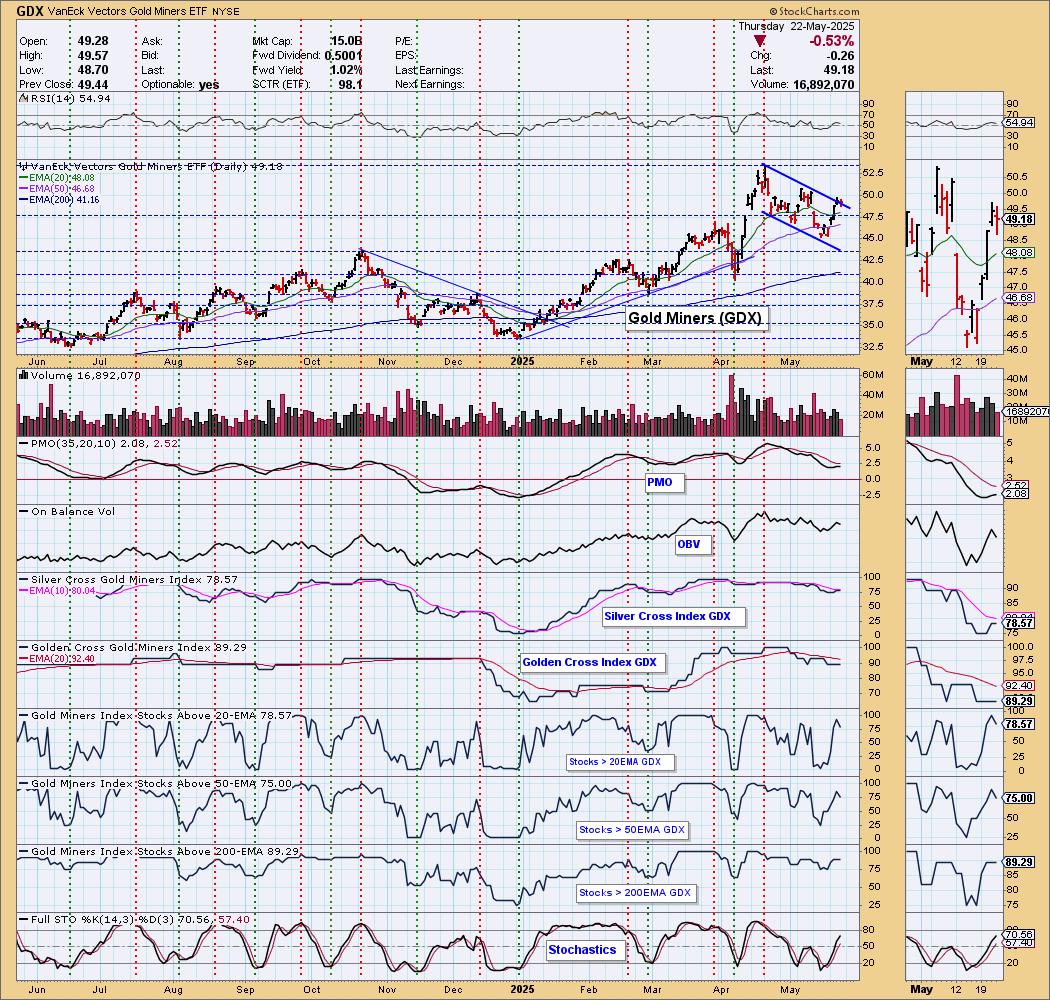
GOLD MINERS (GDX) Daily Chart: GDX dropped in sympathy with Gold. We do see a bull flag formation here. We don't quite have a breakout, but it is close. Participation is strong right now and could lift prices higher from here. We do need to count on the Dollar to stay weak as any decline in Gold will be felt among the Gold Miners.
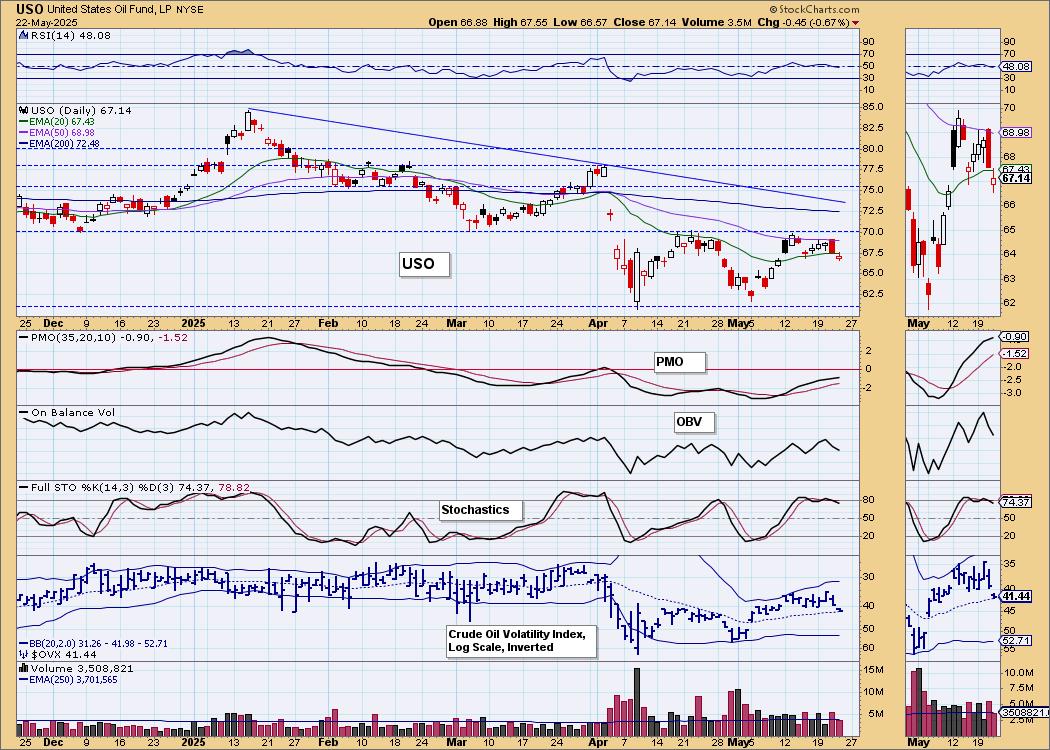
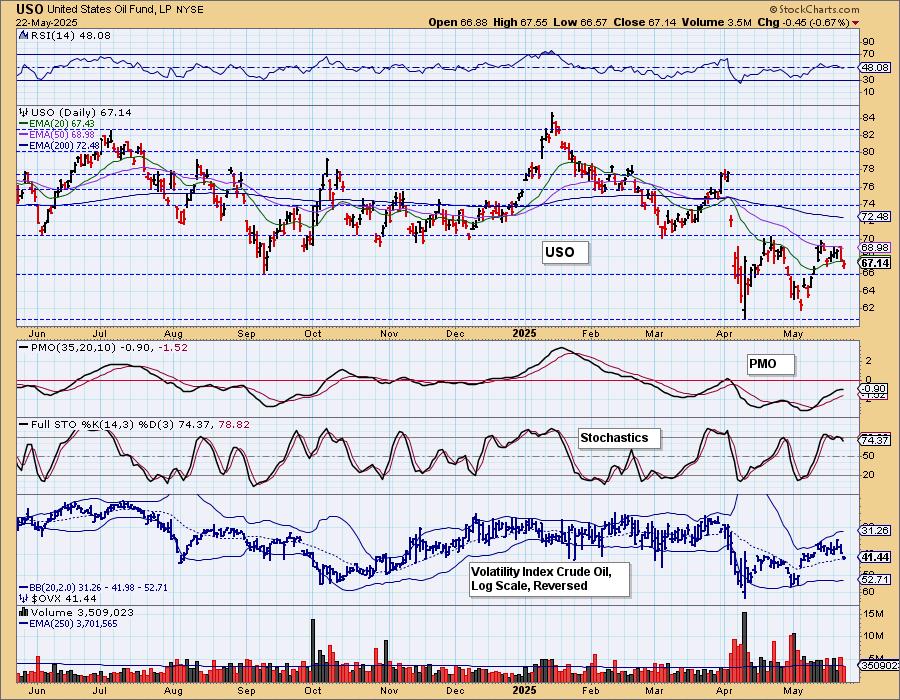
CRUDE OIL (USO)
IT Trend Model: NEUTRAL as of 2/27/2025
LT Trend Model: SELL as of 3/18/2025
USO Daily Chart: Crude Oil hit overhead resistance and was turned away. It appears ready to go back down to support. The PMO is still rising, but the damage to Stochastics and the negative RSI tell us to expect prices to fall further from here.
Good Luck & Good Trading!
Erin Swenlin and Carl Swenlin
Technical Analysis is a windsock, not a crystal ball. --Carl Swenlin
(c) Copyright 2025 DecisionPoint.com
Disclaimer: This blog is for educational purposes only and should not be construed as financial advice. The ideas and strategies should never be used without first assessing your own personal and financial situation, or without consulting a financial professional. Any opinions expressed herein are solely those of the author, and do not in any way represent the views or opinions of any other person or entity.
DecisionPoint is not a registered investment advisor. Investment and trading decisions are solely your responsibility. DecisionPoint newsletters, blogs or website materials should NOT be interpreted as a recommendation or solicitation to buy or sell any security or to take any specific action.
NOTE: The signal status reported herein is based upon mechanical trading model signals, specifically, the DecisionPoint Trend Model. They define the implied bias of the price index based upon moving average relationships, but they do not necessarily call for a specific action. They are information flags that should prompt chart review. Further, they do not call for continuous buying or selling during the life of the signal. For example, a BUY signal will probably (but not necessarily) return the best results if action is taken soon after the signal is generated. Additional opportunities for buying may be found as price zigzags higher, but the trader must look for optimum entry points. Conversely, exit points to preserve gains (or minimize losses) may be evident before the model mechanically closes the signal.
Helpful DecisionPoint Links:
DecisionPoint Alert Chart List
DecisionPoint Golden Cross/Silver Cross Index Chart List
DecisionPoint Sector Chart List
Price Momentum Oscillator (PMO)