
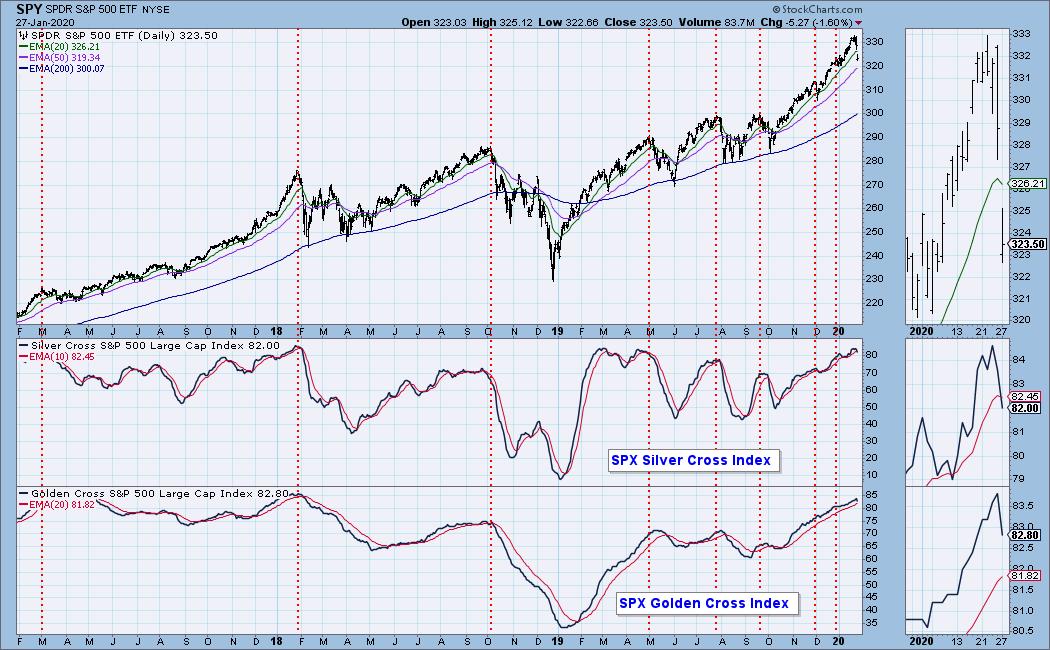
The market pulled back today, breaking a rising bottoms trendline. The Diamond Scan only produced 2 results today and the Diamond Dog scan had 24 results. Momentum shifted downward in spectacular fashion and that would be why we only saw 2 results on the Diamond Scan and so many results in the Diamond Dog Scan. I found one momentum sleeper for you and four others from my "Bullish EMA - Mid-Range SCTR" scan. That particular scan produced 68 results, so today's pullback did help with identifying strong performers in a weak market.
Welcome to DecisionPoint Daily Diamonds, wherein I highlight five "diamonds in the rough." These are selected from the results of my DecisionPoint scans, which search for stocks that could benefit from the trend and condition of the market. Remember, these are not recommendations to buy or sell, but are the most interesting of the stocks that surfaced in my scans. My objective is to save you the work of the initial, tedious culling process, but you need to apply your own analysis to see if these stocks pique your interest as well. There are no guaranteed winners here!
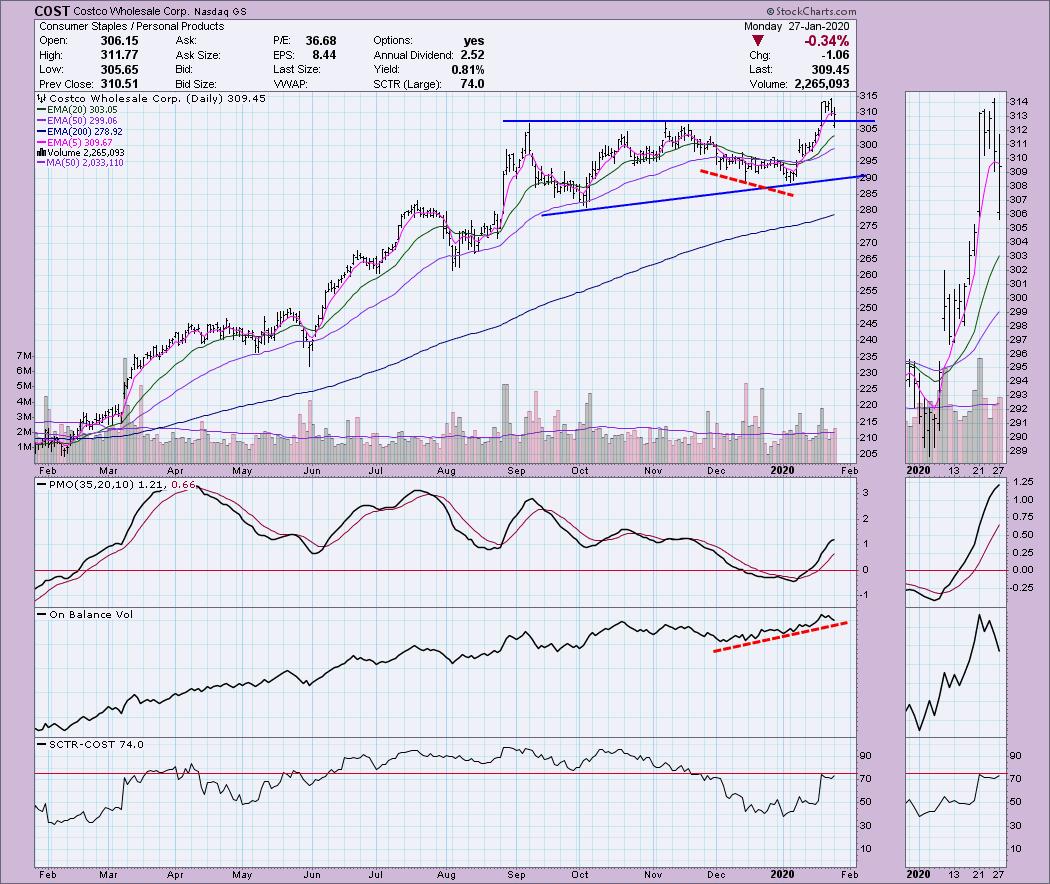
Costco Wholesale Corp (COST) - Earnings: 3/5/2020
Costco broke out from an ascending triangle and today pulled back. While intraday price did dip back into the chart pattern, it closed above that important support area formed by the top of the triangle. There was a beautiful positive divergence between the OBV and price lows back in December that was the harbinger of the rally that followed.
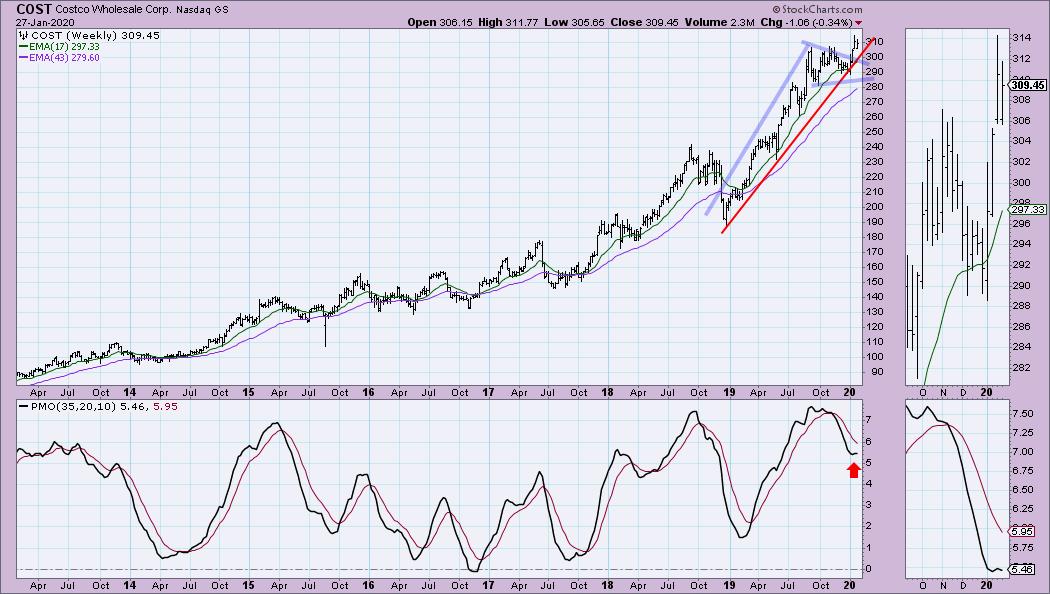
The weekly PMO is indecisive right now, but I spot a bull flag formation that has executed. The rising trend has been intact since the rally began in January 2019.
Don't forget, on Thursdays I look at reader-requested symbols, so shoot me an email at erin@decisionpoint.com. I read every email I receive and try to answer them all!
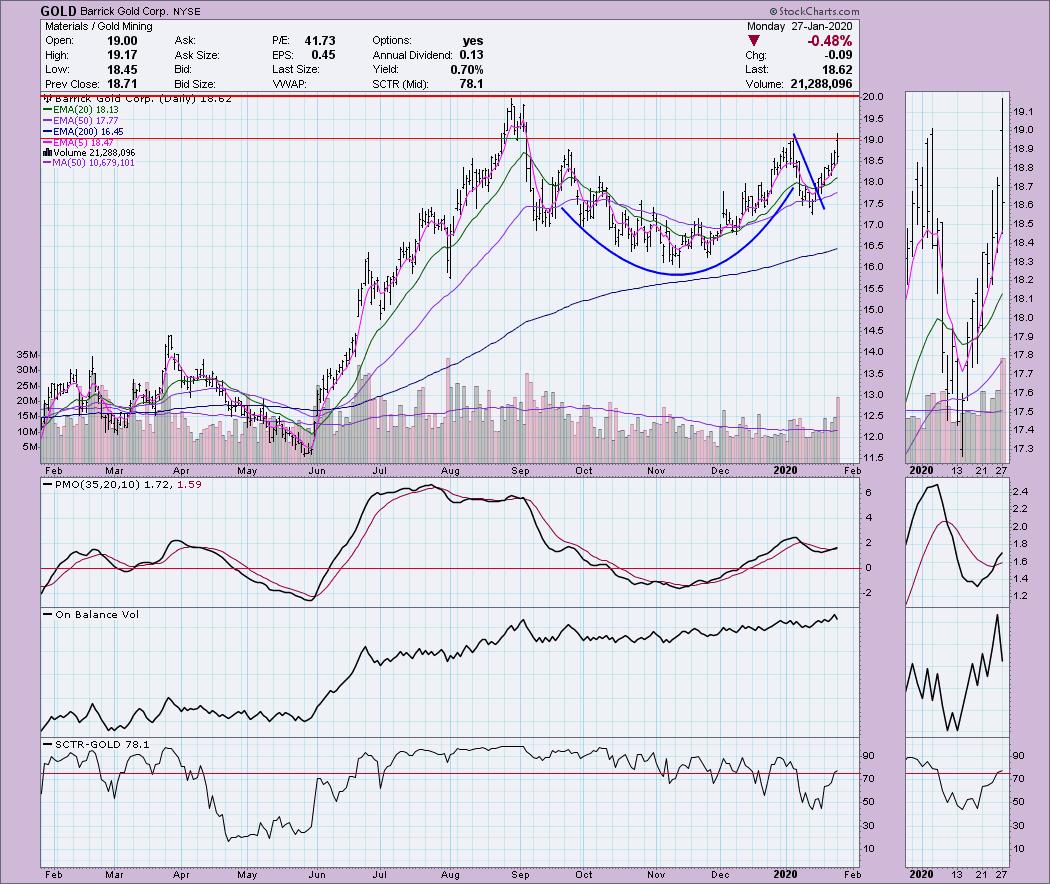
Barrick Gold Corp (GOLD) - Earnings: N/A
I wrote about Gold Miners in Saturday's ChartWatchers article for StockCharts.com. This gold miner came up in my scan today and I couldn't resist. There is a very bullish "cup and handle" formation. The only issue I have is that overhead resistance at the top of the handle hasn't been broken. Given the positive PMO I still expect this one to break out.
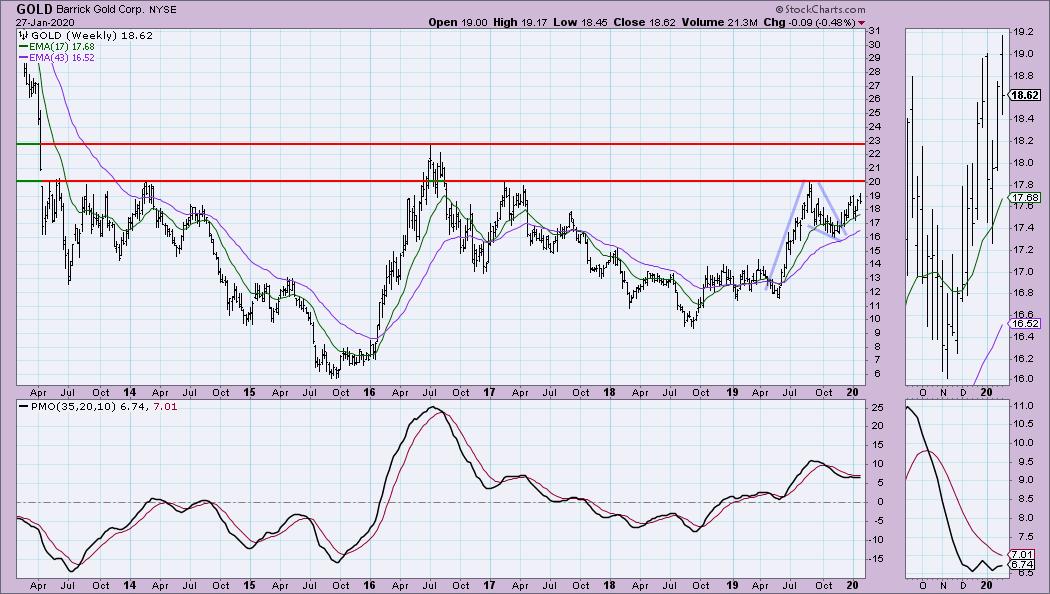
A flag has executed. The weekly PMO is turning around. The overhead resistance at the 2019 high looks like it could be tough for a breakout, but I expect to see it challenge the 2016 top.
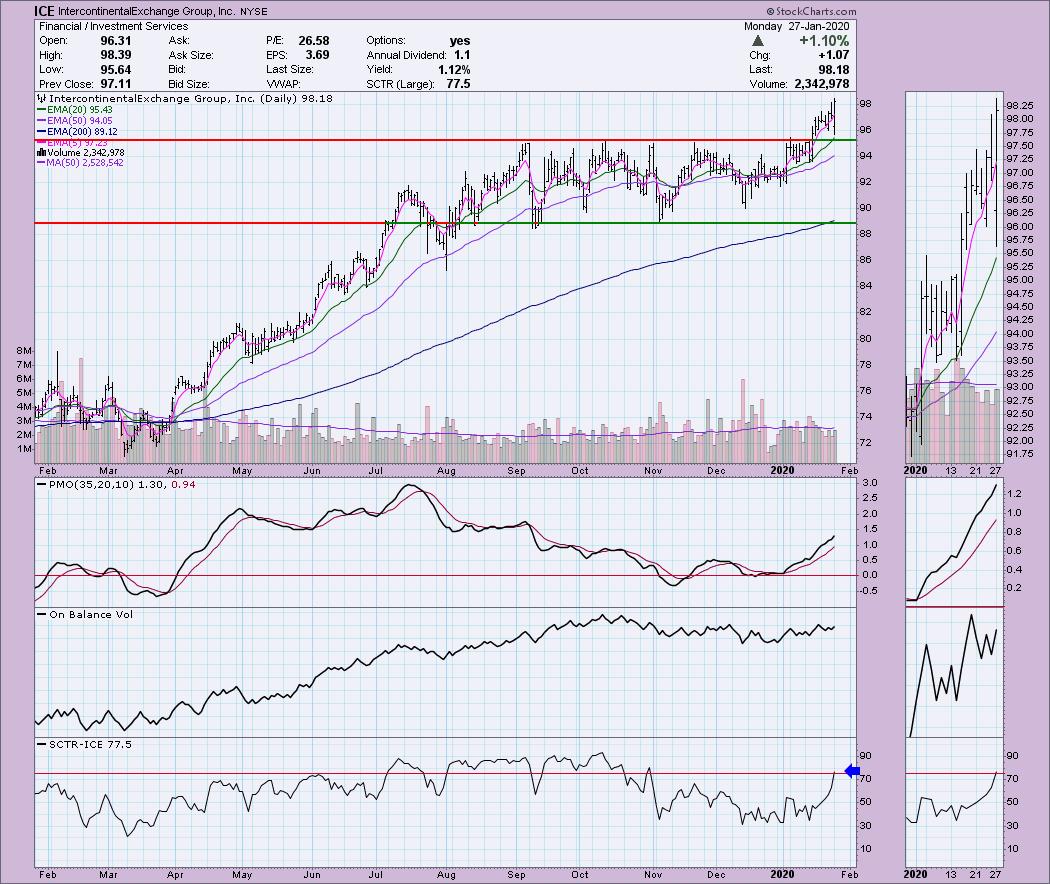
Intercontinental Exchange Group Inc (ICE) - Earnings: 2/6/2020
The PMO on this one is very nice as it rises with only a little bit of hesitation. Price closed near the top of its range for the day, but it was a volatile trading day. The SCTR is just now entering the "hot zone" above 75. I'd take a chance on this one with a stop around $94. I wouldn't really want this one if it goes back into the previous trading range.
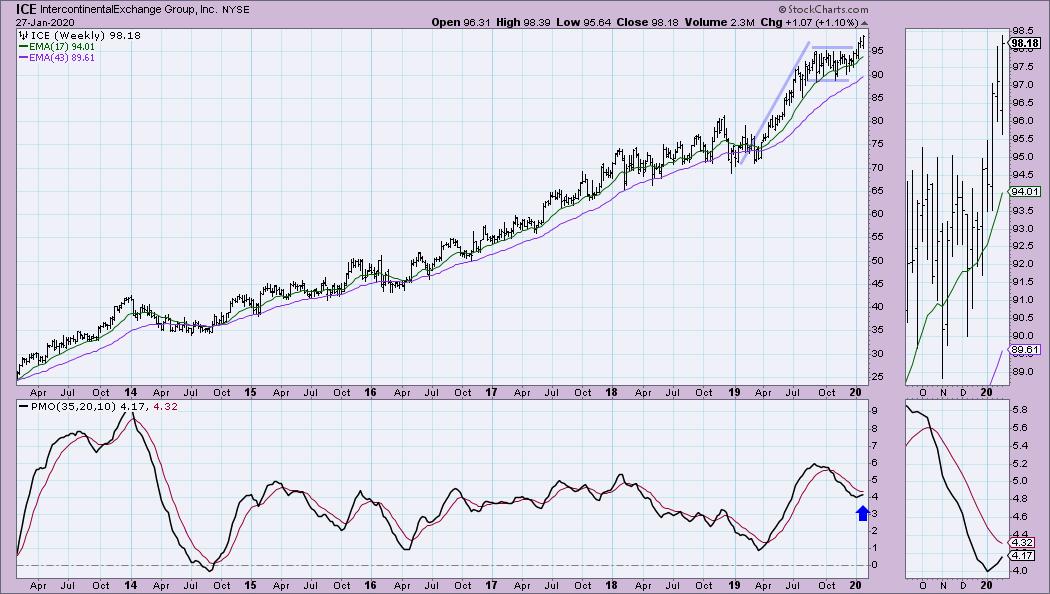
The weekly PMO looks good and I see a bull flag that has executed.
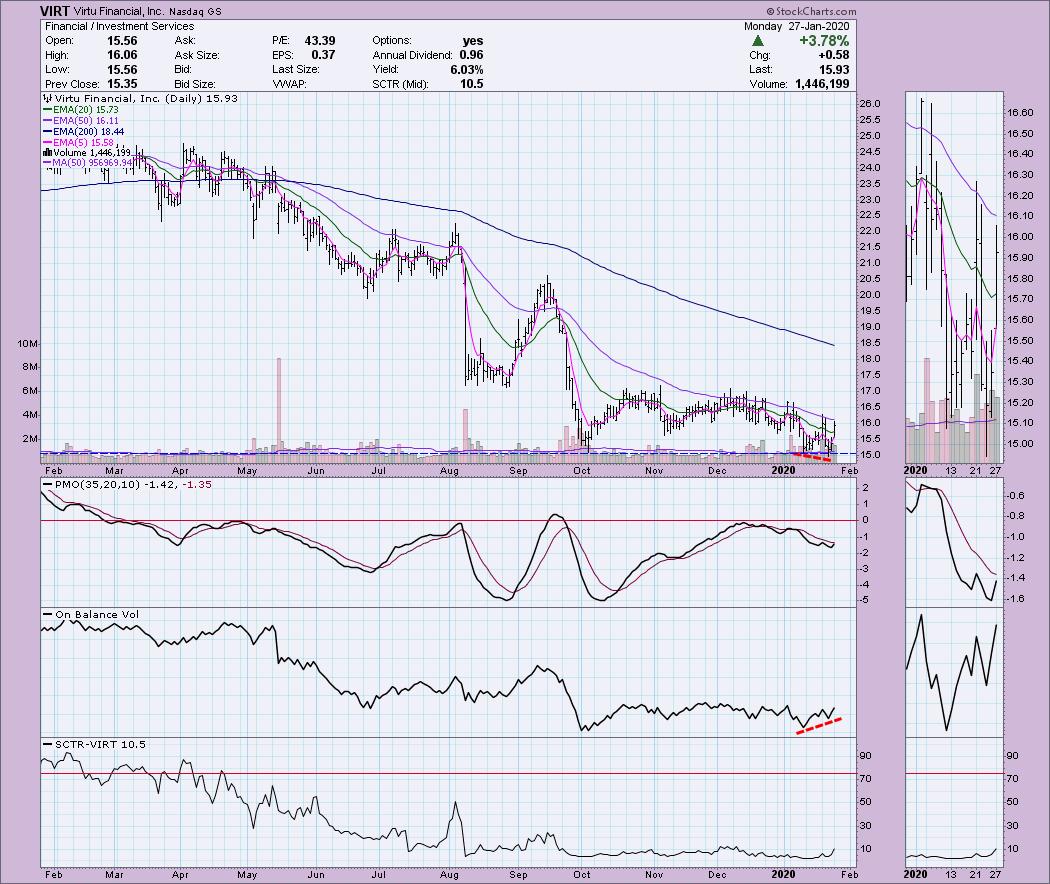
Virtu Financial Inc (VIRT) - Earnings: 2/5 - 2/10/2020
This is the "momentum sleeper" stock from the scan of the same name I mentioned in the opening. It has hit its lows for the year and is managing to hold onto that support. The OBV has a beautiful positive divergence. We usually see these critical positive divergences preceding a strong rally. I am expecting this one to continue higher (although it may need a pullback after today 3.78% rally move).
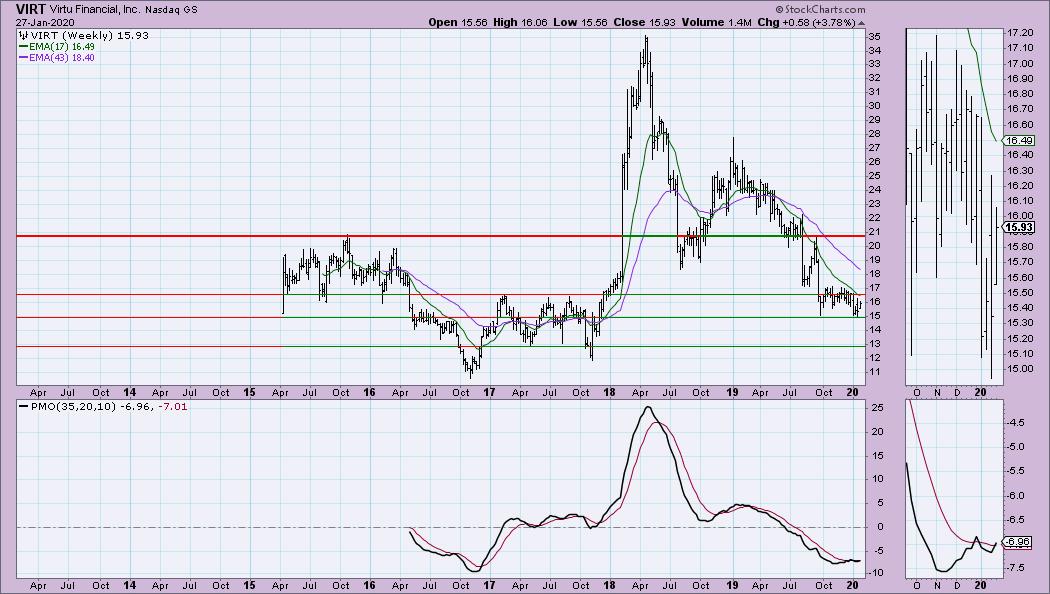
The PMO is turning up and giving us a BUY signal. Granted the previous BUY signal didn't work, but I like the set-up right now given price as price bounced off support. This one is oversold, but we have seen lower prices so the risk is there.
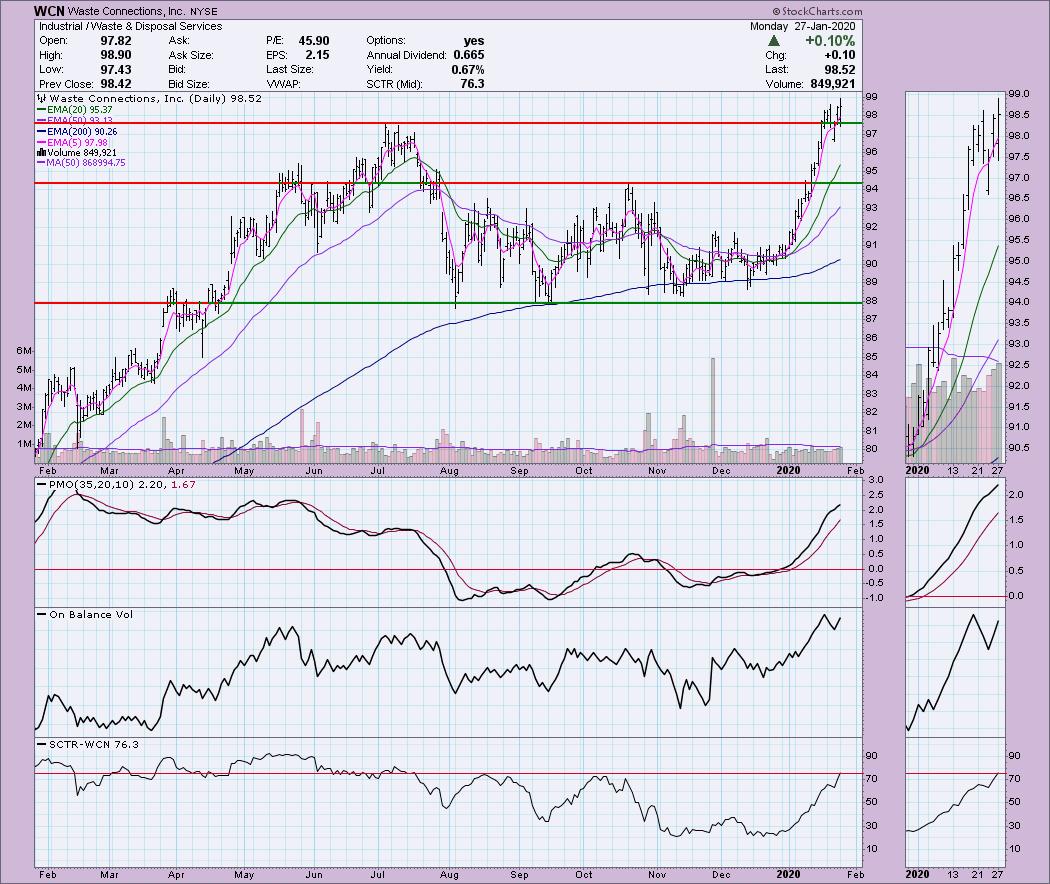
Waste Connections Inc (WCN) - Earnings: 7/2o/2016 (no other date listed)
This one has been on a near vertical rally. I usually stay away from those, but I like the current "pause" in the action. The PMO is on the overbought side, but the SCTR is just above 75 and support at the July top appears to be holding.
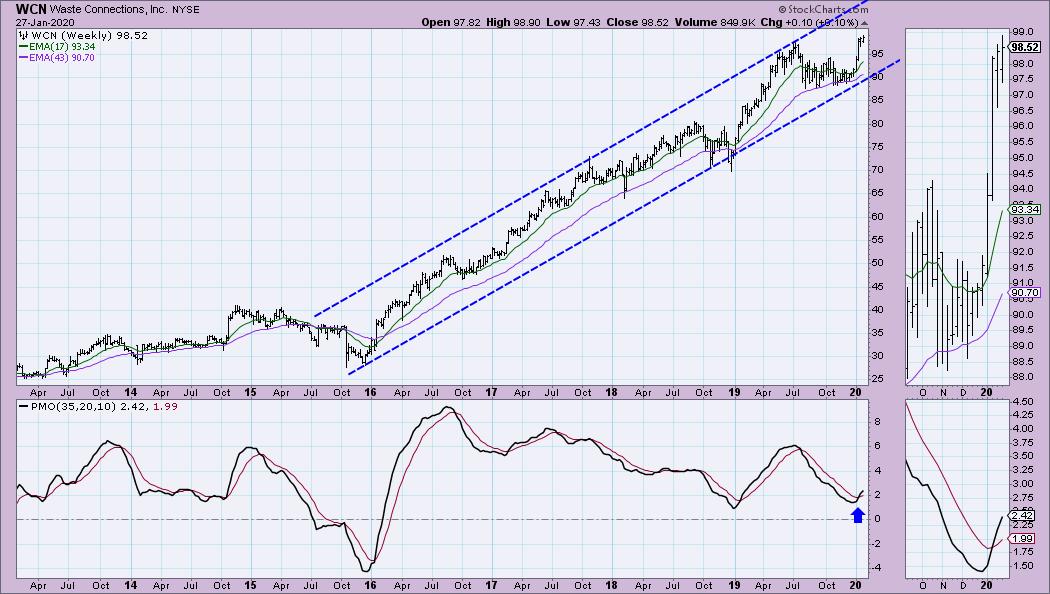
This is one of the few charts that doesn't have a parabolic upswing. Instead we have a nice rising trend channel. The weekly PMO just triggered a BUY signal. It is in the middle of the channel and is vulnerable to a move back down to test the rising trend.
Current Market Outlook:
Market Environment: It is important to consider the odds for success. The Silver Cross Index measures the percentage of stocks on IT Trend Model BUY signals (20-EMA > 50-EMA), while the Golden Cross Index measures the percentage of stocks on LT Trend Model BUY signals (50-EMA > 200-EMA). Don't forget that as a "Diamonds" member, you have access to our GCI/SCI curated ChartList on DecisionPoint.com. You'll find it under "Members Only" links on the left side on the Blogs and Links Page. Here are the current percentages on the Silver and Golden Cross Indexes:
Diamond Index:
- Diamond Scan Results: 2
- Diamond Dog Scan Results: 24
- Diamond Bull/Bear Ratio: 0.08
For a more comprehensive review of current market conditions as well as analysis of Dollar, Gold, Oil and Bonds, subscribe to the DecisionPoint Alert! For a LIMITED TIME you can get a coupon code that will give you a discount for bundling your Diamonds subscription with the DecisionPoint Alert! Contact support@decisionpoint.com for more details.
Full Disclosure: I do not own any of the stocks above. I'm currently 35% in cash.

Erin Swenlin will be presenting at the The MoneyShow Las Vegas on May 11-13, 2020! You'll have an opportunity to meet Erin and discuss the latest DecisionPoint news and Diamond Scans. The conference is free to attend or view online!
Watch the latest episode of DecisionPoint with Carl & Erin Swenlin LIVE on Mondays 5:00p EST or on the StockCharts TV YouTube channel here!
Technical Analysis is a windsock, not a crystal ball.
Happy Charting!
- Erin
erinh@stockcharts.com
NOTE: The stocks reported herein are from mechanical trading model scans that are based upon moving average relationships, momentum and volume. DecisionPoint analysis is then applied to get five selections from the scans. The selections given should prompt readers to do a chart review using their own analysis process. This letter is not a call for a specific action to buy, sell or short any of the stocks provided. There are NO sure things or guaranteed returns on the daily selection of "diamonds in the rough."
Helpful DecisionPoint Links:
DecisionPoint Shared ChartList and DecisionPoint Chart Gallery
Price Momentum Oscillator (PMO)
Swenlin Trading Oscillators (STO-B and STO-V)
For more links, go to DecisionPoint.com!