
I admit today it was easy determining "Diamonds" to talk about. However, they are more instructive today than "diamonds in the rough". I'll be looking at two reader requests which were very interesting indeed! I have room for more requests, so likely you'll see it until others catch on to this great blog. The other three will fit the title. On today's WealthWise Women show, Mary Ellen and I discussed Goldman Sachs Top Ten Stocks in Potential Sales Growth. From those three, I have a "Diamond Dog" that has few if any redeemable qualities. I have a stock from that list that I think has good potential technically and I have a stock from list of darlings, but is in a bad parabolic.
Welcome to DecisionPoint Daily Diamonds, wherein I highlight five "diamonds in the rough." These are selected from the results of my DecisionPoint scans, which search for stocks that could benefit from the trend and condition of the market. Remember, these are not recommendations to buy or sell, but are the most interesting of the stocks that surfaced in my scans. My objective is to save you the work of the initial, tedious culling process, but you need to apply your own analysis to see if these stocks pique your interest as well. There are no guaranteed winners here!
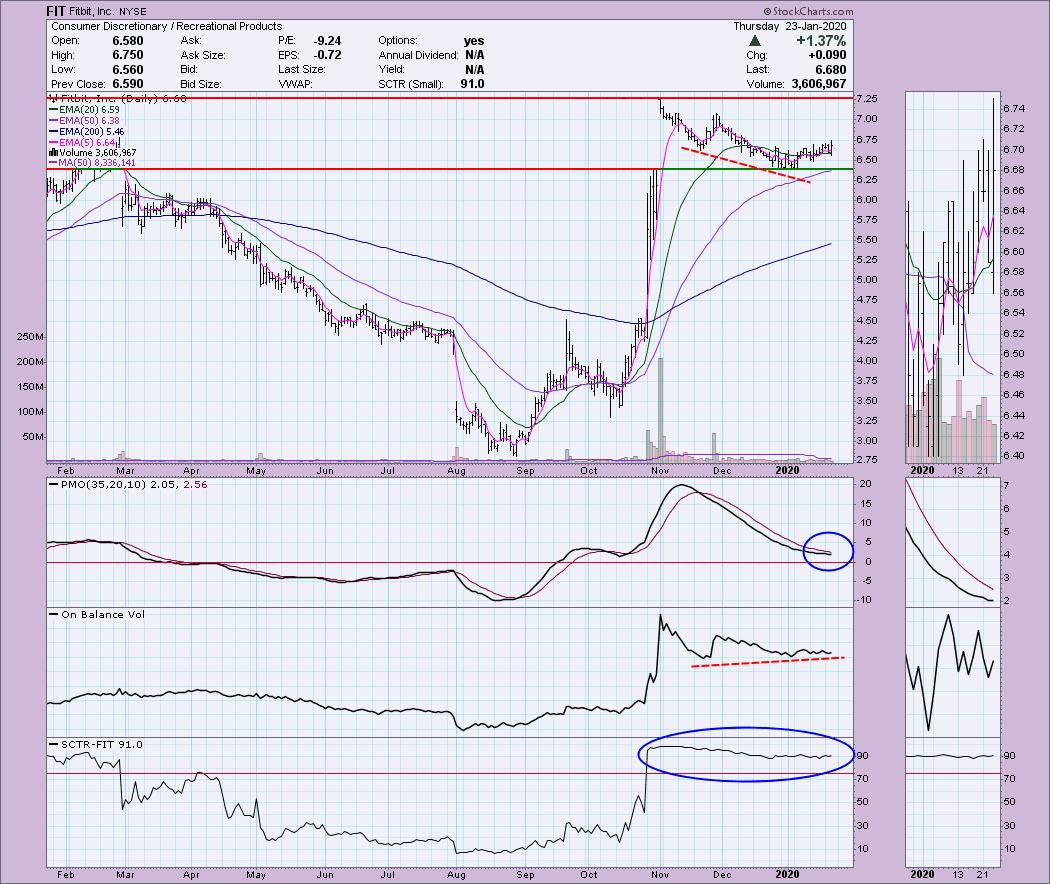
Reader Request: Fitbit Inc (FIT) - Earnings: 2/25 - 3/2/2020
I like this one even though it wouldn't have hit any of my regular scans (the PMO isn't rising just yet). The PMO is decelerating. The OBV is in a great positive divergence. The gap was filled and price is moving back up. The SCTR is great, but the large move in October, I suspect on earnings, is skewing the SCTR calculations (a link is at the bottom of the article with details on this calculation).
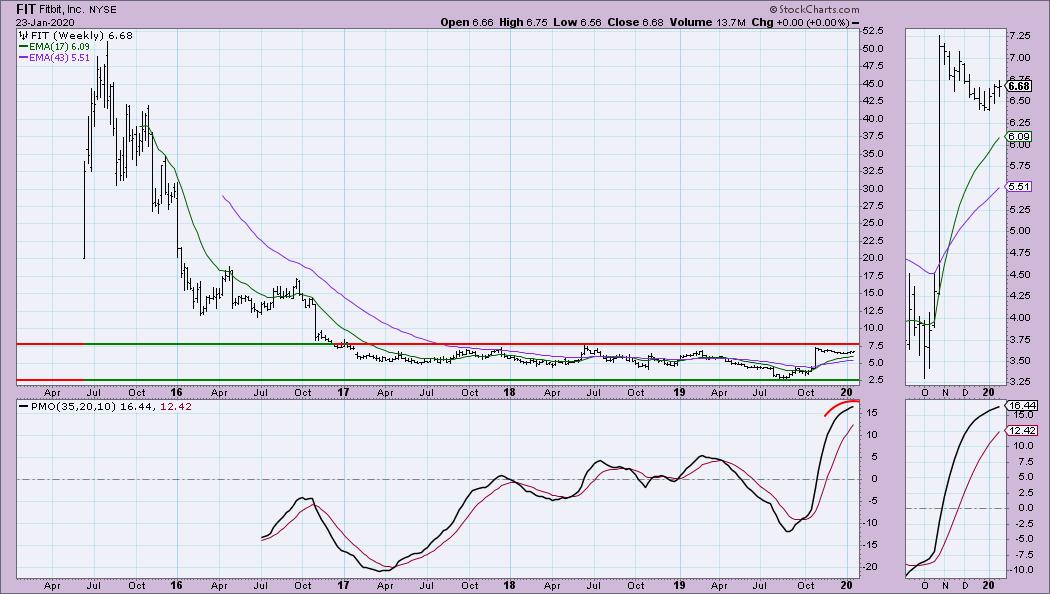
The weekly chart is a little problematic. Price is nearing the top of a trading range (basing pattern) for years. The PMO is overbought and turning over (albeit still rising). Here's the deal, I think based on the daily chart it will test the top of the range. If it breaks out, it could set a new range or even go parabolic. I'd say this is an interesting short-term investment, but one to be true to your target and sell a portion or all shares when it reaches it. If it breaks out convincingly, you could get back in and set your stop at your previous target.
Don't forget, on Thursdays I look at reader-requested symbols, so shoot me an email at erin@decisionpoint.com. I read every email I receive and try to answer them all!
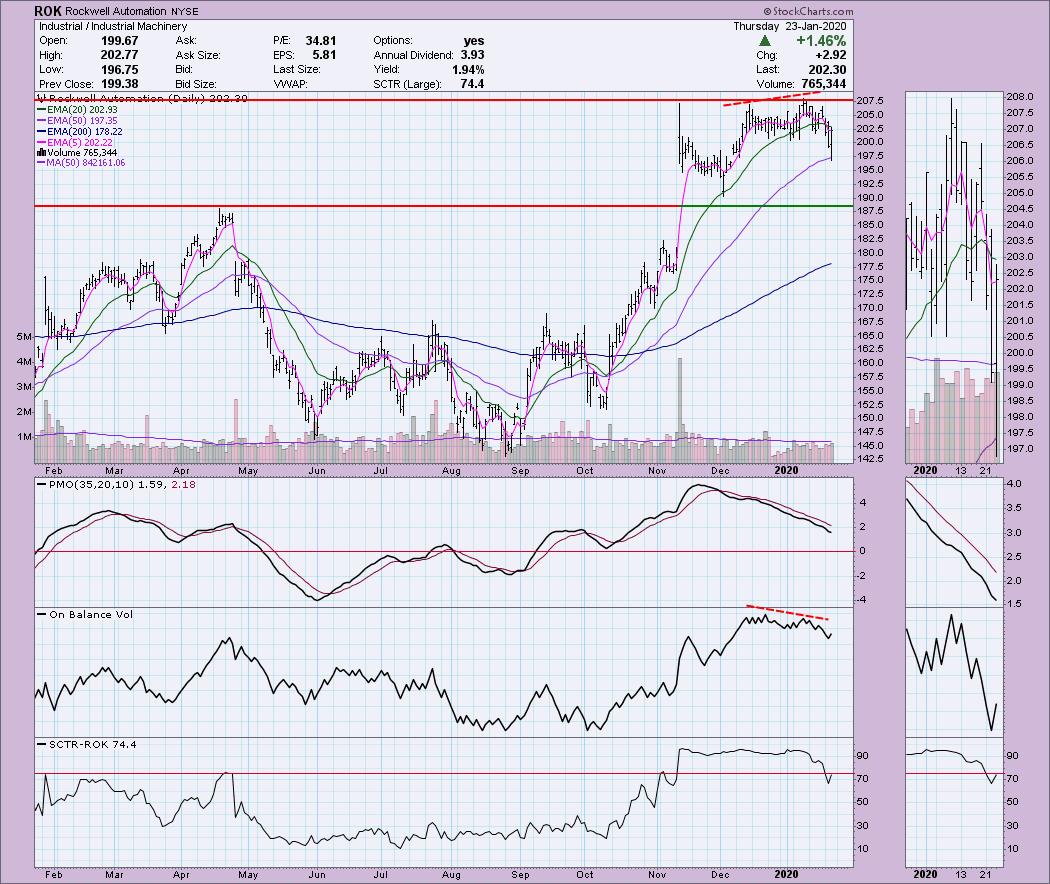
Reader Request: Rockwell Automation (ROK) - Earnings: 1/29/2020
I'm not a fan of this one just yet. It has some work to do and it likely will be more downside. The 50-EMA could hold and it did close near today's high, but the PMO and negative divergence on the OBV suggest to me it will need to test support at the April top/December low. This will then make this one tasty. If it bounces off that support level, the PMO is oversold and has plenty of room to support a rally back to the top of this range.
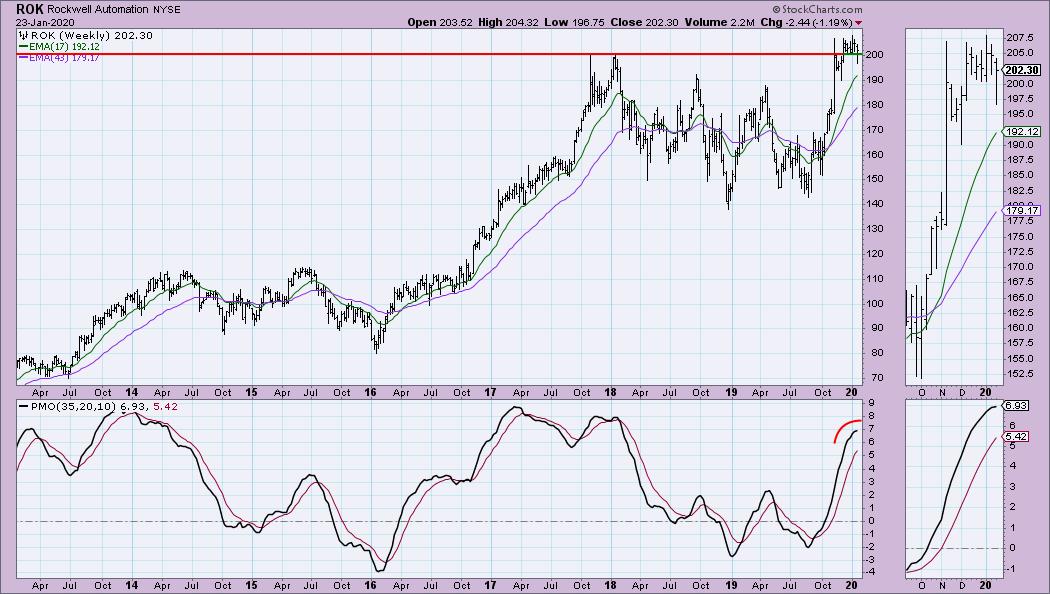
The weekly PMO is turning over, but it is still rising. You can see the importance of the $200 level as support. That level was breached this week. But, if it tests the $190 level and moves back up, we could see a bull flag form and execute. I just would hold off until it holds $190 support.
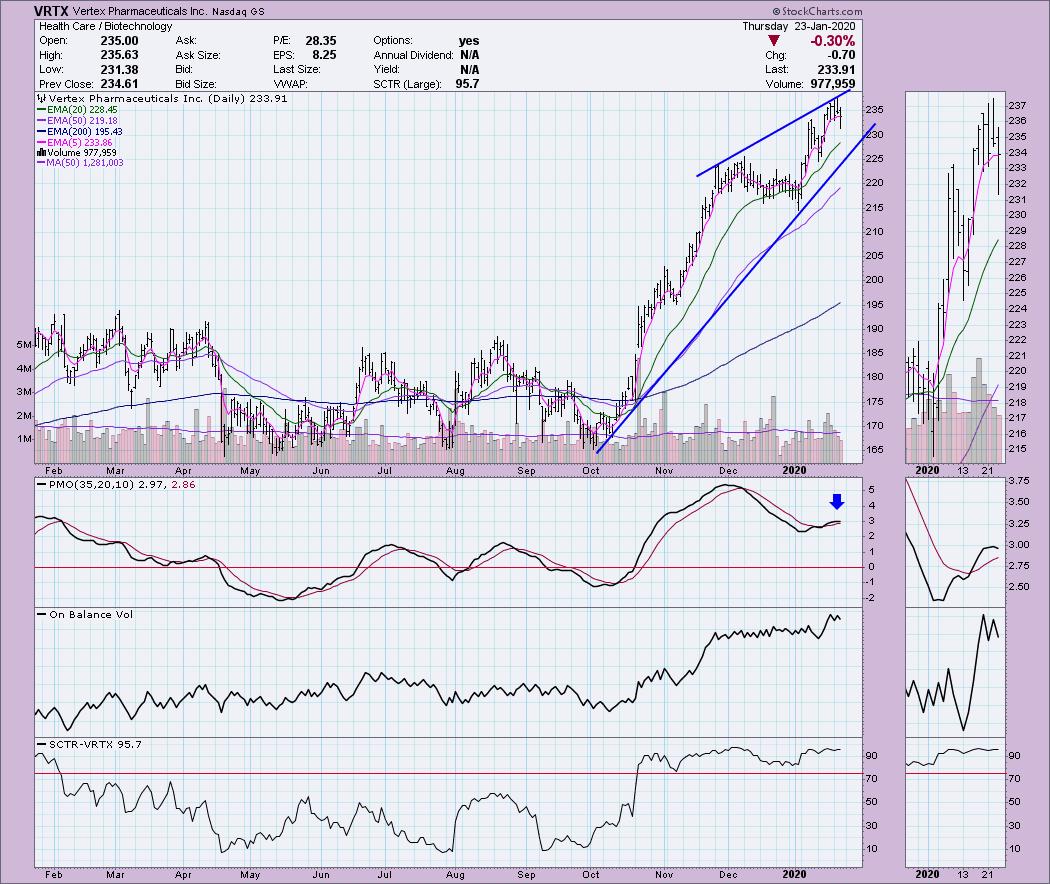
The Good: Vertex Pharmaceuticals Inc (VRTX) - Earnings: 1/30/2020
The reason the next three hit the radar is the Goldman-Sachs list I spoke of in the opening. So this one has a projected sales growth of 28% for 2020. It's been a winner, but short-term I'm not a huge fan. This isn't bad or ugly, mainly because of the SCTR ranking and confirming OBV (along with sales growth). The rising wedge suggests we should see a breakdown of the rising trend. Next support is at $215. That's short-term risk right now that I don't like.
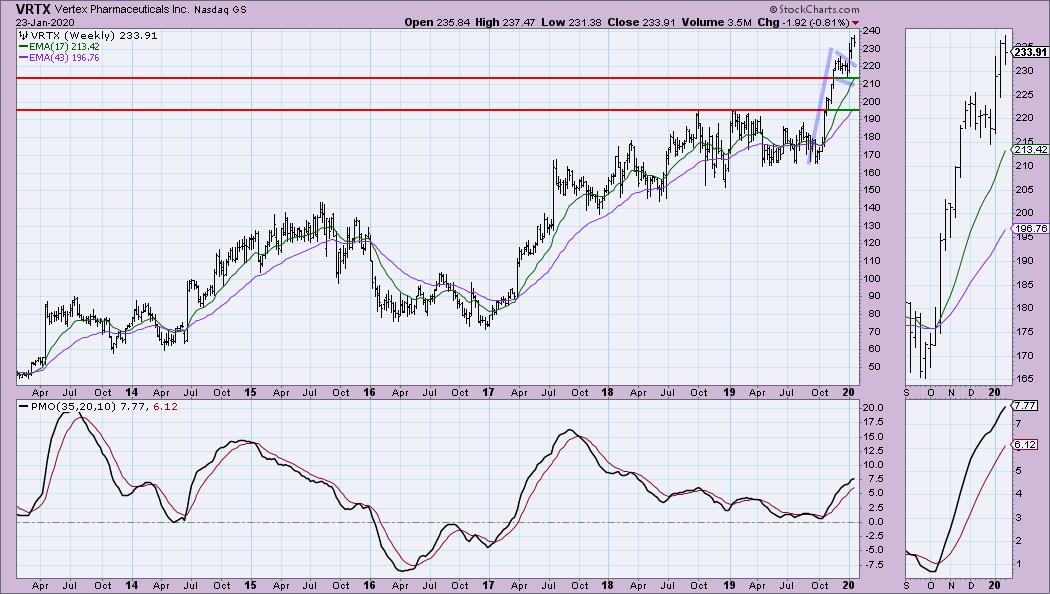
However, the weekly chart is very enticing for the intermediate term. We have a bull flag that has executed and that suggests higher prices. The PMO is accelerating higher and is not overbought. Possible watch list candidate.
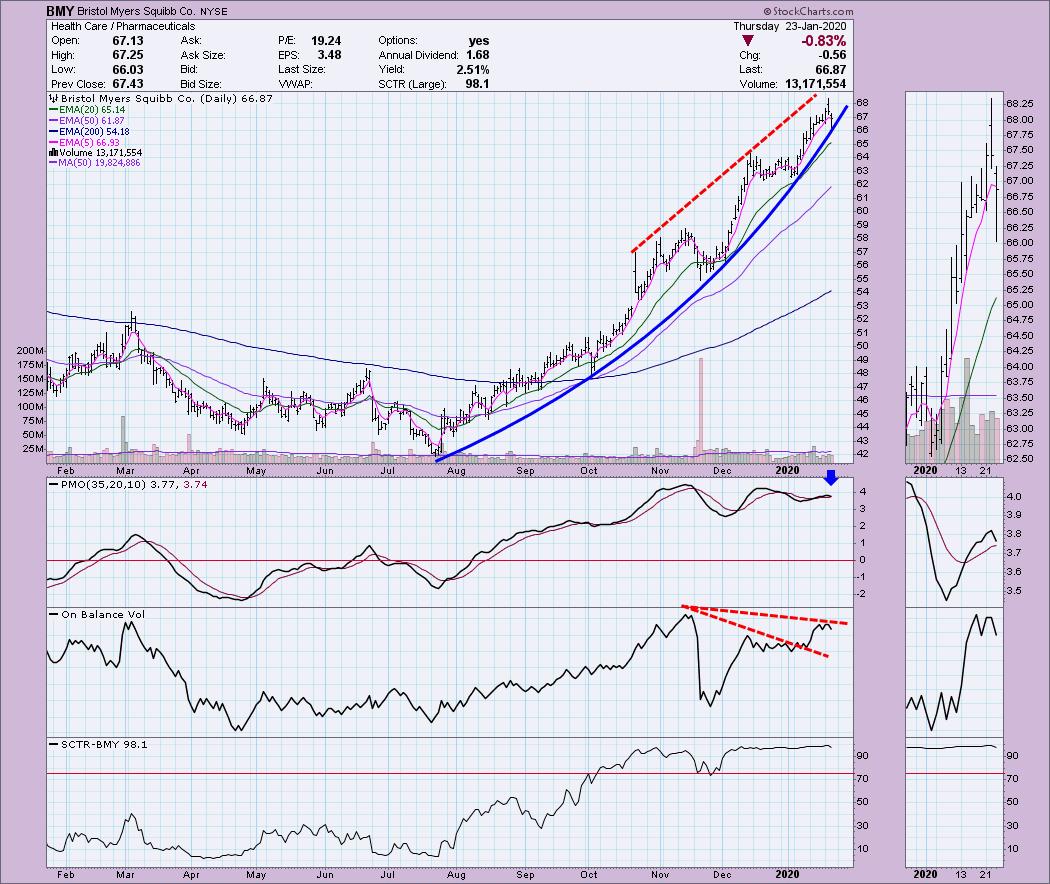
The Bad: Bristol Myers Squibb Co (BMY) - Earnings: 2/6/2020
This one topped the list for potential sales growth at a whopping 74%! How's that for fundamentals? The technicals bother me. Short term there is a parabolic, not extreme but parabolic nonetheless. These generally break down to the previous basing pattern. That could be all the way down into the $53 range. However, given that potential sales growth, I don't see that happening. But, it could certainly collapse and test $62 or even $59 before making its way higher. Just the risk you should think about especially with that negative divergence with the OBV.
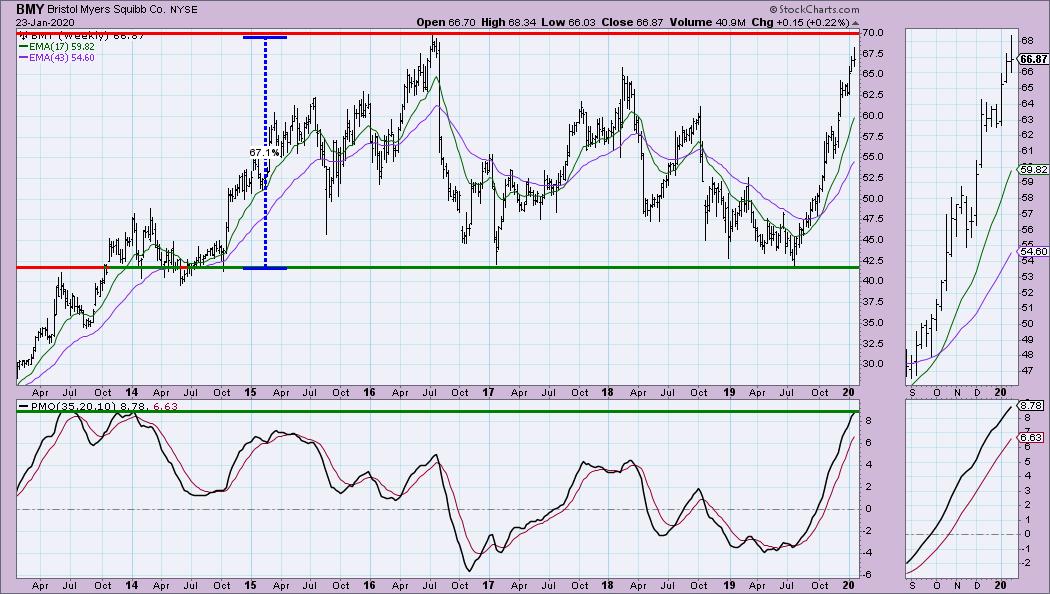
This is a big concern. Price is now at the top of a multi-year trading range, a very wide one. The PMO is overbought. If price breaks out to new all-time highs on sales, I could reevaluate. There's too much risk right now for my taste so I deem it bad.
The Ugly: Boeing Co (BA) - Earnings: 1/29/2020
This one doesn't require too much comment as I think most anyone would look at this chart and be troubled. I'm not dissing today's 2.84% move, but overhead resistance at $320 (previous intermediate-term support) wasn't challenged, at least not yet. The OBV is confirming the low. You can see that today's positive volume was only a blip to the upside as far as the OBV was concerned. SCTR hasn't see the 'hot zone' above 75 in quite awhile.
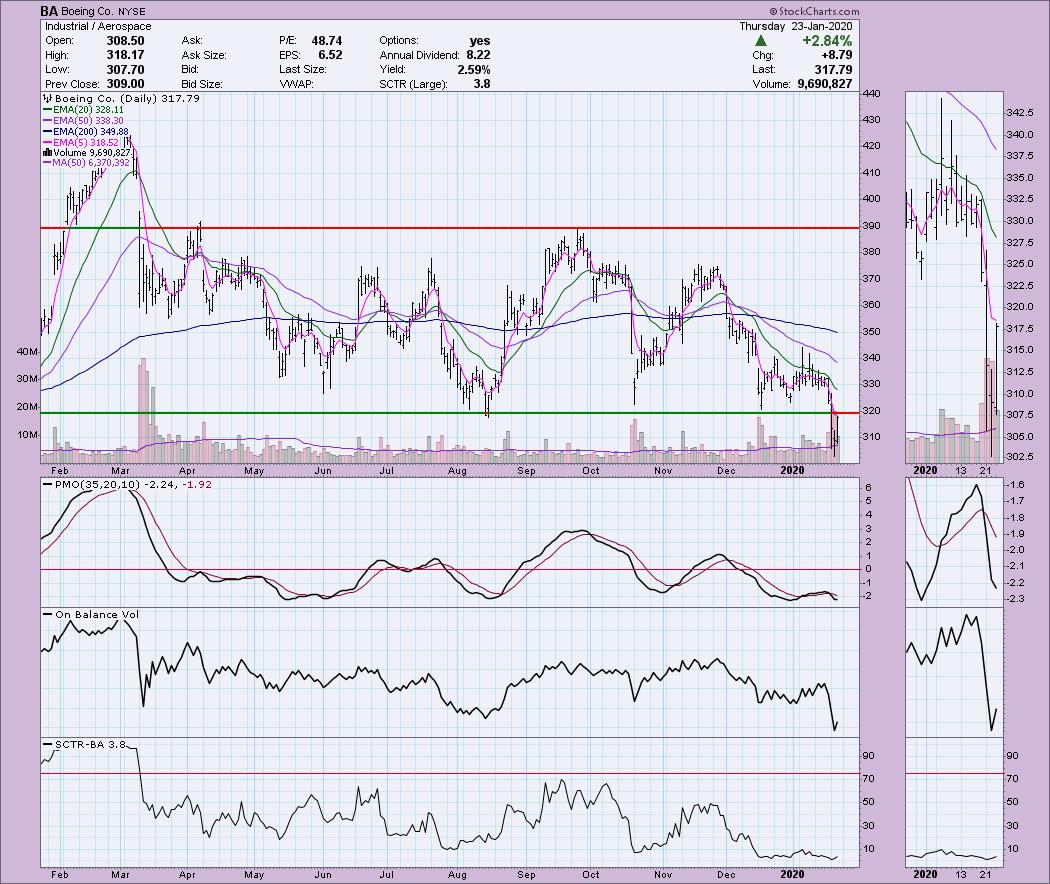
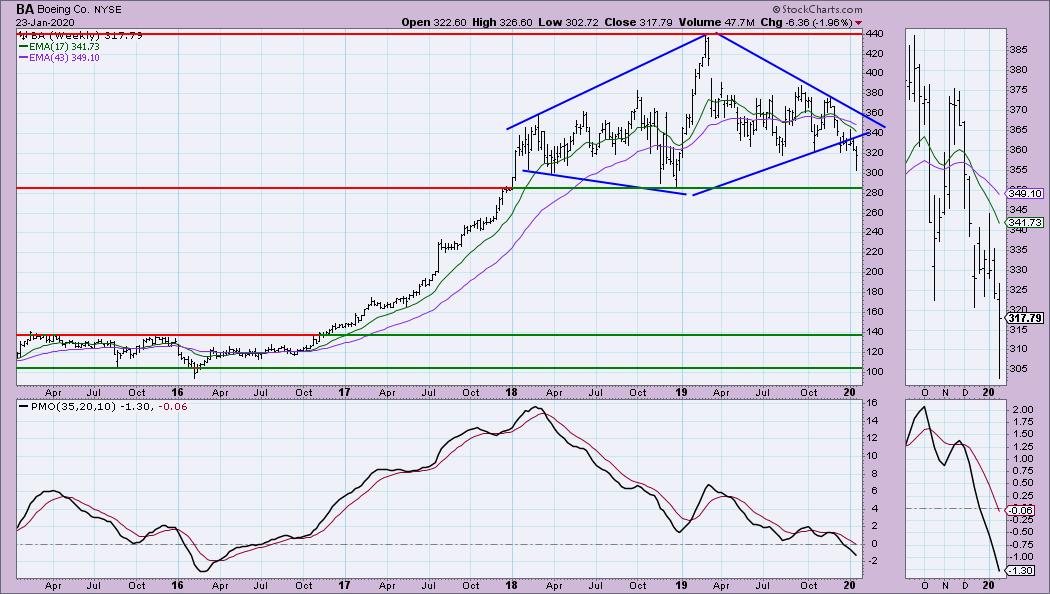
A reader sent this one to me. Sadly I am pretty sure this one was a diamond in the rough earlier this year or in December. They aren't all winners and I wish I'd spotted this rare chart formation. Coincidentally enough it is called a "Diamond" pattern. The are reversal patterns, so seeing this one after a steady rising trend is very troubling. The minimum downside target (height of the pattern) takes price back toward the previous basing pattern...a long way down. If we do see support hold at $280 and get a nice rally, then this one could just become a trading range.
Current Market Outlook:
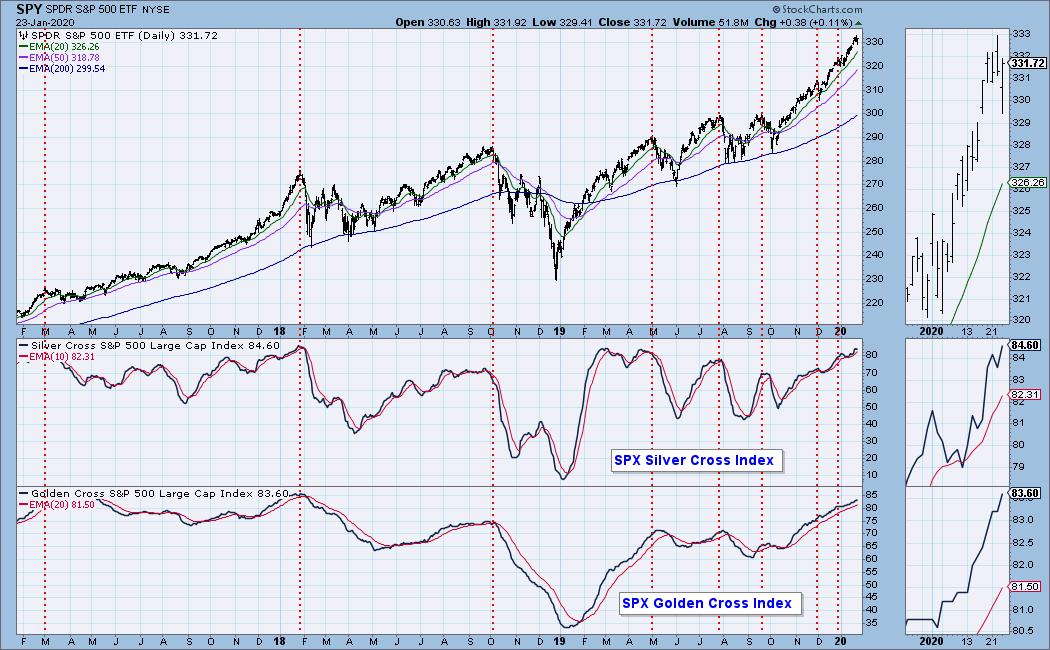
Market Environment: It is important to consider the odds for success. The Silver Cross Index measures the percentage of stocks on IT Trend Model BUY signals (20-EMA > 50-EMA), while the Golden Cross Index measures the percentage of stocks on LT Trend Model BUY signals (50-EMA > 200-EMA). Don't forget that as a "Diamonds" member, you have access to our GCI/SCI curated ChartList on DecisionPoint.com. You'll find it under "Members Only" links on the left side on the Blogs and Links Page. Here are the current percentages on the Silver and Golden Cross Indexes:
Diamond Index:
- Diamond Scan Results: 8
- Diamond Dog Scan Results: 12
- Diamond Bull/Bear Ratio: 0.67
For a more comprehensive review of current market conditions as well as analysis of Dollar, Gold, Oil and Bonds, subscribe to the DecisionPoint Alert! For a LIMITED TIME you can get a coupon code that will give you a discount for bundling your Diamonds subscription with the DecisionPoint Alert!
Full Disclosure: I do not own any of the stocks above. I'm currently 35% in cash.

Erin Swenlin will be presenting at the The MoneyShow Las Vegas on May 11-13, 2020! You'll have an opportunity to meet Erin and discuss the latest DecisionPoint news and Diamond Scans. The conference is free to attend or view online!
Watch the latest episode of DecisionPoint with Carl & Erin Swenlin LIVE on Mondays 5:00p EST or on the StockCharts TV YouTube channel here!
Technical Analysis is a windsock, not a crystal ball.
Happy Charting!
- Erin
erinh@stockcharts.com
NOTE: The stocks reported herein are from mechanical trading model scans that are based upon moving average relationships, momentum and volume. DecisionPoint analysis is then applied to get five selections from the scans. The selections given should prompt readers to do a chart review using their own analysis process. This letter is not a call for a specific action to buy, sell or short any of the stocks provided. There are NO sure things or guaranteed returns on the daily selection of "diamonds in the rough."
Helpful DecisionPoint Links:
DecisionPoint Shared ChartList and DecisionPoint Chart Gallery
Price Momentum Oscillator (PMO)
Swenlin Trading Oscillators (STO-B and STO-V)
For more links, go to DecisionPoint.com!