
It's reader request day! I picked out two that I found interesting.
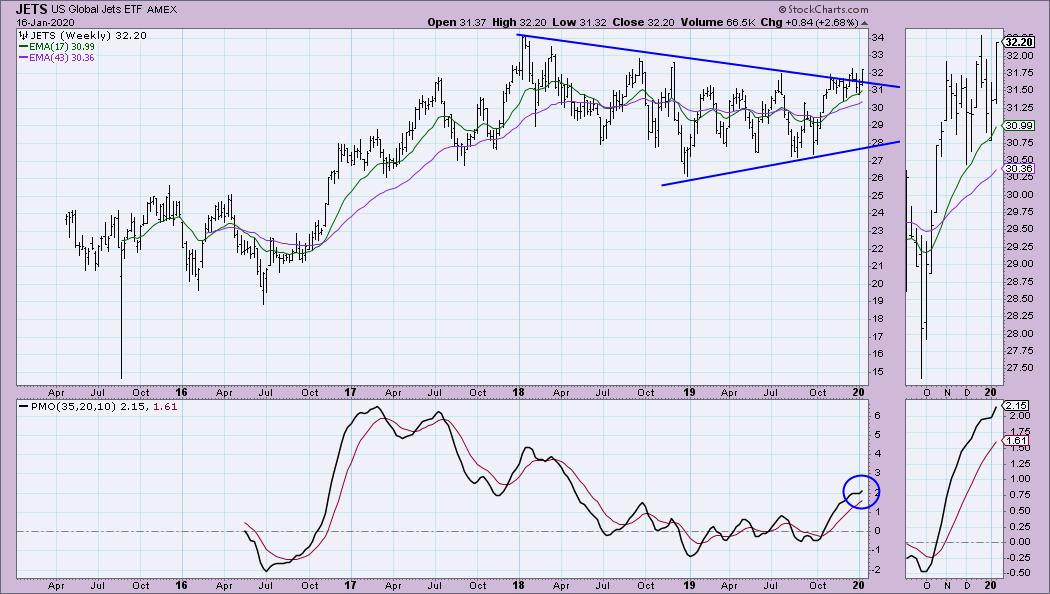
On today's WealthWise Women Show, Mary Ellen and I discussed how to find excellent investment candidates by 'clicking into strength' using the Sector Summary and Industry Group Summary on StockCharts.com. While reviewing today's results, I noticed that Airlines broke out nicely today (see the weekly chart of Airlines ETF (JETS) below). I decided to look for airline stocks in the scan results. It paid off as I think this airline is a "diamond in the rough".
Don't forget, on Thursdays I look at reader-requested symbols, so shoot me an email at erin@decisionpoint.com. I read every email I receive and try to answer them all!
Welcome to DecisionPoint Daily Diamonds, wherein I highlight five "diamonds in the rough." These are selected from the results of my DecisionPoint scans, which search for stocks that could benefit from the trend and condition of the market. Remember, these are not recommendations to buy or sell, but are the most interesting of the stocks that surfaced in my scans. My objective is to save you the work of the initial, tedious culling process, but you need to apply your own analysis to see if these stocks pique your interest as well. There are no guaranteed winners here!
Reader Request: Amazon.com Inc (AMZN) - Earnings: 1/29 - 2/3/2020
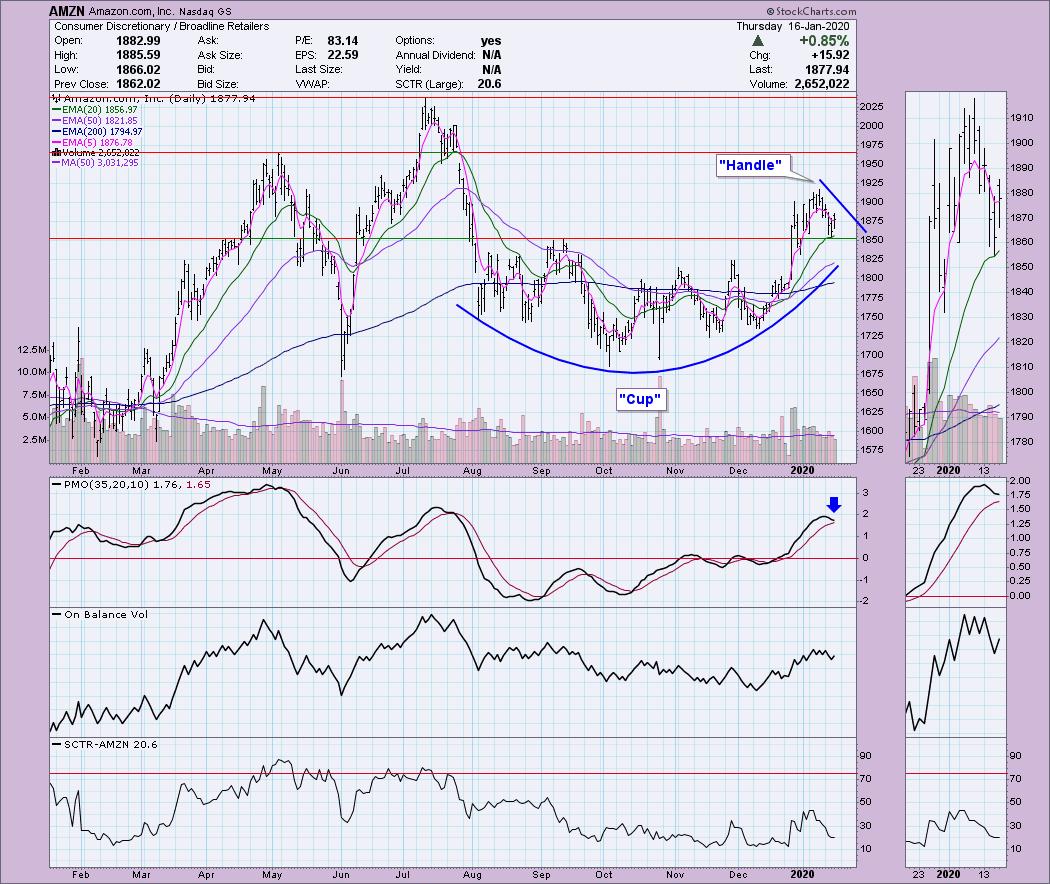
I actually picked Amazon as likely the best FAANG stock performer for 2020. I like that it has been 'dormant' for the past 6 months, staying in a trading range that forms a cup and the most recent pullback from the January high is the handle. A "cup and handle" formation is bullish. The expectation is that we will see a bounce off support at the top end of the cup. This is exactly what I'm seeing. At first I was going to discard this reader pick based on the PMO. However, when I looked more closely, I see that the PMO is decelerating and could form a bottom above the signal line which is very bullish should it come to pass. The OBV hasn't really deteriorated much on this pullback.
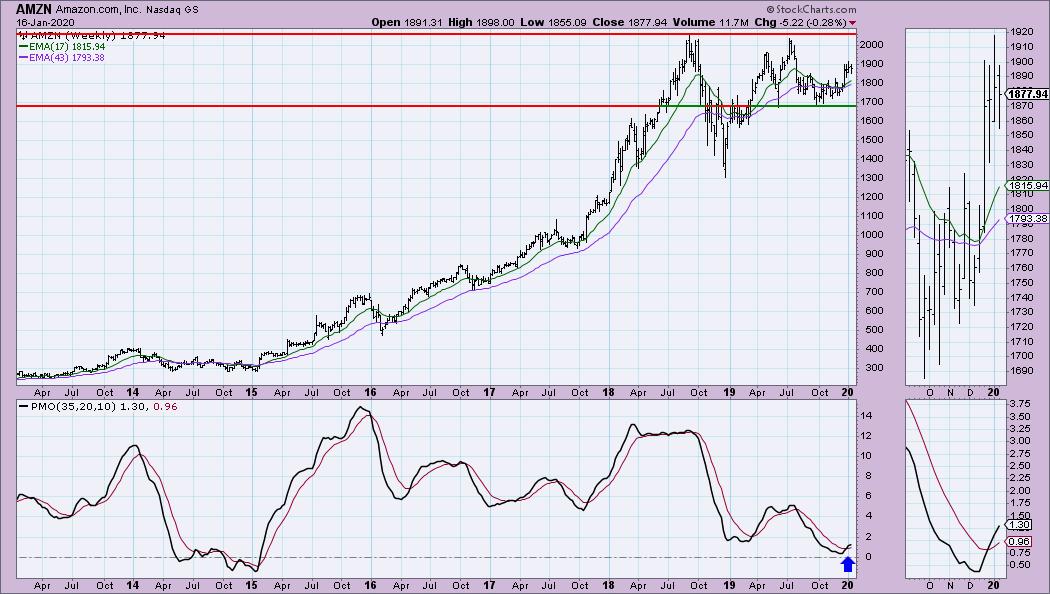
The weekly chart looks great for AMZN as we just got an oversold PMO BUY signal just above the zero line. Not a bad pick!
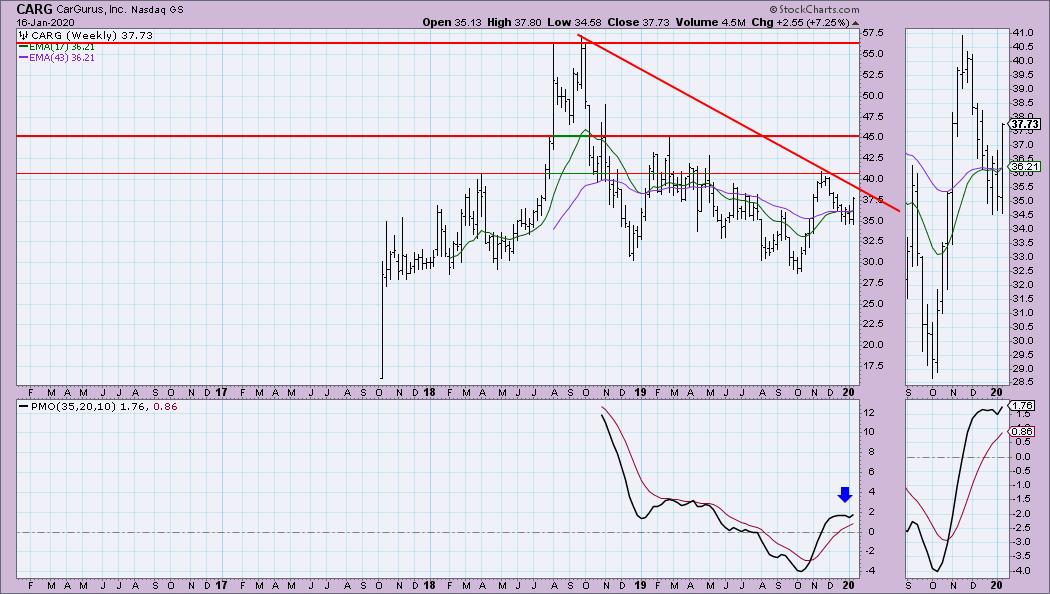
CarGurus Inc (CARG) - Earnings: 2/13/2020
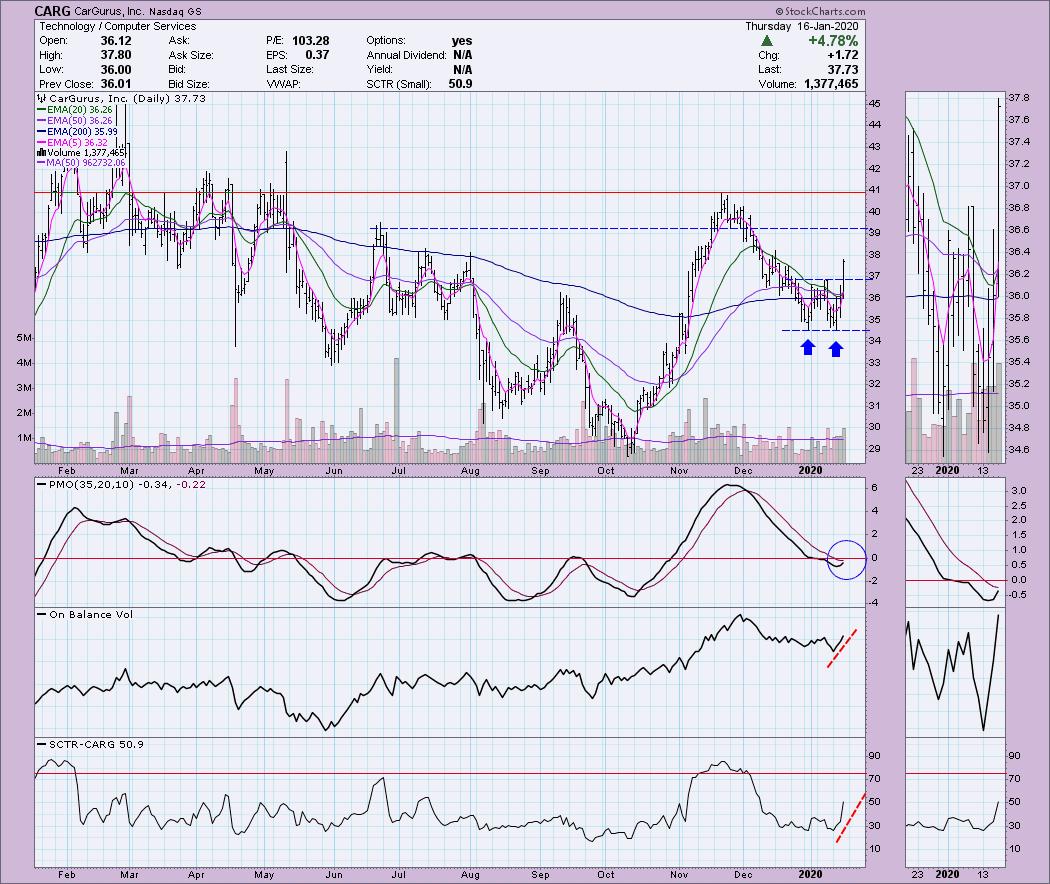
This one had a spectacular day and will need a pullback. Today's giant rally confirmed the double-bottom pattern. Based on the calculation, the minimum upside target is just above $39, but I would look for a challenge of the November top. The PMO is zeroing in on a BUY signal and both the OBV and SCTR are confirming this rally.
We haven't actually seen a move out of the declining trend on the weekly chart, but notice the 17/43-week EMAs are showing a pending positive crossover. The weekly PMO has turned back up.
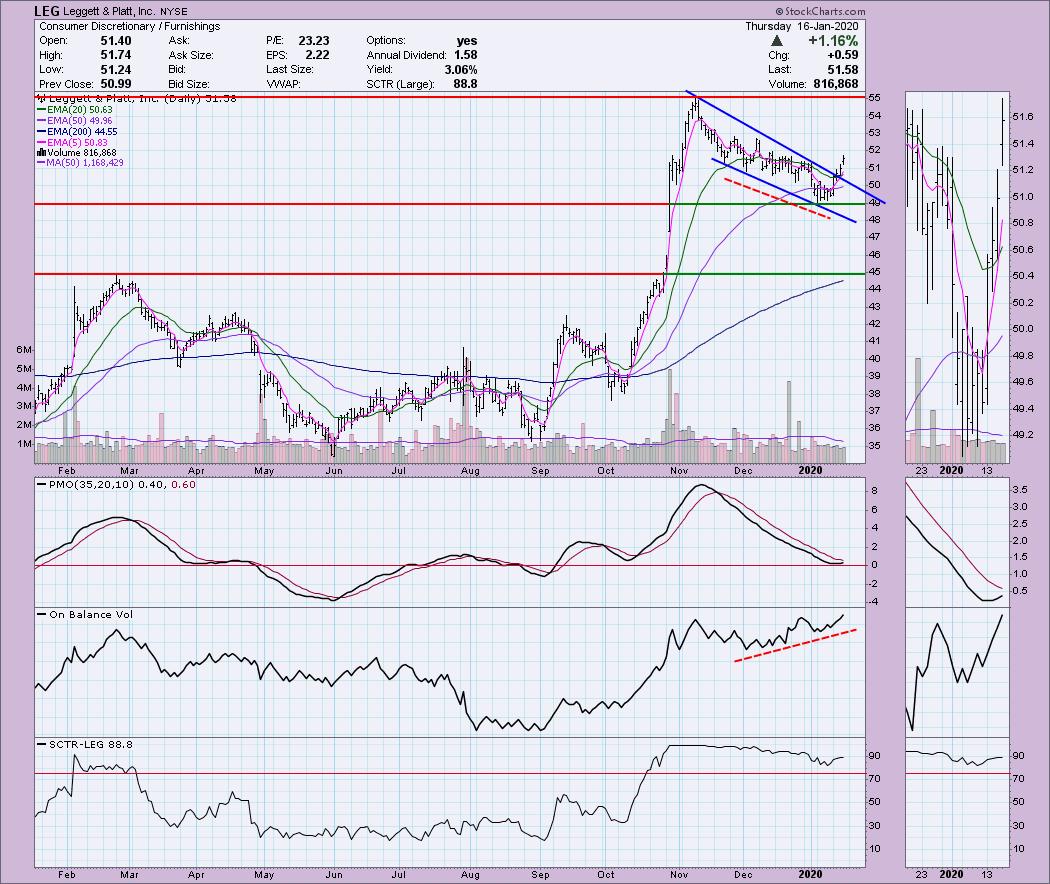
Leggett & Platt Inc (LEG) - Earnings: 2/3/2020
LEG broke out of a falling wedge (as expected) and is continuing to rally higher. The PMO has turned up. We had a positive divergence going on the OBV that foretold of a rally coming. I would look for this one to take a long ride to the upside to $55 resistance.
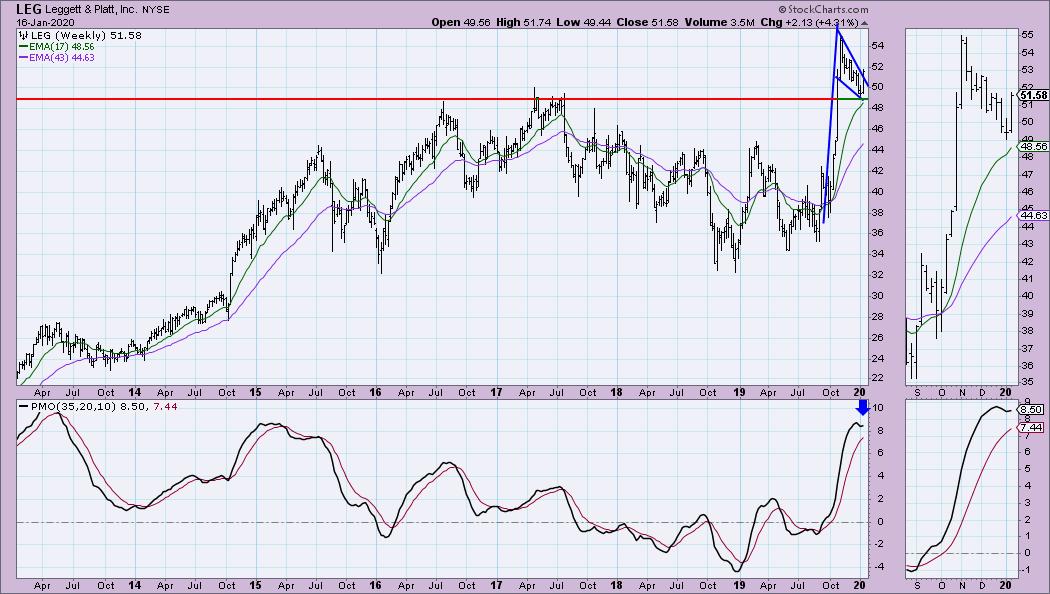
There's a bull flag on the weekly chart. I nearly dismissed this one based on the weekly PMO, but it has turned up. It is on the overbought side, but we saw higher readings in 2013 on the PMO so there's room to grow. This rally has executed that bull flag. While I don't see a rally the height of the flagpole in the future right now, I do believe it bodes well for LEG in the intermediate term.
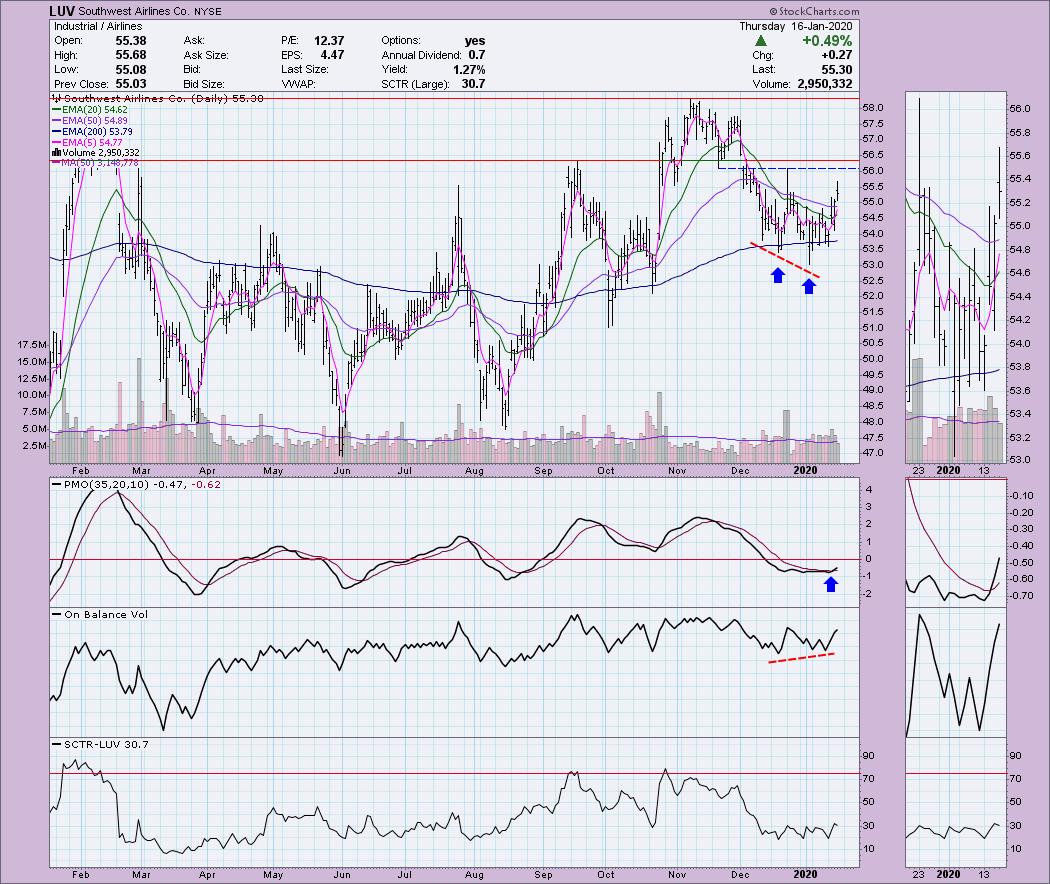
Southwest Airlines Co (LUV) - Earnings: 1/23/2020
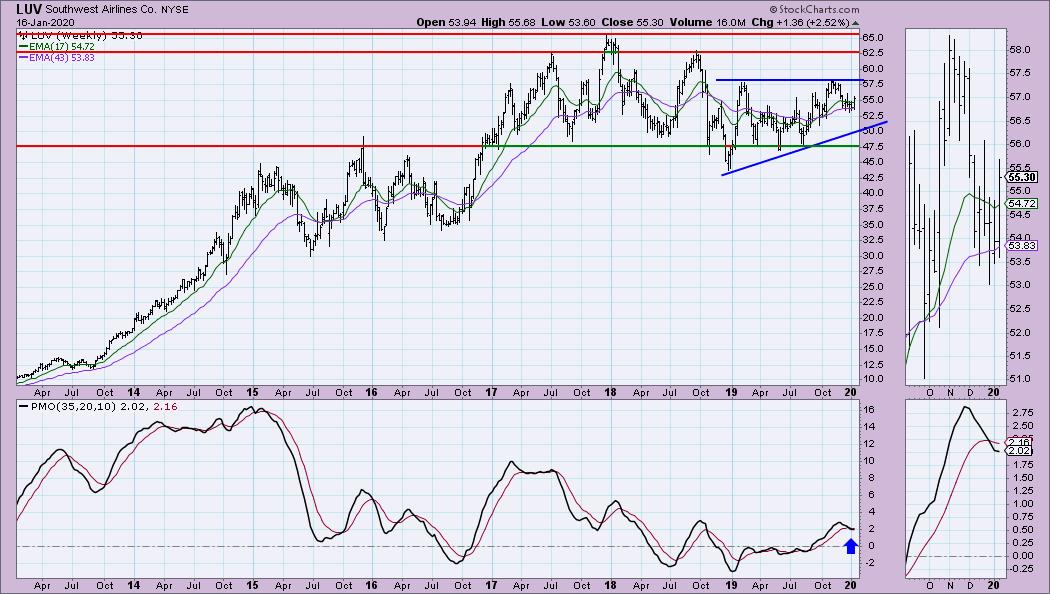
Well here is the airline that came up in my scans today. After noting the strength of the industry group and seeing the JETS chart, I wanted to find a candidate. LUV just triggered a PMO BUY signal. Look at the beautiful positive divergence on the OBV bottoms matched with price lows. I also see a possible bullish double-bottom pattern forming. This one could be a leap of faith right now as price hasn't actually executed the pattern and overhead resistance could be difficult near the confirmation line.
There is a bullish ascending triangle on the weekly chart. The expectation is a breakout above resistance and a follow-up move that is the height of the back of the pattern. That would definitely put it at new all-time highs.
Reader Request: TE Connectivity Ltd (TEL) - Earnings: 1/29/2020
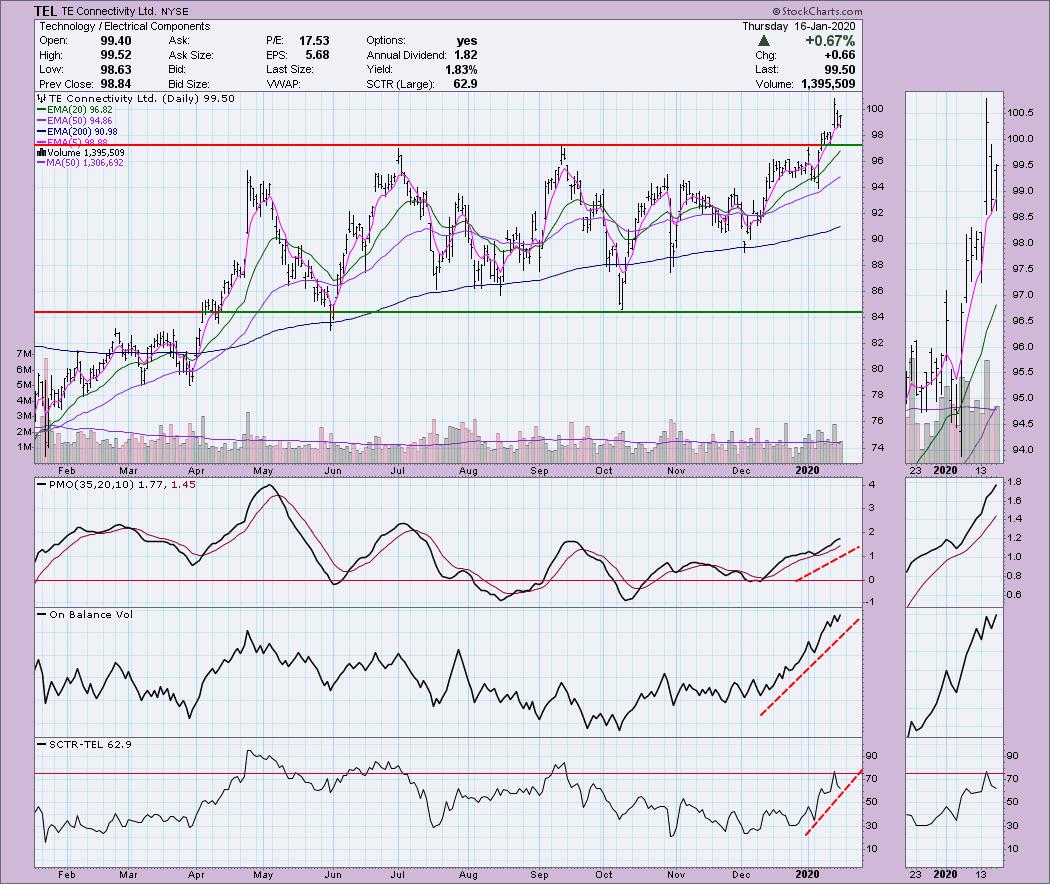
I like the look of TEL. Price rallied and gapped up on the breakout from a longer-term trading range. I always like to see those big upside runs and then a pullback before entering. I think a stop just under this support level at the June/September tops makes sense, or a bit lower if this is an intermediate-term investment. The PMO, OBV and SCTR are all confirming this breakout rally.
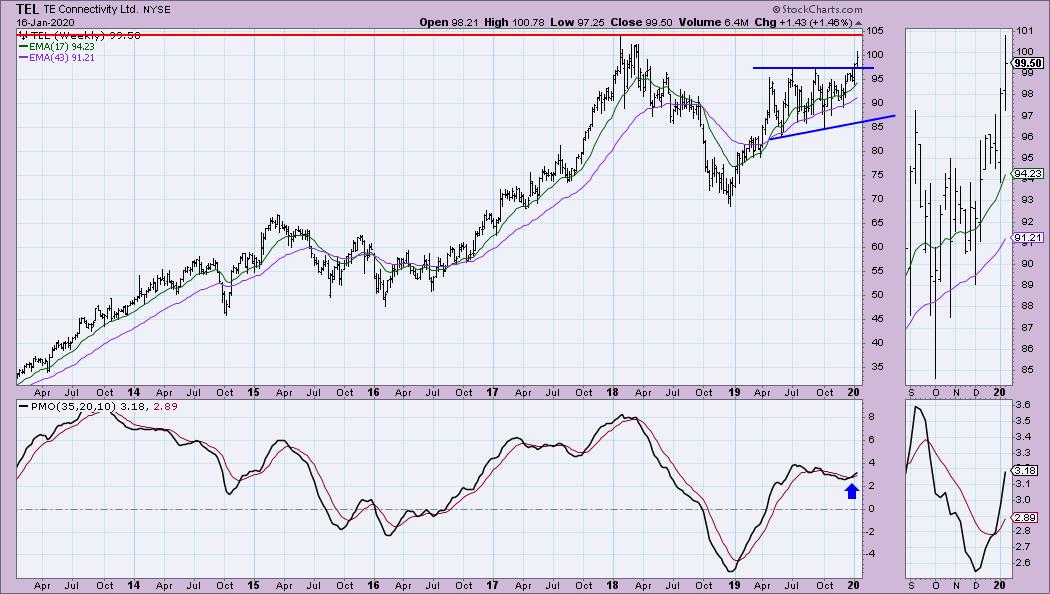
The intermediate-term ascending triangle is bullish and it was just executed with this week's rally. The PMO is on a new BUY signal and is not overbought. Nice pick!
Current Market Outlook:
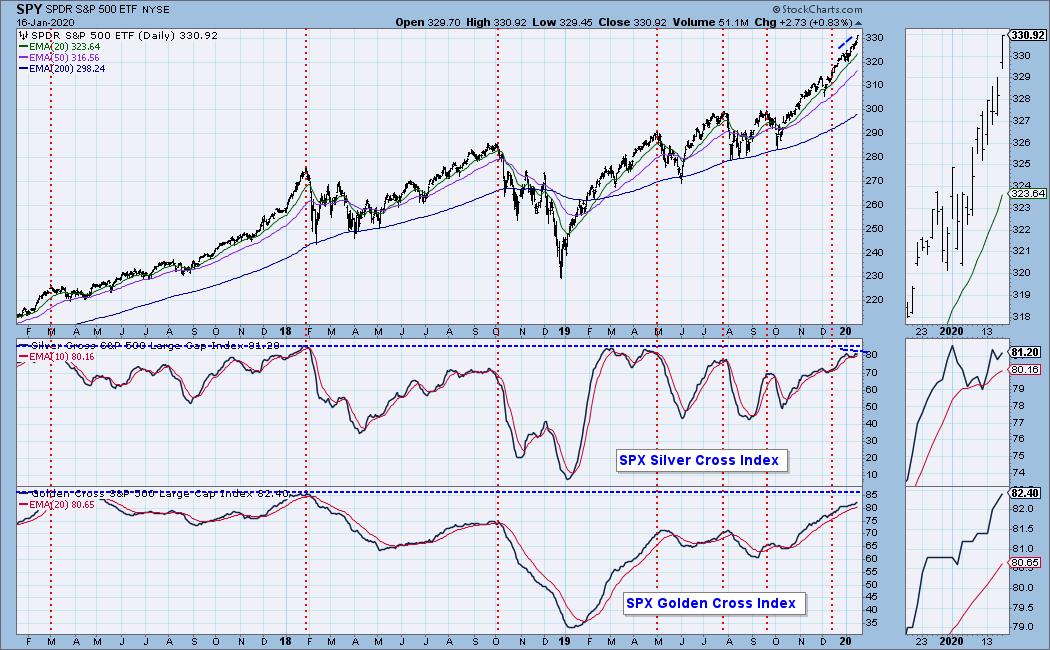
Market Environment: It is important to consider the odds for success. The Silver Cross Index measures the percentage of stocks on IT Trend Model BUY signals (20-EMA > 50-EMA), while the Golden Cross Index measures the percentage of stocks on LT Trend Model BUY signals (50-EMA > 200-EMA). Don't forget that as a "Diamonds" member, you have access to our GCI/SCI curated ChartList on DecisionPoint.com. You'll find it under "Members Only" links on the left side on the Blogs and Links Page. Here are the current percentages on the Silver and Golden Cross Indexes:
Diamond Index:
- Diamond Scan Results: 20
- Diamond Dog Scan Results: 7
- Diamond Bull/Bear Ratio: 2.86
Full Disclosure: I do not own any of the stocks above but I've added them to my watch list. I'm currently 35% in cash but will be looking for more investment opportunities depending on next week's action. It seems we should see a pullback very soon and that would be the best time to add positions.

Erin Swenlin will be presenting at the The MoneyShow Las Vegas on May 11-13, 2020! You'll have an opportunity to meet Erin and discuss the latest DecisionPoint news and Diamond Scans. The conference is free to attend or view online!
Watch the latest episode of DecisionPoint with Carl & Erin Swenlin LIVE on Mondays 5:00p EST or on the StockCharts TV YouTube channel here!
Technical Analysis is a windsock, not a crystal ball.
Happy Charting!
- Erin
erinh@stockcharts.com
NOTE: The stocks reported herein are from mechanical trading model scans that are based upon moving average relationships, momentum and volume. DecisionPoint analysis is then applied to get five selections from the scans. The selections given should prompt readers to do a chart review using their own analysis process. This letter is not a call for a specific action to buy, sell or short any of the stocks provided. There are NO sure things or guaranteed returns on the daily selection of "diamonds in the rough."
Helpful DecisionPoint Links:
DecisionPoint Shared ChartList and DecisionPoint Chart Gallery
Price Momentum Oscillator (PMO)
Swenlin Trading Oscillators (STO-B and STO-V)
**Don't miss DecisionPoint Commentary! Add your email below to be notified of new updates"**f