
I noticed today that results from my Diamond Scan and Diamond Dog Scan have contracted by about half. I'm still trying to decipher what these readings mean, but on the surface I would say that the market is going into a holding pattern given there aren't many with exceptional positive momentum, but on the other hand there aren't that many losing ground quickly. Today was the first time in over week where I had more Diamond Scan results than Diamond Dog Scan results. I look at that as positive, but seeing the halving of Diamond Scan results takes some of the wind out of the sails.
Don't forget, on Thursdays I look at reader-requested symbols, so shoot me an email at erin@decisionpoint.com. I read every email I receive and try to answer them all!
Welcome to DecisionPoint Daily Diamonds, wherein I highlight five "diamonds in the rough." These are selected from the results of my DecisionPoint scans, which search for stocks that could benefit from the trend and condition of the market. Remember, these are not recommendations to buy or sell, but are the most interesting of the stocks that surfaced in my scans. My objective is to save you the work of the initial, tedious culling process, but you need to apply your own analysis to see if these stocks pique your interest as well. There are no guaranteed winners here!
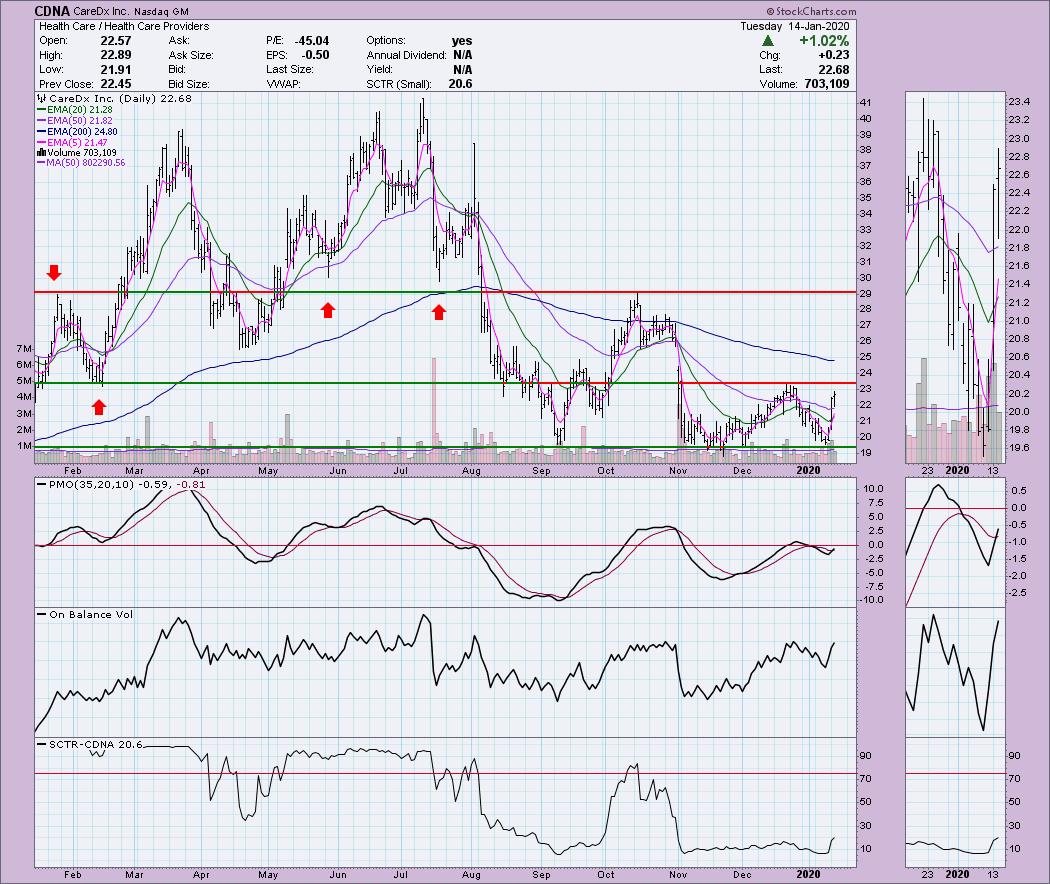
CareDx Inc (CDNA) - Earnings: 10/31/2019
Right now CDNA is at the top of a trading range, so that is my first caveat on this one. However, I am expecting to see it breakout from here. The PMO has triggered a BUY signal on rising bottoms, and OBV is pushing upward. We even see some action on the SCTR to the upside. I would add this to a watch list as I don't think this diamond is quite ready for polishing.
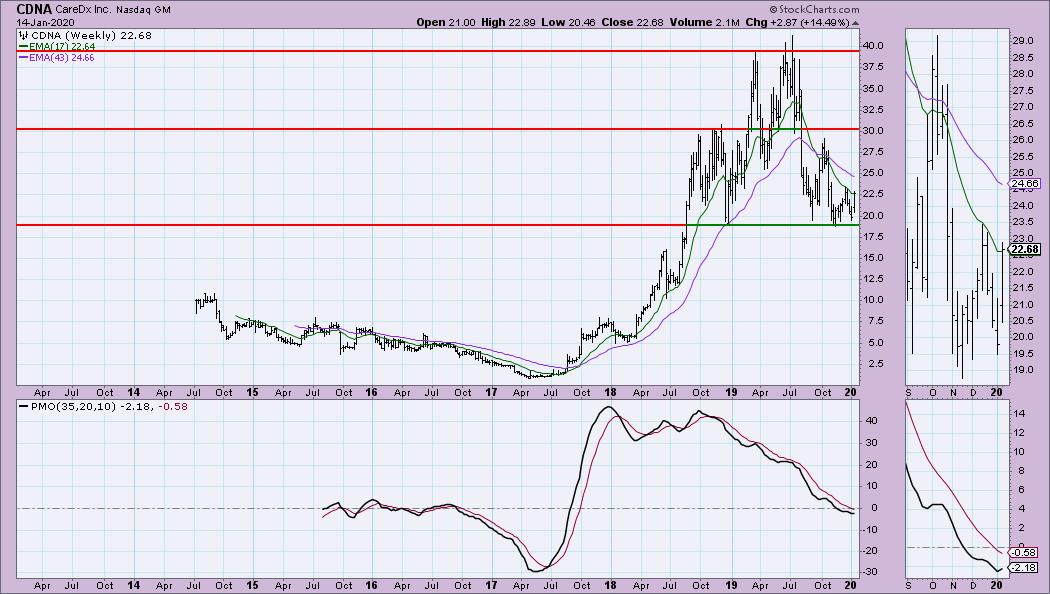
The PMO on the weekly chart is turning up. We can see that the $20 area is strong support and likely the best place to put a stop in if you decided to hop on. It appeared to be forming a double-bottom, but recent market action isn't confirming that pattern in my estimation.
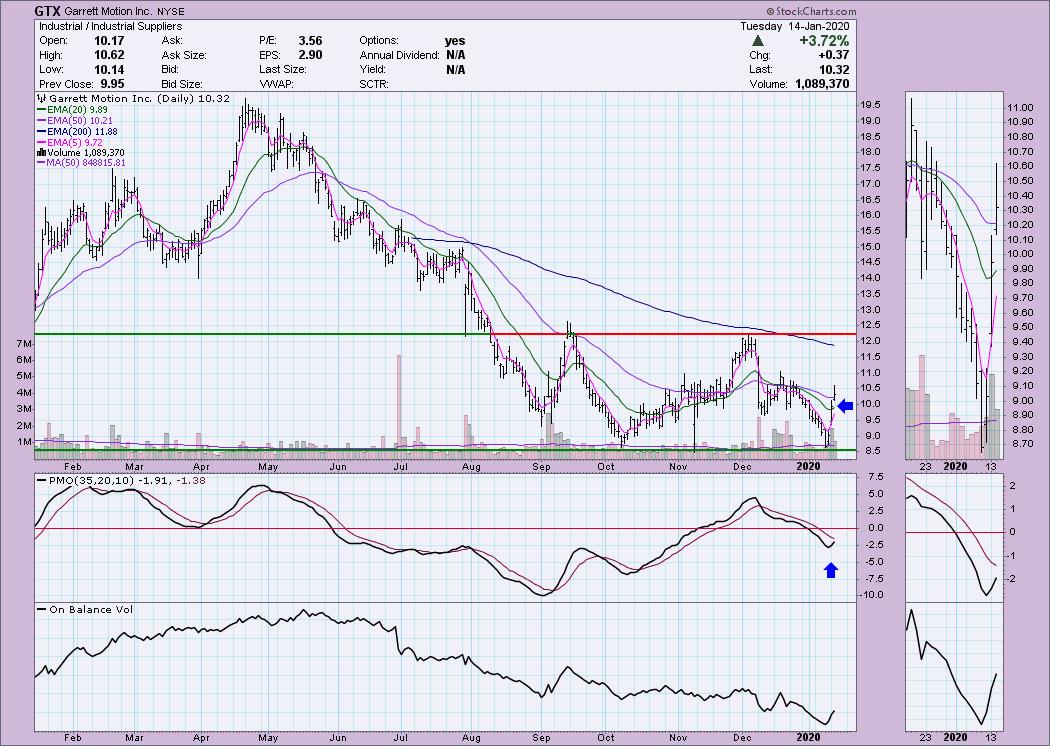
Garrett Motion Inc (GTX) - Earnings: 11/8/2019
This one is in the middle of a trading range. It broke above the 20-EMA yesterday and it continued to rally today. I would look for a pullback before entering, but that's my style. The PMO is moving strongly higher. The OBV isn't the best, but it is rising quickly. I prefer not to see declining bottoms on the OBV, but the most recent price action is being support by a shot of volume.
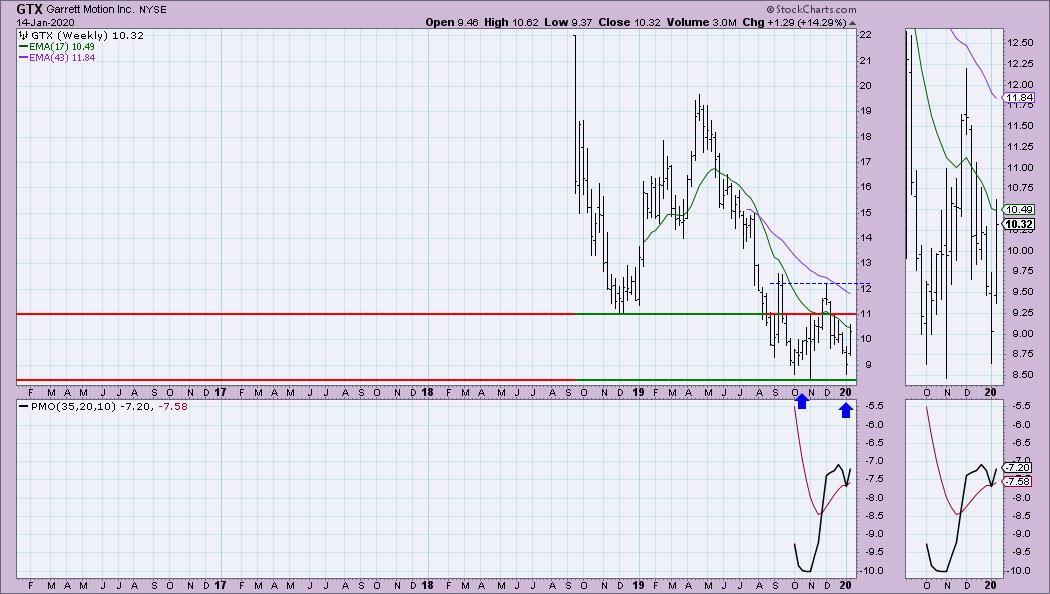
A double-bottom is very clear on the weekly chart. The PMO has completely reversed its direction. We do see the importance of overhead resistance at $11. That will be the sticking point, but if it gets above, I think this one will ride higher.
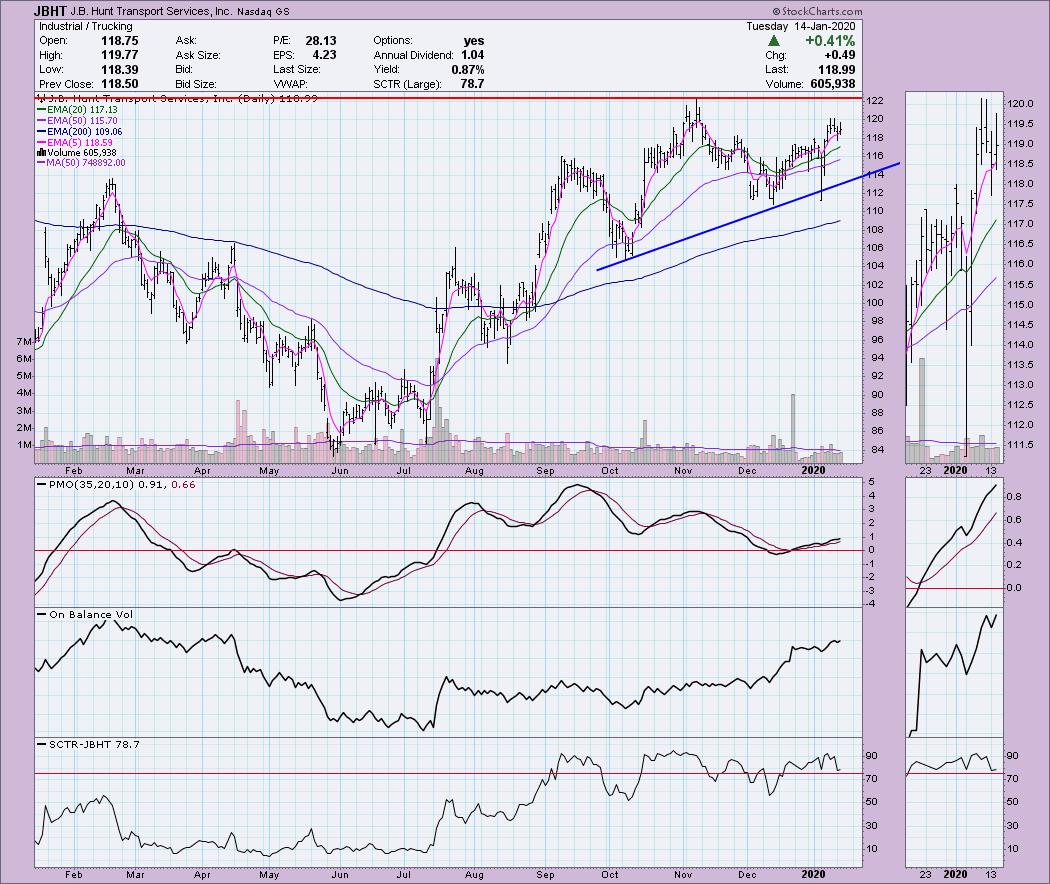
J.B. Hunt Transport Services Inc (JBHT) - Earnings: 1/17/2020
JBHT nearly broke a rising trend but managed to reverse it quickly. This meant that support at the December low held. The PMO had already alerted us that good things were expected to continue and despite the hiccup, the PMO was able to turn back up forming a bottom above the signal line which I typically find especially bullish. The OBV is confirming the move up with rising bottoms. The SCTR is healthy and has been since the December low.
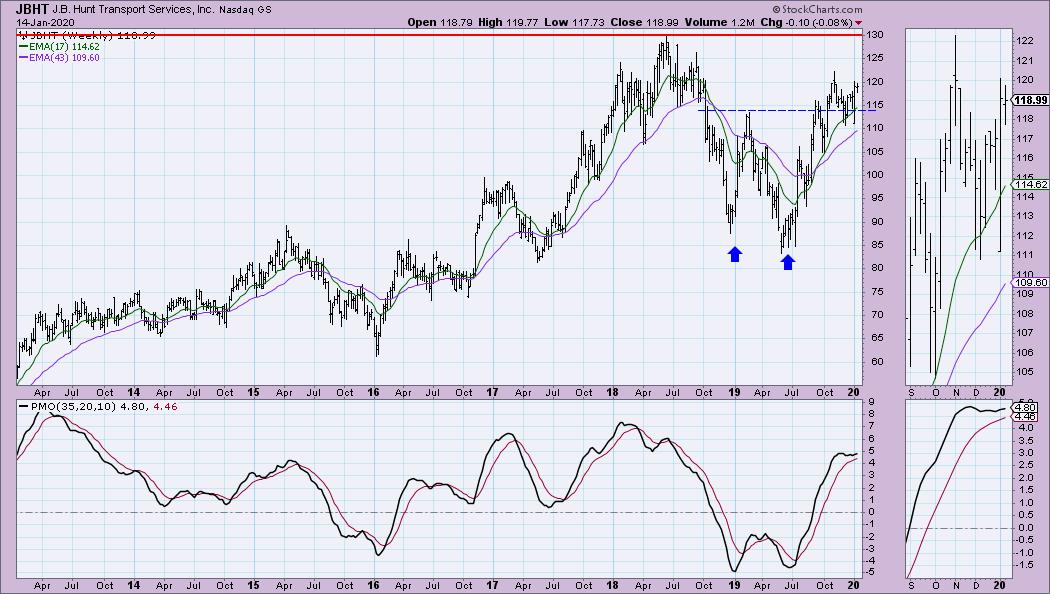
There is a large double-bottom pattern which has executed on the weekly chart. The PMO has managed to turn itself before logging a SELL signal and it is not overbought.
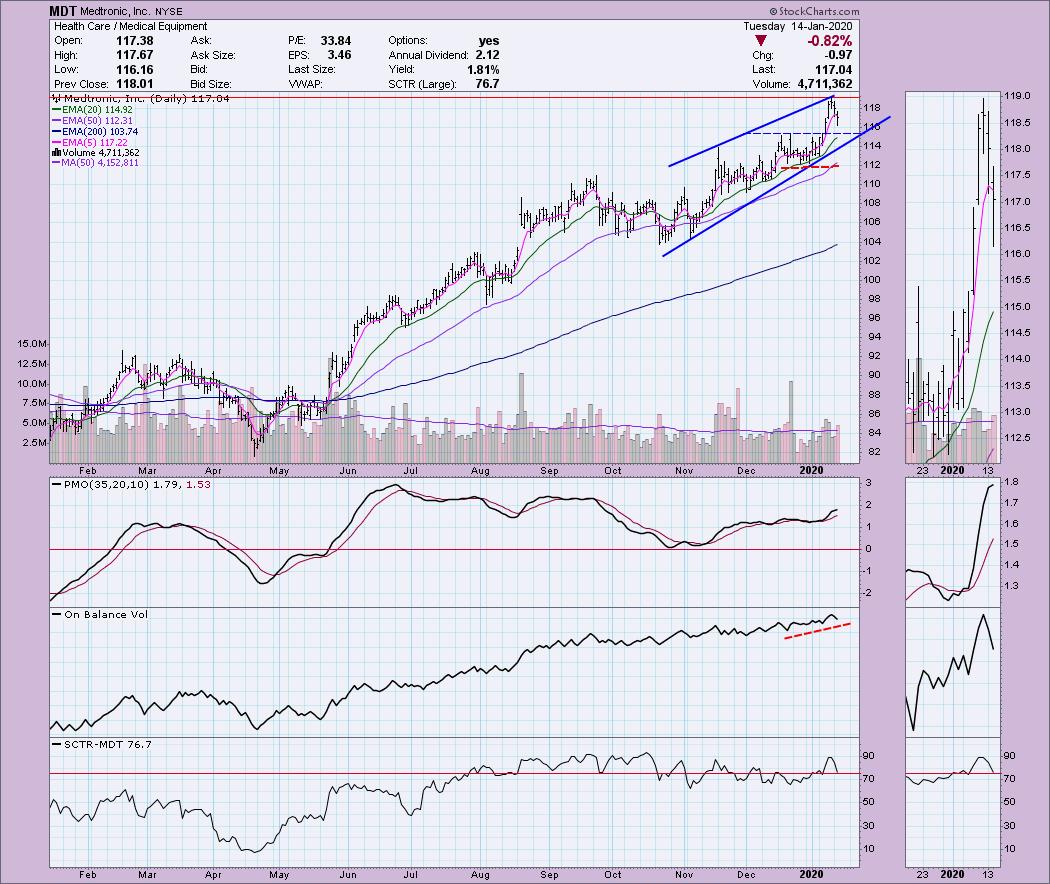
Medtronic Inc (MDT) - Earnings: 2/18/2020
Yes, there is a rising wedge here, but I'm okay with it. I think it helps us define support and an area for a stop around $112. MDT has pulled back the last two days, but I am looking for it to turn back up. The PMO did decelerate, but that is expected on two days of decline. In fact, with the depth of these two declines, I'm actually quite impressed it didn't turn down. I think that is indicative of a momentum sleeper. OBV lows are rising and are confirming the overall rising trend.
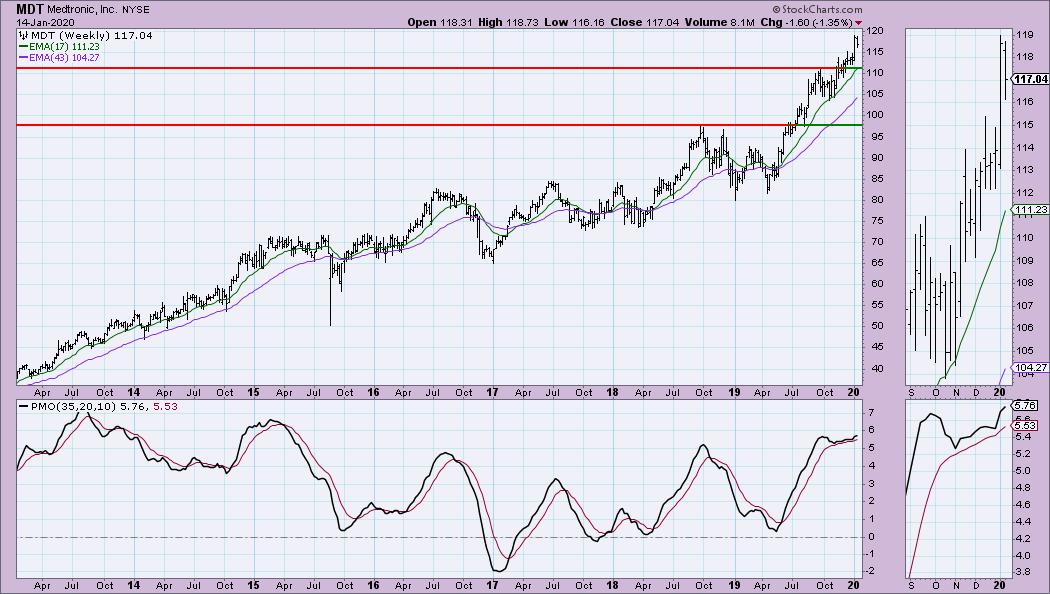
I like the look of the weekly PMO as it shows rising bottoms and a successful fight against generating a SELL signal. Based on the last four years, the PMO is on the overbought side, but we have seen higher readings which tells me it can move upward along with price before reaching overbought extremes.
Mobile Mini Inc (MINI) - Earnings: 1/28/2020
In all honesty, this is probably my favorite 'diamond' of the day. The only thing I don't like is that the gain is so high today and I hate to chase, but this one may require that. The rising trend is good and even if you draw a declining tops trendline from October top to December top, it forms a symmetrical triangle which has activated with an upside breakout. The OBV has steeply rising bottoms while price lows were relatively flat. That is close to a positive divergence. The SCTR has been on the healthy side for months.
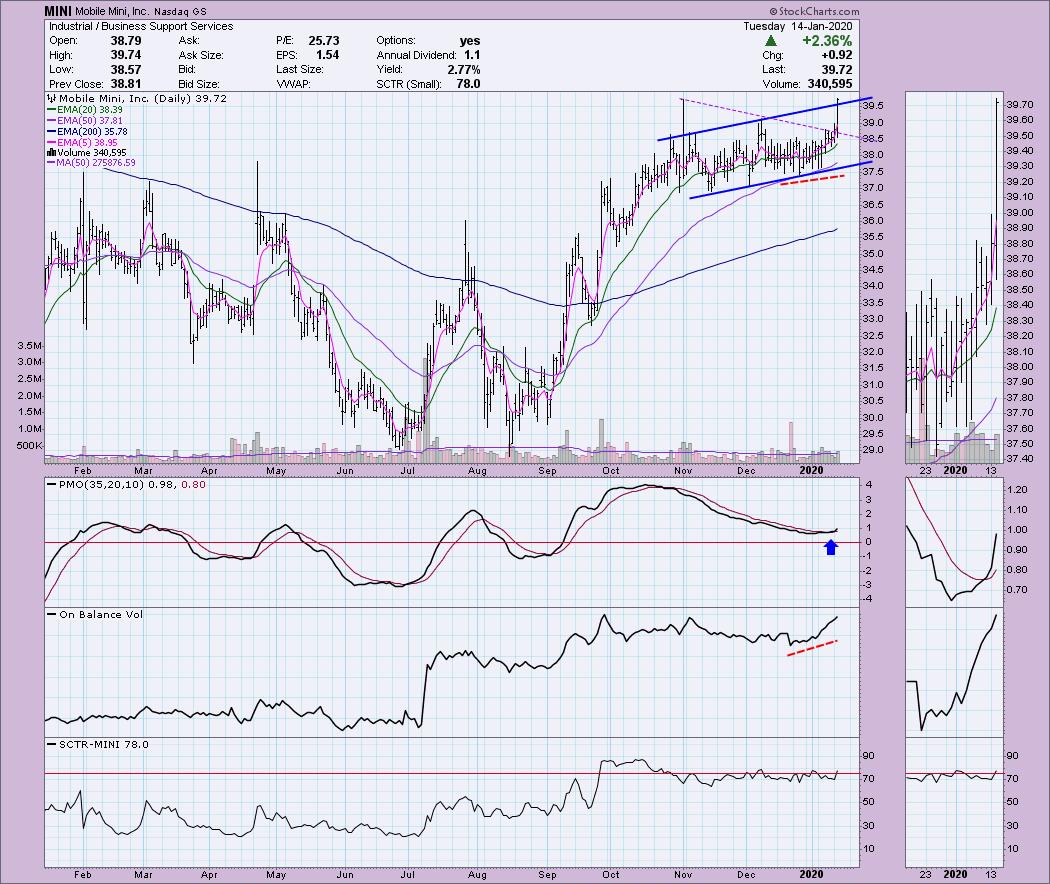
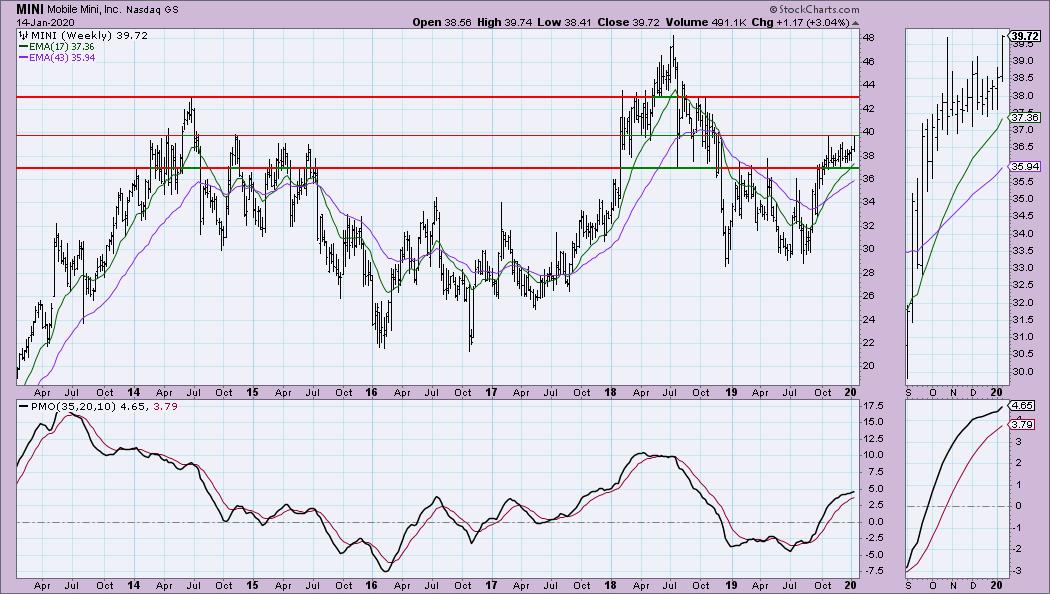
I really want to see price break above $40. That matches up with the tops from 2014 and 2015 and is short-term resistance as well on the daily chart. The PMO has begun to accelerate higher. This one was added to my watchlist.
Current Market Outlook:
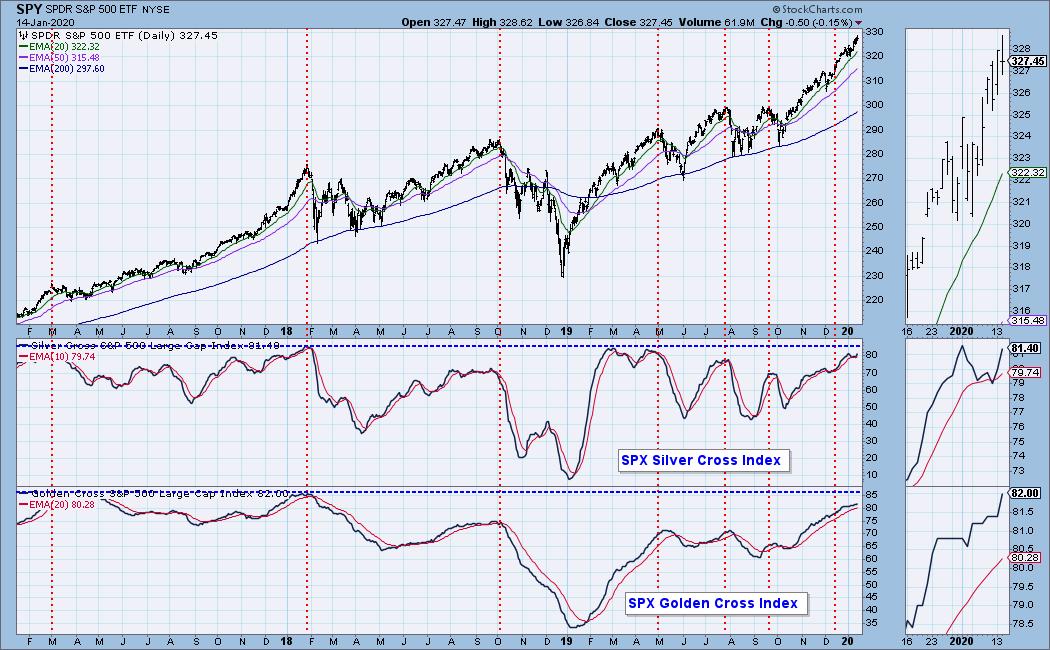
Market Environment: It is important to consider the odds for success. The Silver Cross Index measures the percentage of stocks on IT Trend Model BUY signals (20-EMA > 50-EMA), while the Golden Cross Index measures the percentage of stocks on LT Trend Model BUY signals (50-EMA > 200-EMA). Don't forget that as a "Diamonds" member, you have access to our GCI/SCI curated ChartList on DecisionPoint.com. You'll find it under "Members Only" links on the left side. Here are the current percentages on the Silver and Golden Cross Indexes:
Diamond Index:
- Diamond Scan Results: 7
- Diamond Dog Scan Results: 6
- Diamond Bull/Bear Ratio: 1.17
Full Disclosure: I did keep PTCT as it made a nice recovery today. I'm happy with the stop and hope to see it break the way my analysis suggests it will. I do not own any of the stocks above. I'm currently 35% in cash.

Erin Swenlin will be presenting at the The MoneyShow Las Vegas on May 11-13, 2020! You'll have an opportunity to meet Erin and discuss the latest DecisionPoint news and Diamond Scans. The conference is free to attend or view online!
Watch the latest episode of DecisionPoint with Carl & Erin Swenlin LIVE on Mondays 5:00p EST or on the StockCharts TV YouTube channel here!
Technical Analysis is a windsock, not a crystal ball.
Happy Charting!
- Erin
erinh@stockcharts.com
NOTE: The stocks reported herein are from mechanical trading model scans that are based upon moving average relationships, momentum and volume. DecisionPoint analysis is then applied to get five selections from the scans. The selections given should prompt readers to do a chart review using their own analysis process. This letter is not a call for a specific action to buy, sell or short any of the stocks provided. There are NO sure things or guaranteed returns on the daily selection of "diamonds in the rough."
Helpful DecisionPoint Links:
DecisionPoint Shared ChartList and DecisionPoint Chart Gallery
Price Momentum Oscillator (PMO)
Swenlin Trading Oscillators (STO-B and STO-V)
**Don't miss DecisionPoint Commentary! Add your email below to be notified of new updates"**f