
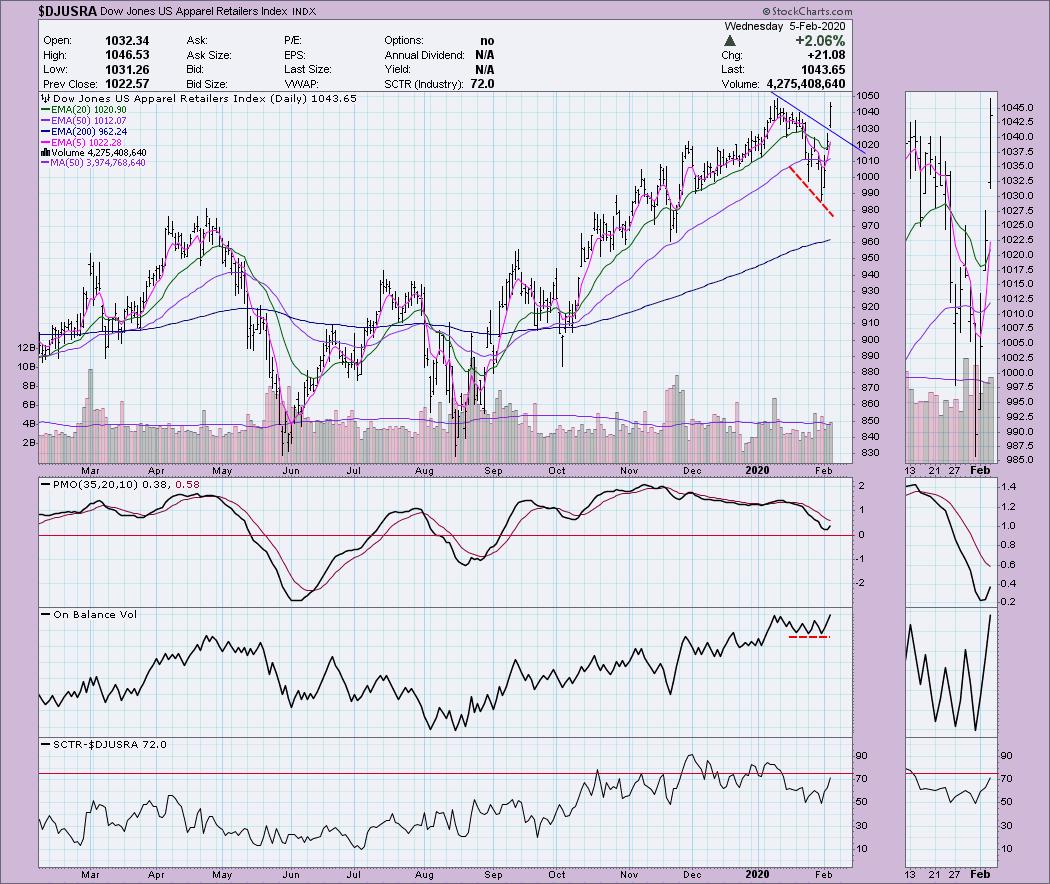
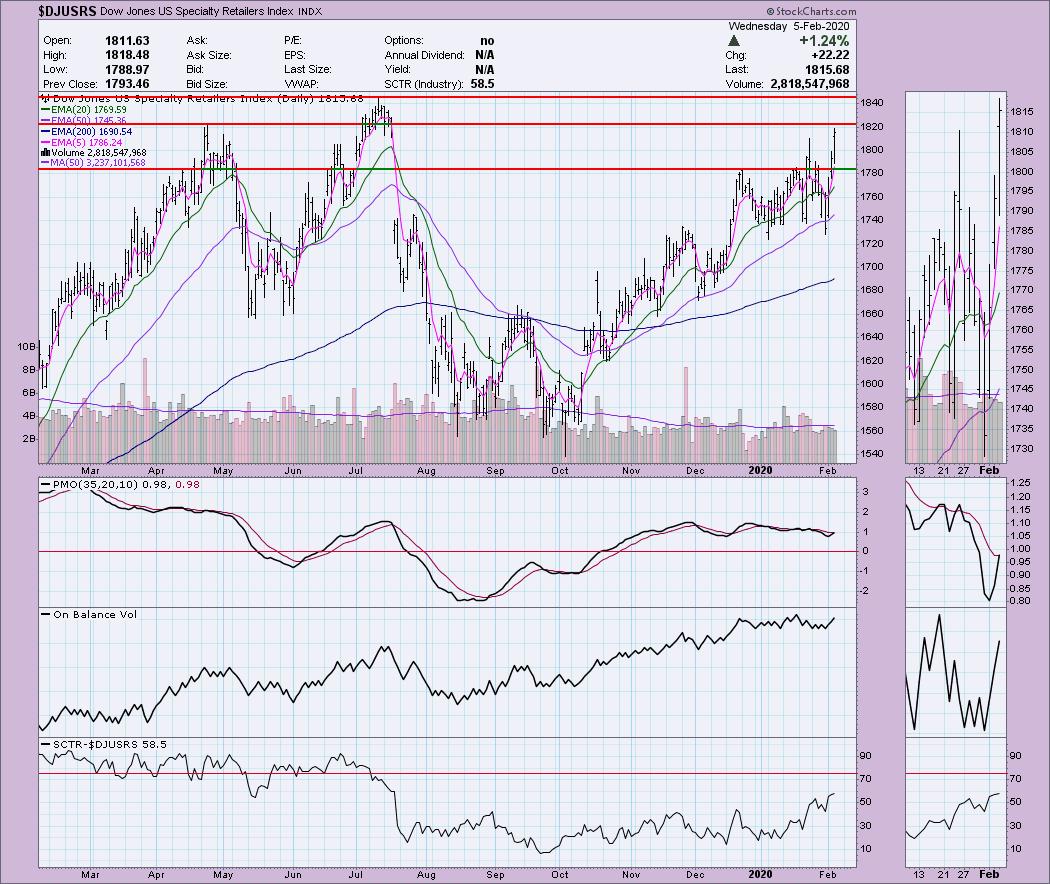
I noticed quite a few retailers hitting my scan results today so I decided to look at the industry group charts of the two Diamonds I selected, apparel retailers and specialty retailers. The charts were somewhat surprising. I think my biggest problem with both of those industry groups is they are very near overhead resistance. There are some positive characteristics with near positive divergence on $DJUSRA and rising SCTR and PMO on $DJUSRS.
Don't forget I'm taking your symbol requests for Thursday's Diamond Report! There are some interesting ones so far, but I'd love more. Just send them to erin@decisionpoint.com.
Welcome to DecisionPoint Daily Diamonds, wherein I highlight five "diamonds in the rough." These are selected from the results of my DecisionPoint scans, which search for stocks that could benefit from the trend and condition of the market. Remember, these are not recommendations to buy or sell, but are the most interesting of the stocks that surfaced in my scans. My objective is to save you the work of the initial, tedious culling process, but you need to apply your own analysis to see if these stocks pique your interest as well. There are no guaranteed winners here!
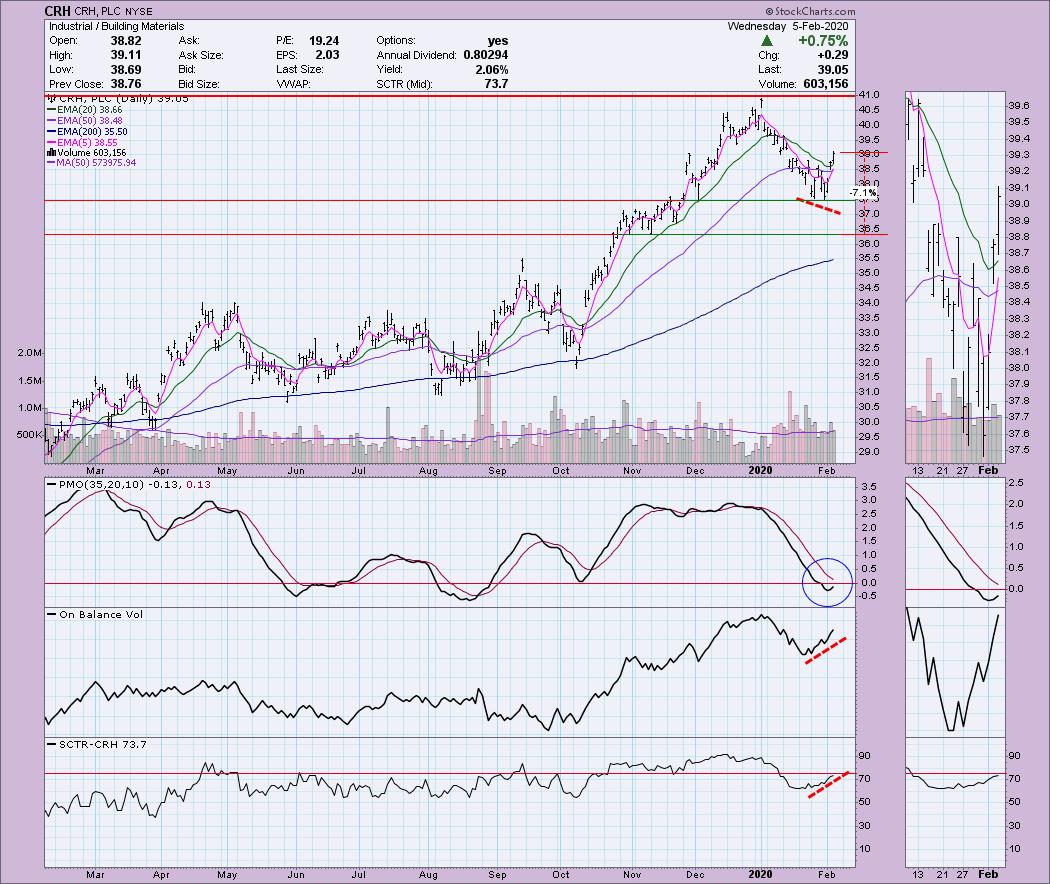
CRH, PLC (CRH) - Earnings: 2/28/2020 (BMO)
I've decided that I will start adding a percentage stop on the daily charts. It will give you a 'stop zone' that you can use when you determine where your risk tolerance is. There is a nice positive divergence with the OBV and the PMO has turned up. I think you can also make a case for a short-term bullish double-bottom. The SCTR is also making a move to the upside.
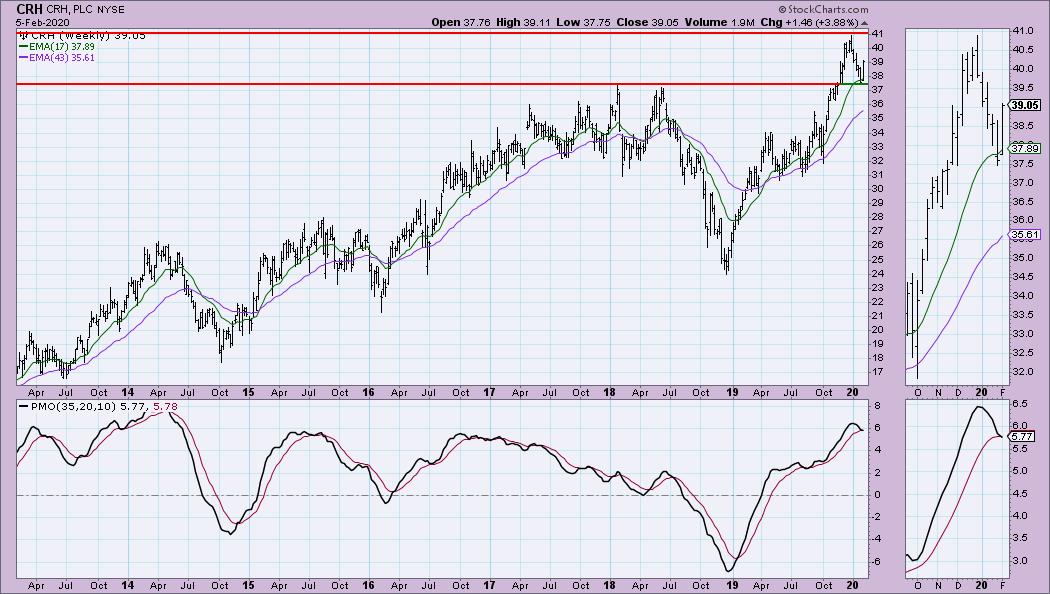
Yes, this isn't the best looking weekly PMO but I do like the bounce off support at the 2018 tops. The PMO could certainly shift gears and move to the upside, but this is a good caution flag and helps with stop setting likely just below that support level.
Don't forget, on Thursdays I look at reader-requested symbols, so shoot me an email at erin@decisionpoint.com. I read every email I receive and try to answer them all!
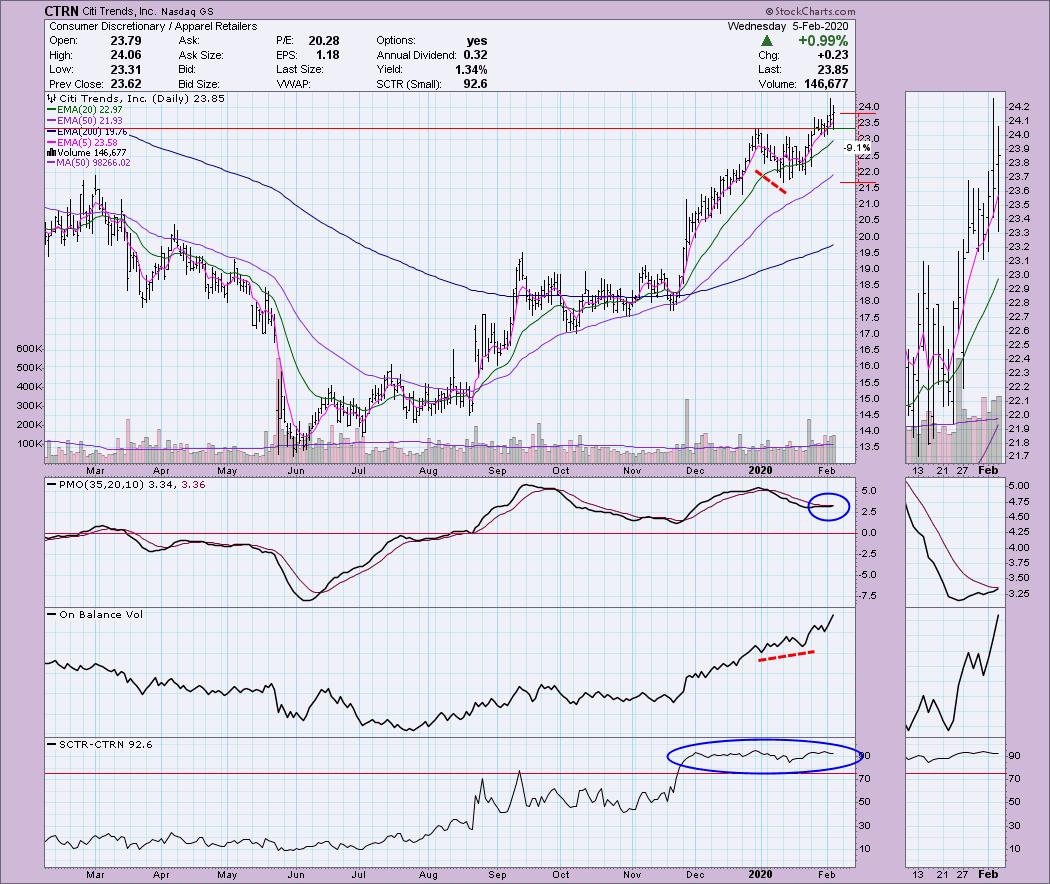
Citi Trends Inc (CTRN) - Earnings: 3/13/2020 (BMO)
Here is the first of two retailers I have for you today. I thought it interesting to show you a positive divergence with the OBV from earlier this year. It resolved as expected to the upside. The PMO is nearing a BUY signal. If you don't want to use support at $23.25 as a stop, I have marked the percentage down to the next support level. The SCTR looks great.
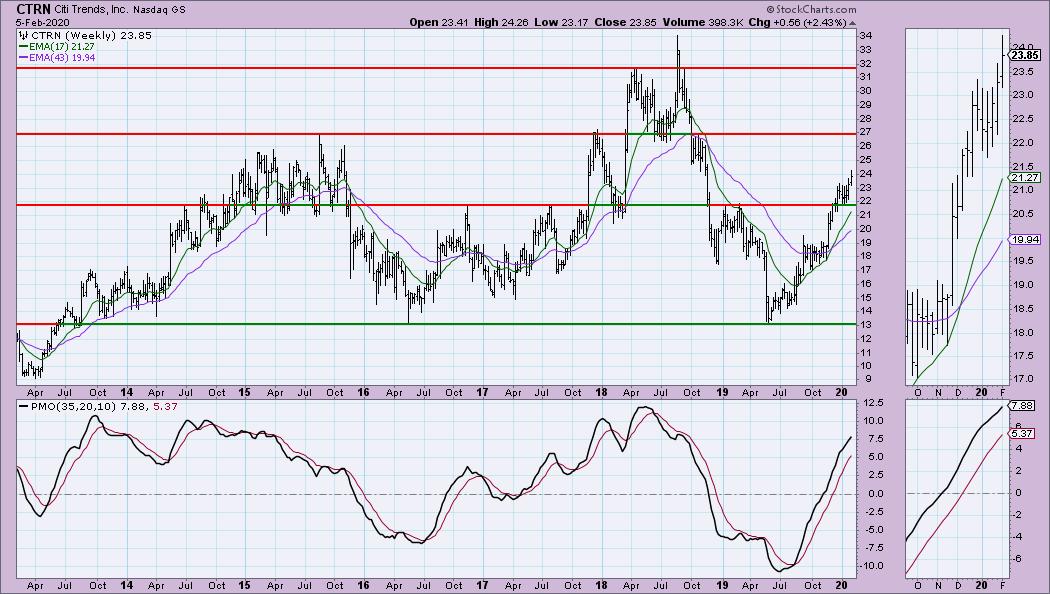
Better weekly chart here. The PMO is getting overbought, but there is room to move higher. Upside target here would be $27.
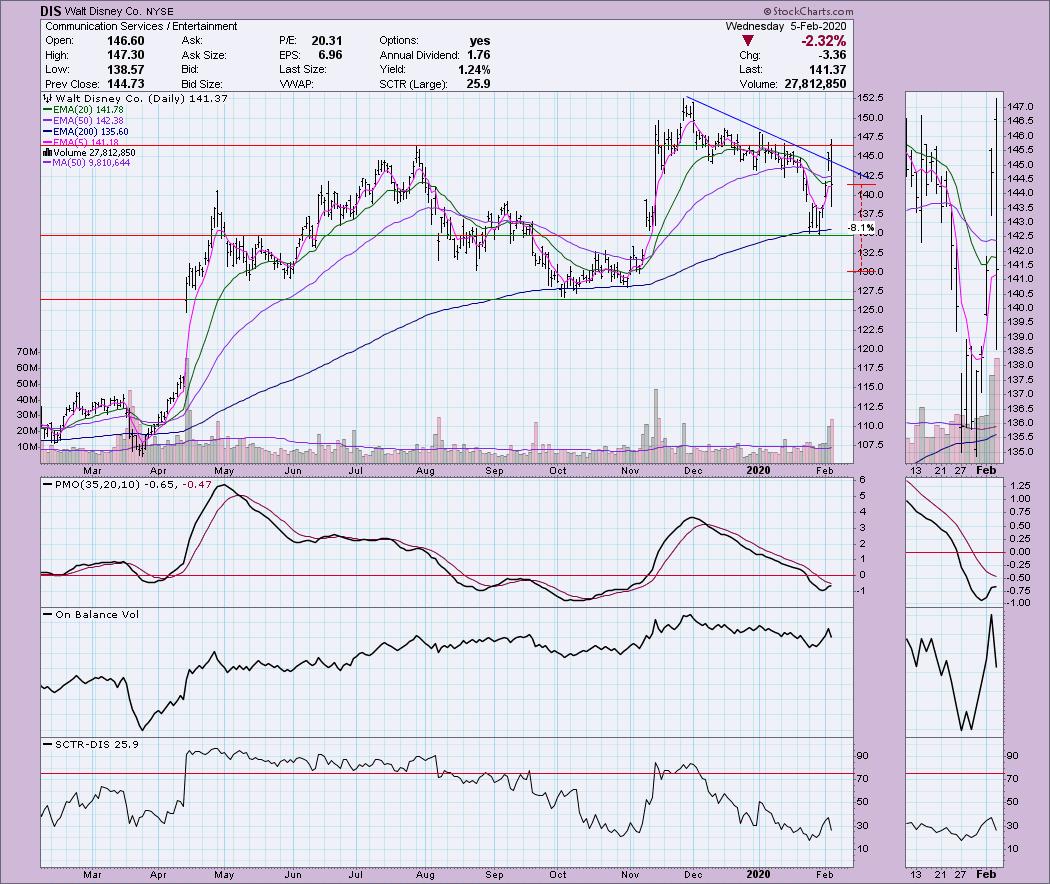
Walt Disney Co (DIS) - Earnings: 5/6/2020 (AMC)
This one came up on Carl's Scan and being a 'big name' large-cap stock, I decided to include it, although it normally wouldn't have made the grade. DIS broke out yesterday but couldn't close above the declining tops trendline. Today it failed to close above that area as well. The PMO is flattening which isn't great, but it isn't moving lower. I do like that both the gaps formed this past week were closed today and price is at an attractive level.
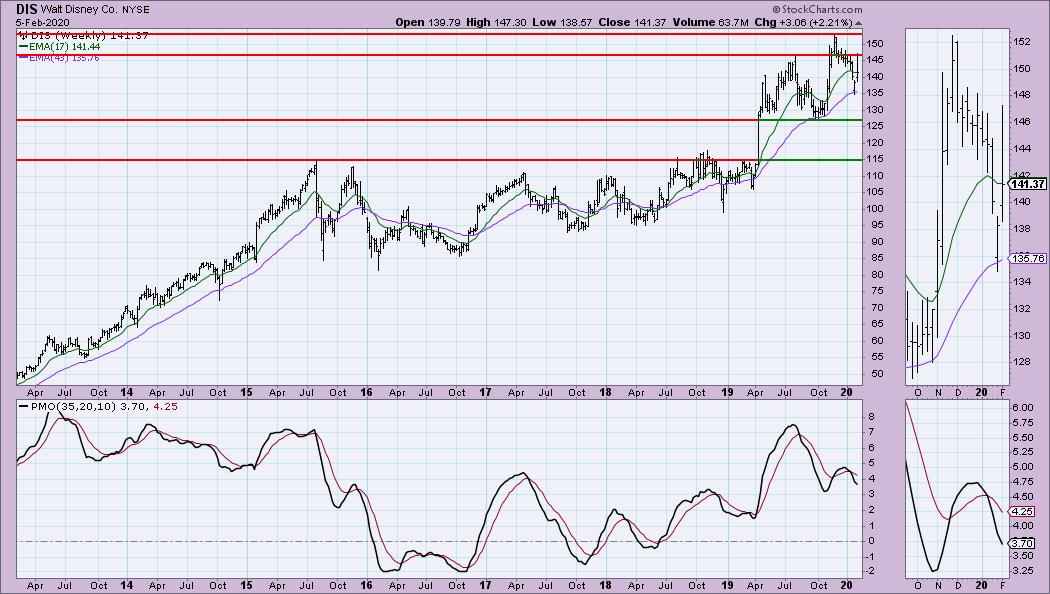
With this stock being beat down (part of the issue with Carl's Scan), the weekly chart doesn't look great. I think this could be a good one to ride back to its previous highs, but one I would want to 'babysit' given some of the weaknesses on these charts.
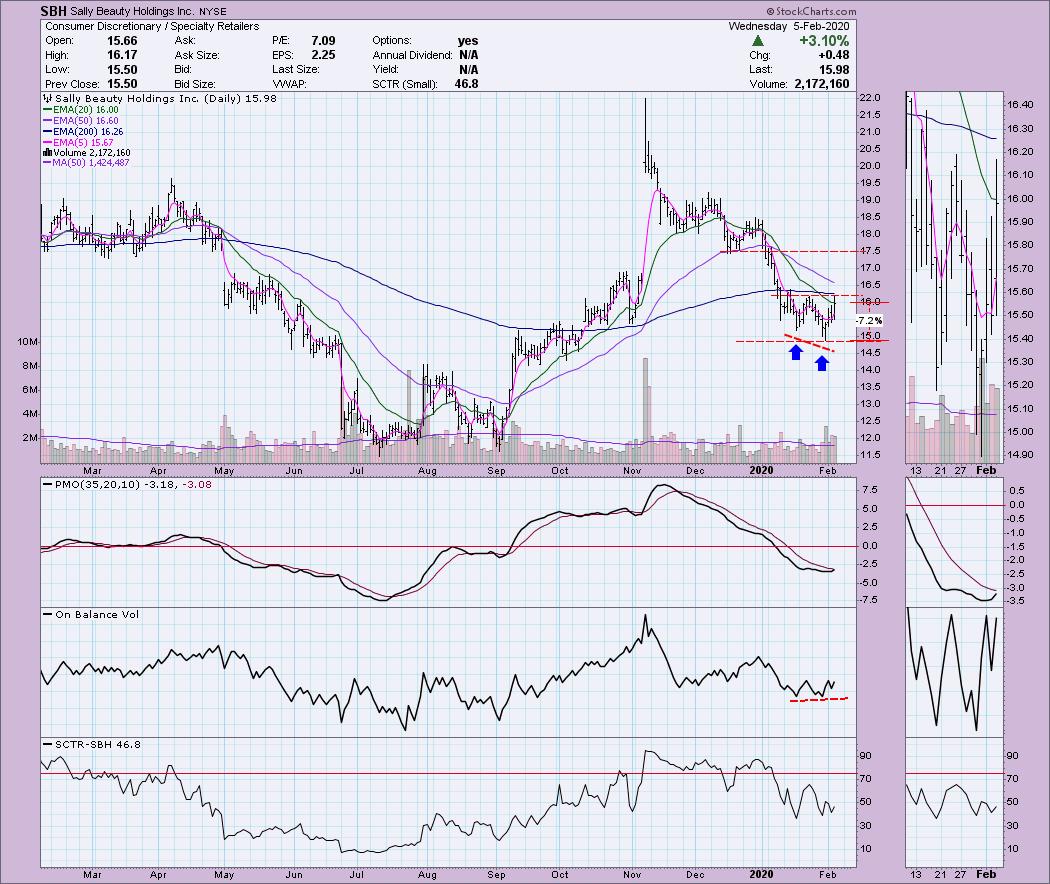
Sally Beauty Holdings Inc (SBH) - Earnings: 2/6/2020 (BMO)
Here's the final retailer. I like this chart. Not only do we have a positive divergence with the OBV, I see a bullish double-bottom. The pattern hasn't executed yet, but if it does, the minimum upside target would be right at $17.50 which lines up with the December bottom. The PMO is rising nicely in oversold territory. The SCTR isn't much to write home about, but I'll forgive it given the positive divergence and chart pattern.
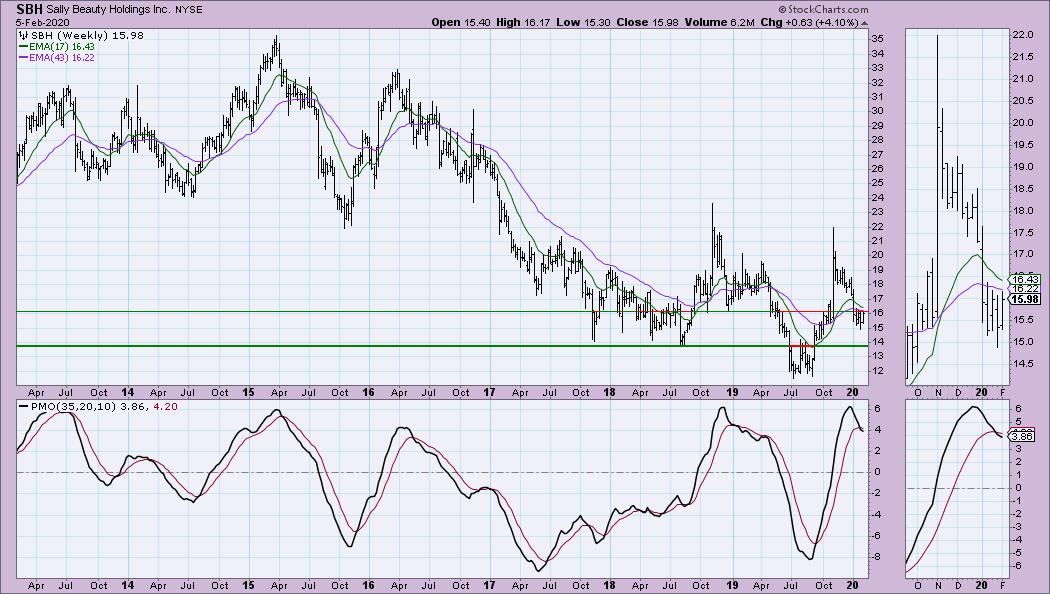
The weekly chart shows an overbought PMO on a SELL signal. Not great, but the PMO is already beginning to decelerate. $16.50 is the area to watch. If price can pop above, there is lots of room to the upside before reaching overhead resistance at $22.
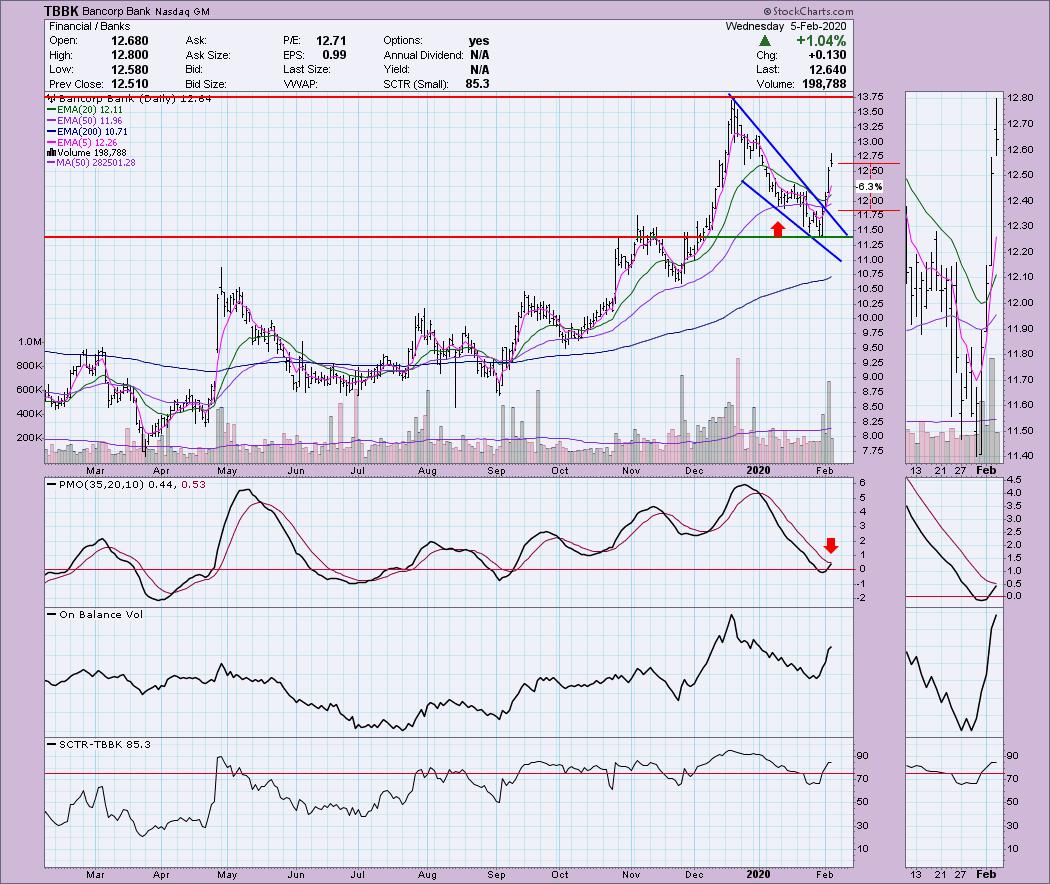
Bancorp Bank (TBBK) - Earnings: 4/23/2020 (AMC)
Here we have a bullish falling wedge that executed on Monday. The PMO is about ready to give us a BUY signal. I don't like vertical rallies, so I would probably wait for a pullback toward the breakout point. The OBV is confirming the rally and the SCTR looks pretty good.
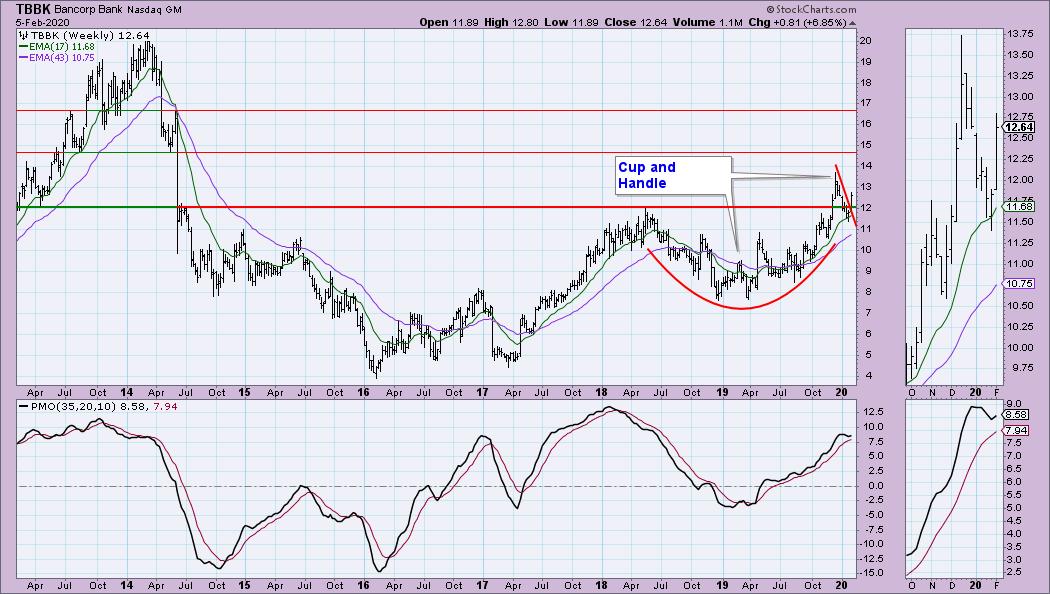
I've been seeing a lot of cup and handle formations lately, yet I haven't really seen any of them resolve the way they should. In any case, this looks like a textbook cup and handle pattern. The PMO is not overbought and it has turned up above the signal line which is quite positive.
Again, don't forget to send me your symbol requests for Thursday!
Current Market Outlook:
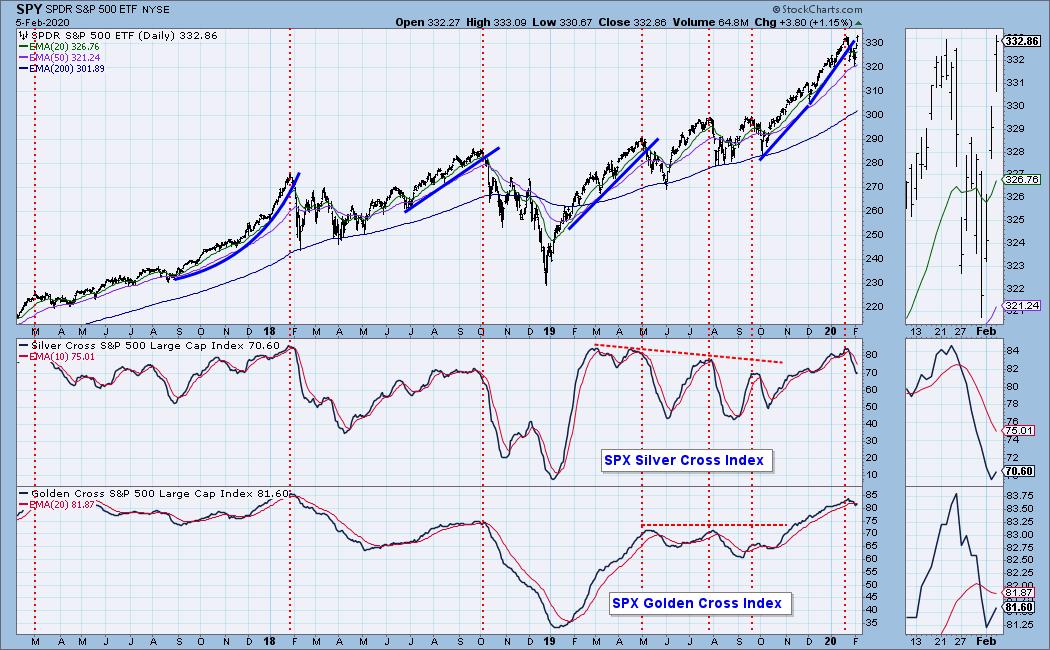
Market Environment: It is important to consider the odds for success. The Silver Cross Index measures the percentage of stocks on IT Trend Model BUY signals (20-EMA > 50-EMA), while the Golden Cross Index measures the percentage of stocks on LT Trend Model BUY signals (50-EMA > 200-EMA). Don't forget that as a "Diamonds" member, you have access to our GCI/SCI curated ChartList on DecisionPoint.com. You'll find it under "Members Only" links on the left side on the Blogs and Links Page. Here are the current percentages on the Silver and Golden Cross Indexes:
Diamond Index:
- Diamond Scan Results: 12
- Diamond Dog Scan Results: 1
- Diamond Bull/Bear Ratio: 12.0
For a more comprehensive review of current market conditions as well as analysis of Dollar, Gold, Oil and Bonds, subscribe to the DecisionPoint Alert! For a LIMITED TIME you can get a coupon code that will give you a discount for bundling your Diamonds subscription with the DecisionPoint Alert! Contact support@decisionpoint.com for more details.
Full Disclosure: I do not own any of the stocks above. I'm currently 25% in cash.

Erin Swenlin will be presenting at the The MoneyShow Las Vegas on May 11-13, 2020! You'll have an opportunity to meet Erin and discuss the latest DecisionPoint news and Diamond Scans. The conference is free to attend or view online!
Watch the latest episode of DecisionPoint with Carl & Erin Swenlin LIVE on Mondays 5:00p EST or on the StockCharts TV YouTube channel here!
Technical Analysis is a windsock, not a crystal ball.
Happy Charting!
- Erin
erinh@stockcharts.com
NOTE: The stocks reported herein are from mechanical trading model scans that are based upon moving average relationships, momentum and volume. DecisionPoint analysis is then applied to get five selections from the scans. The selections given should prompt readers to do a chart review using their own analysis process. This letter is not a call for a specific action to buy, sell or short any of the stocks provided. There are NO sure things or guaranteed returns on the daily selection of "diamonds in the rough."
Helpful DecisionPoint Links:
DecisionPoint Shared ChartList and DecisionPoint Chart Gallery
Price Momentum Oscillator (PMO)
Swenlin Trading Oscillators (STO-B and STO-V)
For more links, go to DecisionPoint.com!