
Another great rally day for the SPX! On the heels of this rally, I ended up with the most results from my "Diamond PMO Scan" since I started doing Diamonds back in September on StockCharts.com. There were 96 results of the bullish Diamond Scan and only 3 results in the Diamond Dog Scan. The market is trending higher and clearly we are getting participation. There are a few issues, but I'll address that in today's DecisionPoint Alert.
So, I am glad today was Reader Request Thursday as I was saved from having to filter through all 96 results! These five reader requests are interesting and definitely worth a gander either for investment and/or learning. Also, Sally Beauty (SBH) reported earnings before the market opened (I looked at this one yesterday) and was down 20%+ at one point. This is a great lesson in holding through earnings or investing into earnings, there is no telling whether you'll get a big move up or down regardless of the chart set-up. This is why I include earnings data in Diamond reports.
Welcome to DecisionPoint Daily Diamonds, wherein I highlight five "diamonds in the rough." These are selected from the results of my DecisionPoint scans, which search for stocks that could benefit from the trend and condition of the market. Remember, these are not recommendations to buy or sell, but are the most interesting of the stocks that surfaced in my scans. My objective is to save you the work of the initial, tedious culling process, but you need to apply your own analysis to see if these stocks pique your interest as well. There are no guaranteed winners here!
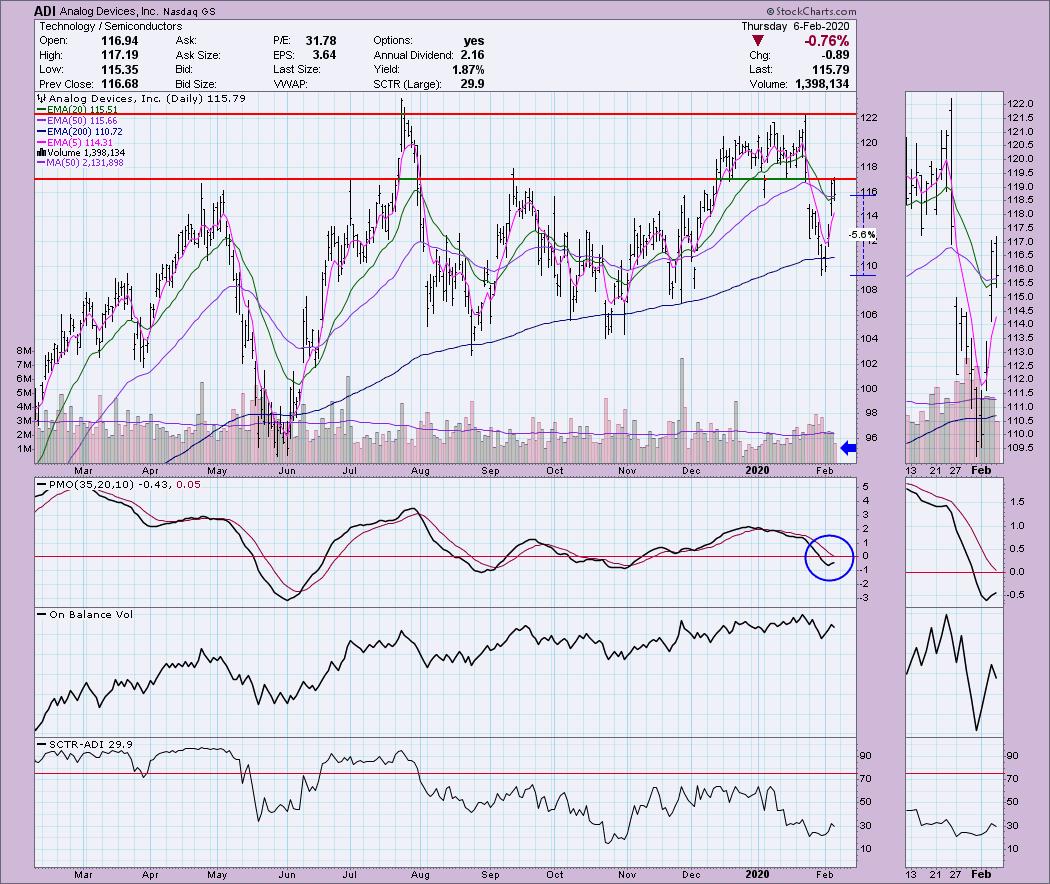
Analog Devices Inc (ADI) - Earnings: 2/19/2020 (BMO)
ADI got stuck at overhead resistance today after covering the gap down yesterday. You could consider this a breakout and hold above 20-EMA support, but clearly $117 is going to be tough resistance. There are great characteristics on this chart. One thing to note is that today's drop came on much lower volume. This tells me there is something under the surface and that investor sentiment may not be that bearish.The PMO has turned up and the SCTR is beginning to wake. The OBV could look a bit better, but I think the volume bars are the story.
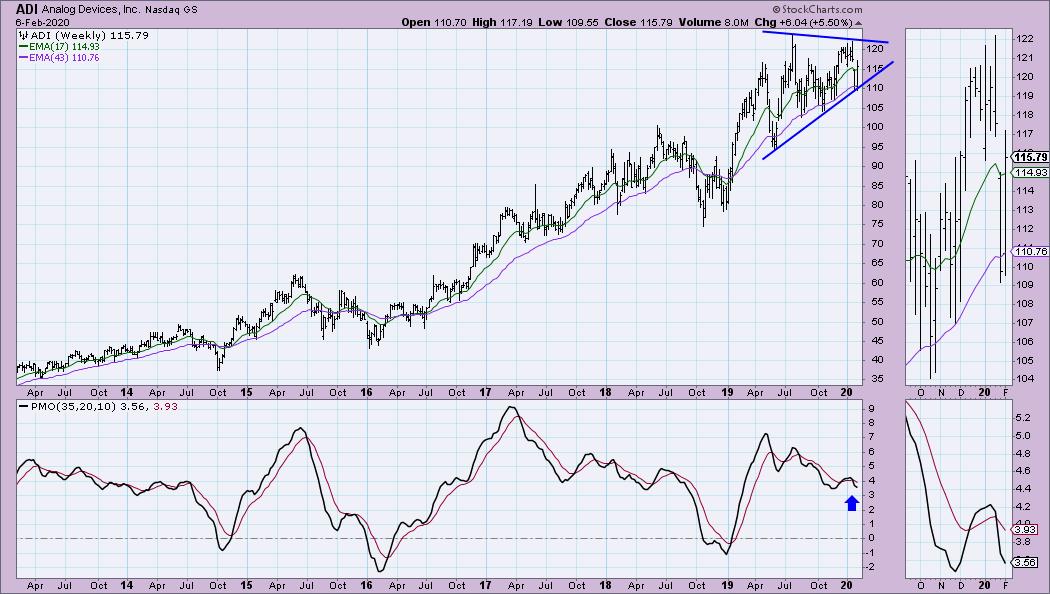
There is a large symmetrical triangle on the weekly chart. Typically these resolve as continuation patterns, continuing the trend that was in place before the triangle formed. The PMO isn't great here, but it is decelerating. I'd hold this if I owned it, but would probably wait to get in or set a 6% stop.
Don't forget, on Thursdays I look at reader-requested symbols, so shoot me an email at erin@decisionpoint.com. I read every email I receive and try to answer them all!
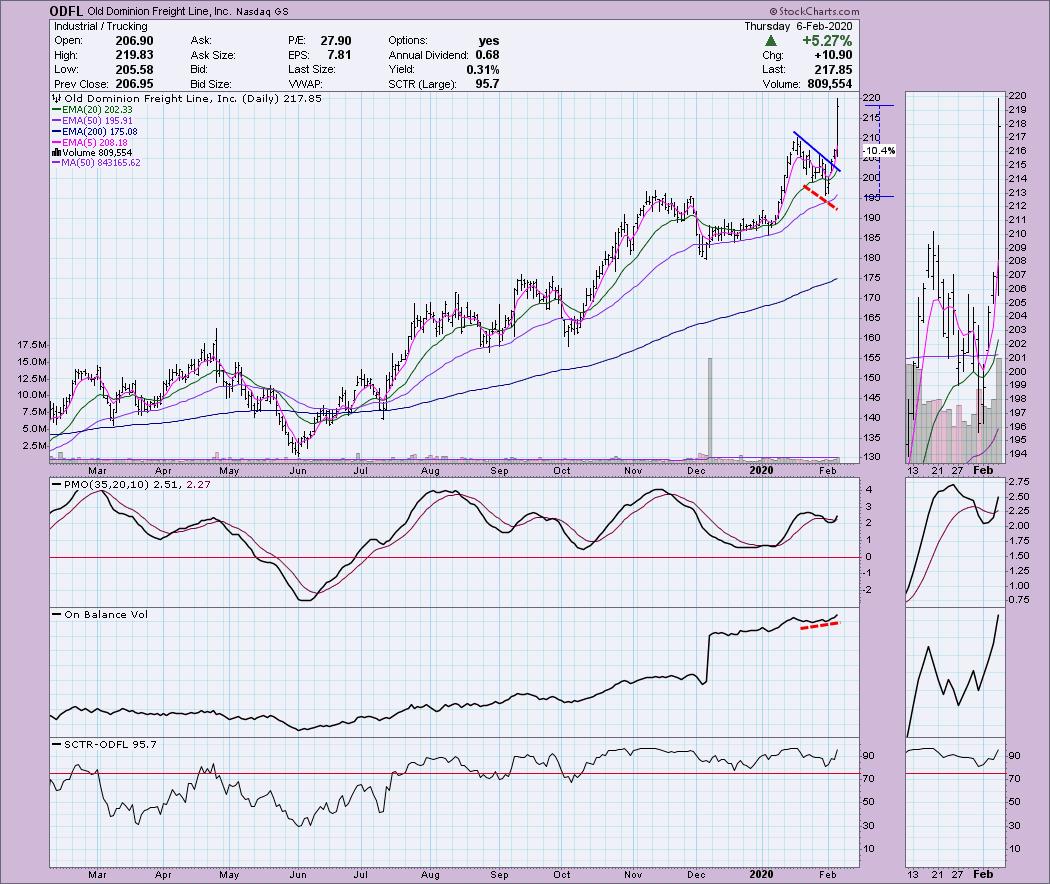
Old Dominion Freight Line Inc (ODFL) - Earnings: 2/6/2020 (BMO)
Wow, quite a move here. This one was requested before earnings hit today. It already was looking good but now it is on the overbought side and could definitely use some type of pullback. Yesterday, the declining trend was broken and we already had a nice positive divergence with the OBV. Now, we have a PMO BUY signal. The SCTR has been strong much of last year.
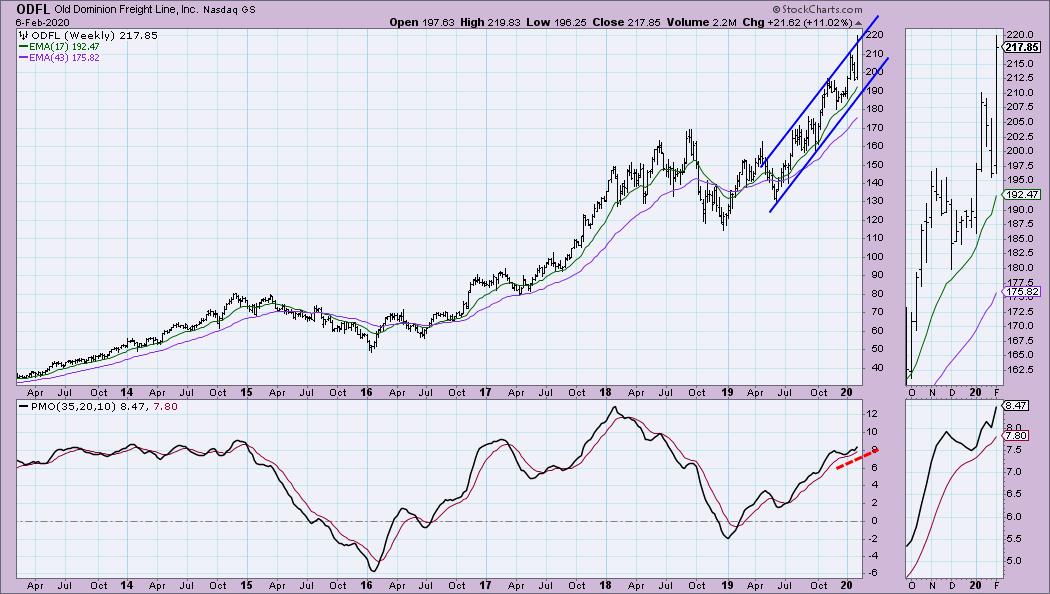
The weekly chart looks pretty good. Nice PMO rising and a rising trend channel. I think my point about it being overbought is represented well here as price popped above the rising trend channel. If it sets a new rising bottoms line that is steeper than the one here, that would make me consider a trailing stop if I was holding it. I wouldn't get in until overbought conditions subsided.
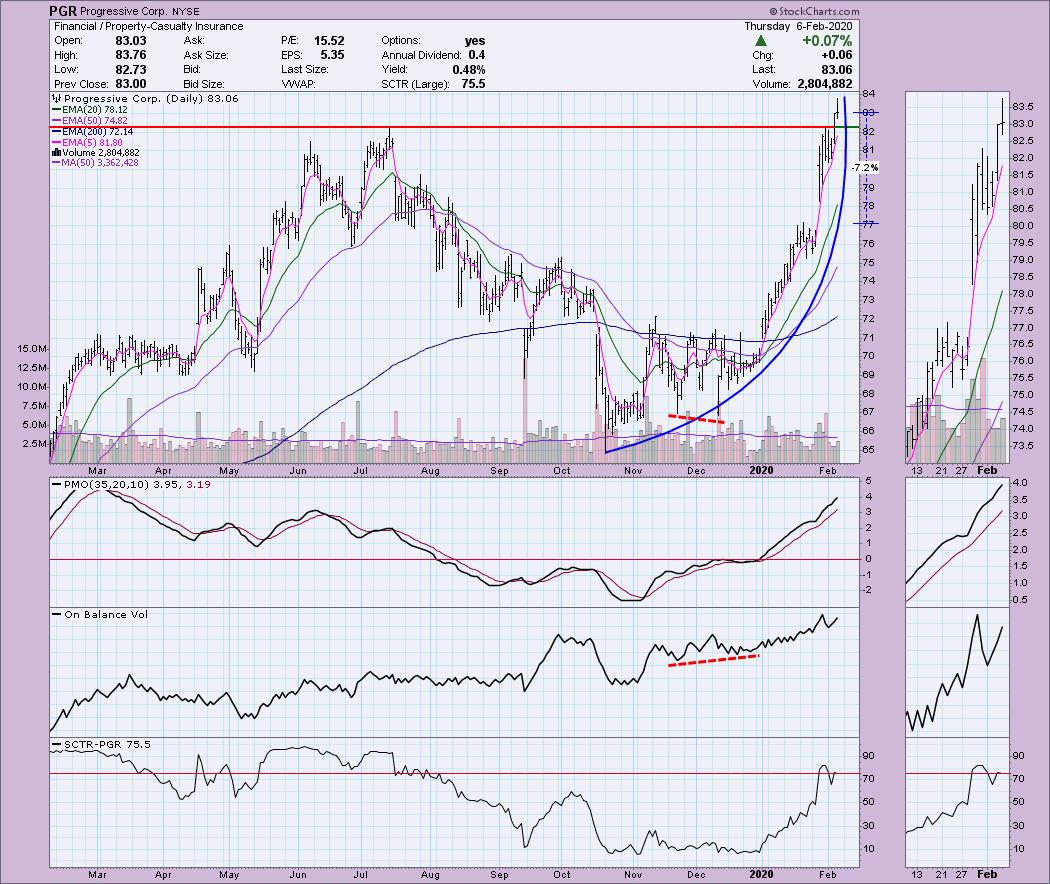
Progressive Corp (PGR) - Earnings: 4/14/2020 (BMO)
This one is in a parabolic move as rising bottoms trendlines get steeper and steeper. Now it is moving vertically. If you're holding it, I'd set a trailing stop to preserve profits off this move. It did breakout yesterday and the indicators look good with a rising PMO and an OBV setting new highs along with price. The SCTR is very healthy and in the hot zone above 75. It's overbought as far as price and getting overbought via the PMO.
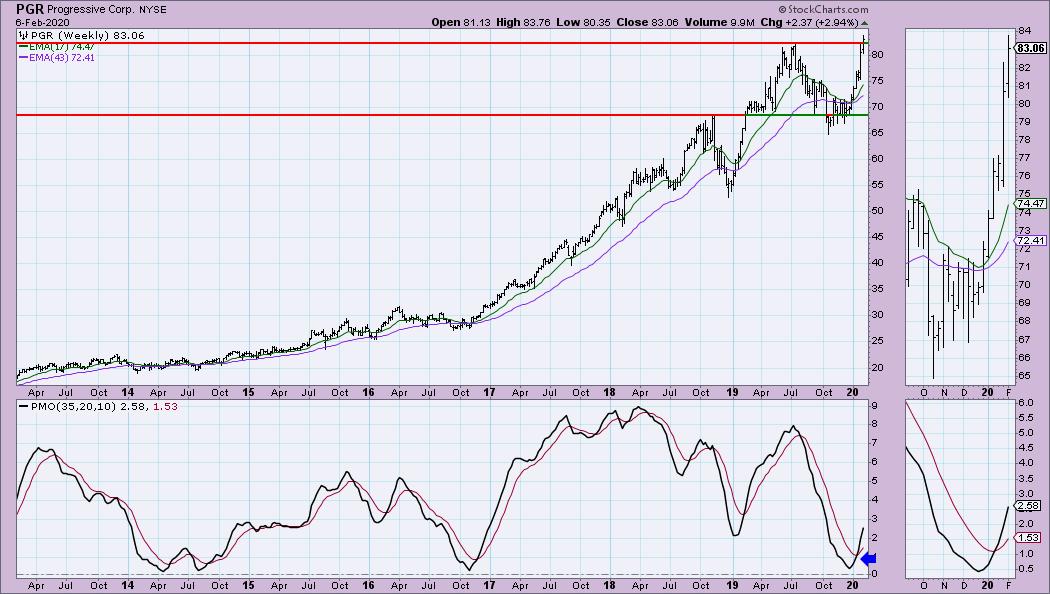
This breakout is impressive on the weekly chart and we have a PMO BUY signal in oversold territory. I like this chart except for the vertical rally. This is a strong stock, just be careful of the overbought conditions and vertical rally.
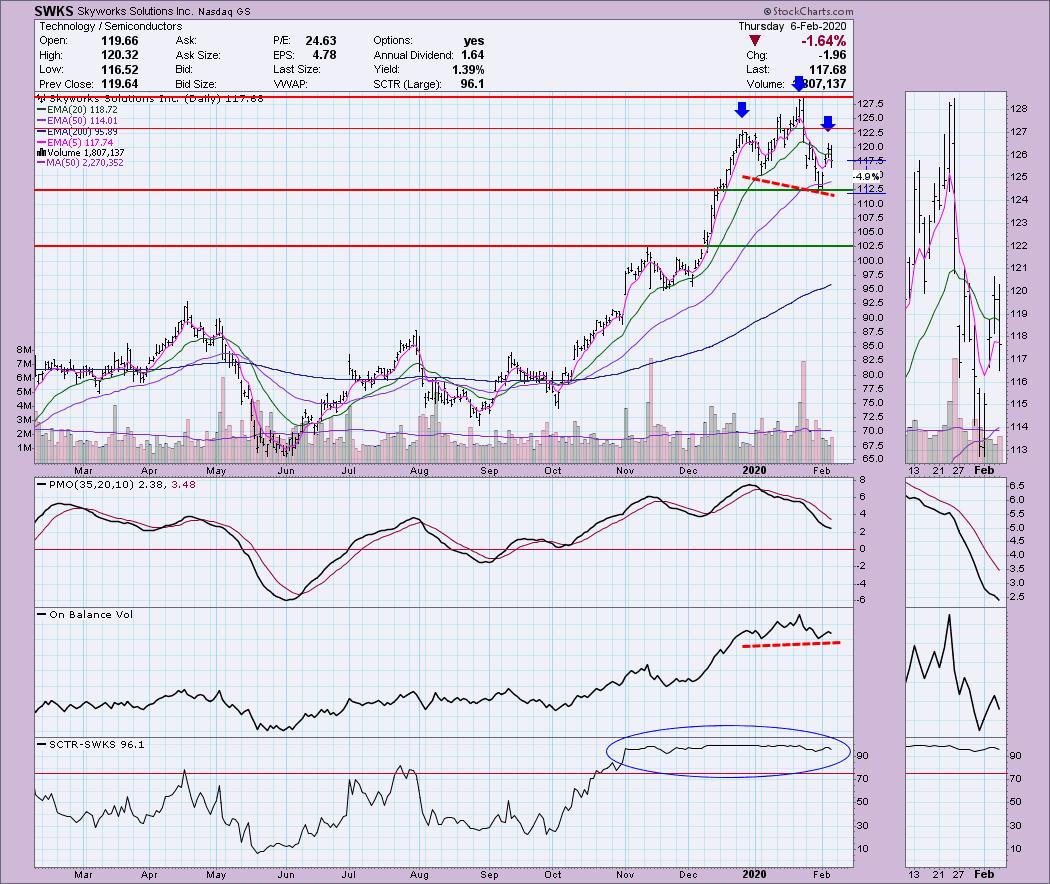
Skyworks Solutions Inc (SWKS) - Earnings: 4/30/2020 (AMC)
This one worries me. It was given to me about a week ago, so a rally off important support occurred after this one was requested. Unfortunately, it is running into trouble and the PMO is telling us this. The SCTR is strong though and there is a positive divergence with the OBV, but if price can't get above $122.50 resistance, then we could have a developing head and shoulders. Just keep an eye on it.
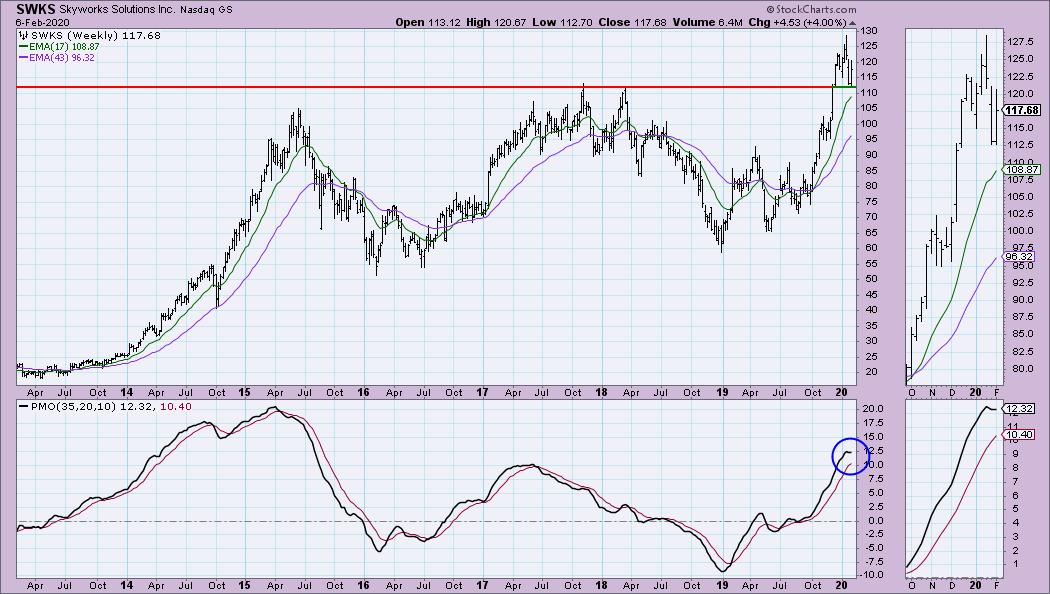
The weekly chart has a lot of promise, the PMO had topped but it is rising again. Previous overhead resistance at $111 was broken and this week it is holding that new support line. Great choice if that support can hold.
SPDR S&P Oil & Gas Equipment Services ETF (XES) - Earnings: N/A
Every Monday - Thursday I write the DecisionPoint Alert where we look at overall market conditions and also cover Dollar, Gold, Oil and Bonds. I've been watching USO and really would like to take advantage of price being right on support; however, with USO, there is another level of support below current support so I'm not thinking it is time to get into Oil itself right now. However, I am really tempted with the Oil & Gas Equipment & Services industry group and this reader request of XES is excellent and an ETF I will consider since I can set a tight stop only about 4.5% below the current closing price. It has bounced off support and while it fell 3.45% today, I find that as an opportunity rather than a fault. I wouldn't mess with this one too much though, I note it has been in a trading range for some time and in October and November the bounce off support didn't immediately pay off since it didn't even come close to testing any major overhead resistance when it turned down. Another positive on this chart is the clear positive divergence between OBV rising bottoms and price bottoms being flat. That's something we didn't see with the previous bounce off support.
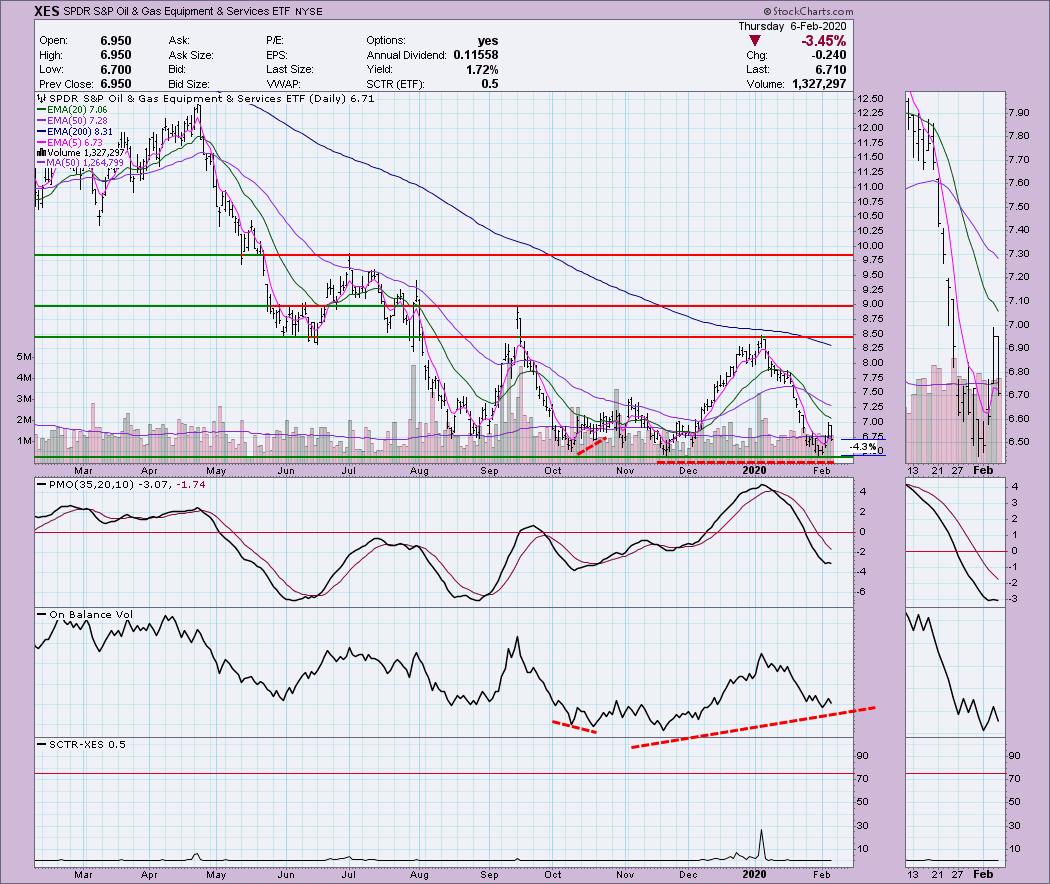
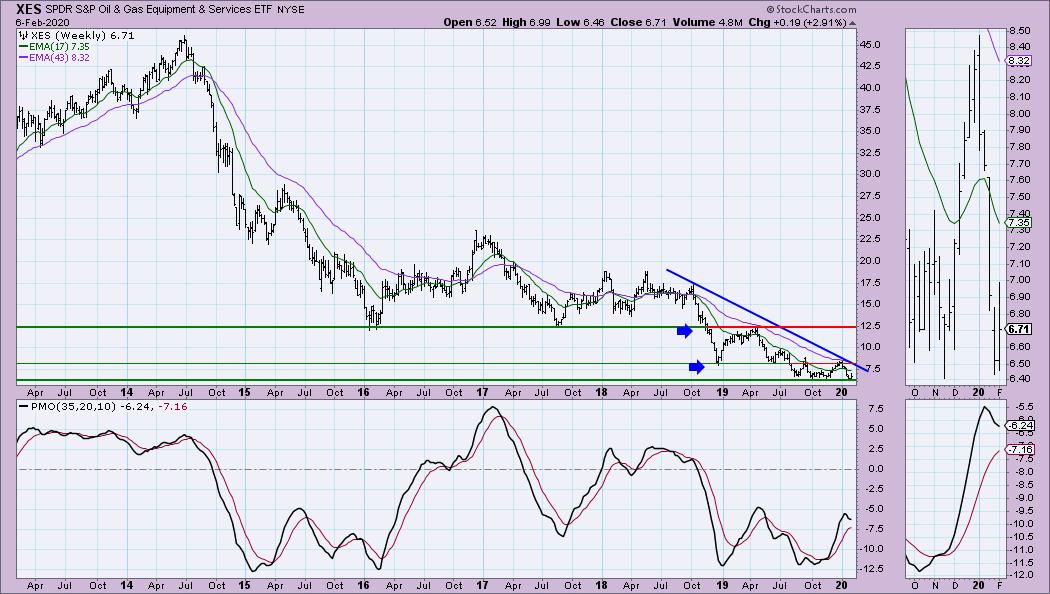
We are sitting at all-time lows for XES, it couldn't get much more oversold. The PMO is declining which I don't like. However, for a beat down ETF, the PMO is not bad as it is decelerating. I'll be adding this one to my watchlist and possibly to my portfolio next week. Thanks for the request!
Don't forget to send me your symbol requests for next Thursday! Diamonds or not, I'll review what is on your radar.
Current Market Outlook:
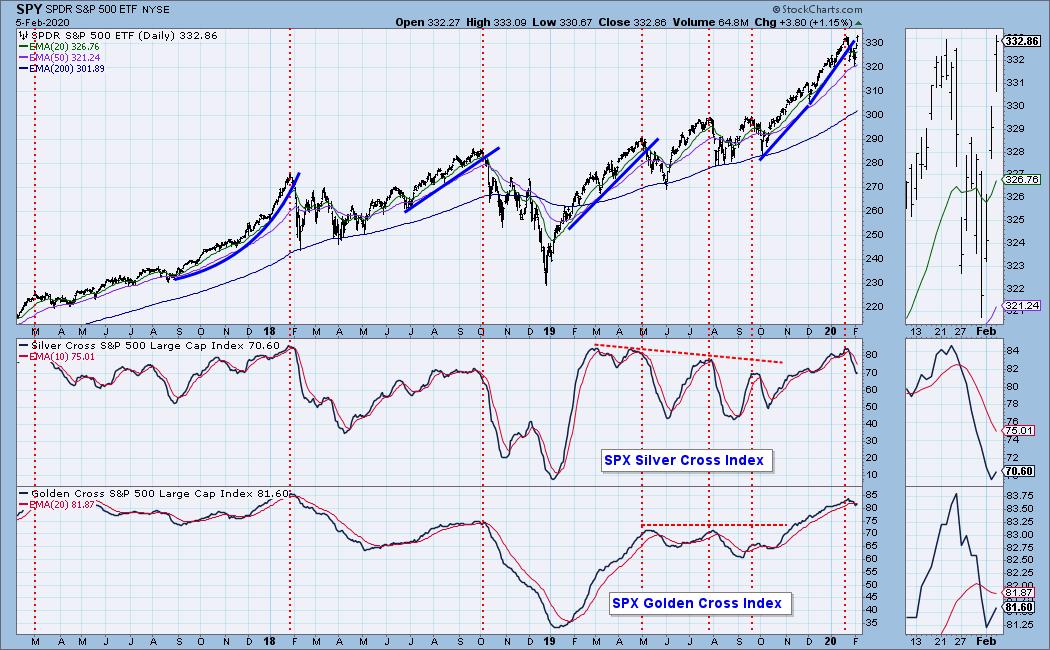
Market Environment: It is important to consider the odds for success. The Silver Cross Index measures the percentage of stocks on IT Trend Model BUY signals (20-EMA > 50-EMA), while the Golden Cross Index measures the percentage of stocks on LT Trend Model BUY signals (50-EMA > 200-EMA). Don't forget that as a "Diamonds" member, you have access to our GCI/SCI curated ChartList on DecisionPoint.com. You'll find it under "Members Only" links on the left side on the Blogs and Links Page. Here are the current percentages on the Silver and Golden Cross Indexes:
Diamond Index:
- Diamond Scan Results: 96
- Diamond Dog Scan Results: 3
- Diamond Bull/Bear Ratio: 32.0
For a more comprehensive review of current market conditions as well as analysis of Dollar, Gold, Oil and Bonds, subscribe to the DecisionPoint Alert! For a LIMITED TIME you can get a coupon code that will give you a discount for bundling your Diamonds subscription with the DecisionPoint Alert! Contact support@decisionpoint.com for more details.
Full Disclosure: I do not own any of the stocks above. I'm currently 25% in cash.

Erin Swenlin will be presenting at the The MoneyShow Las Vegas on May 11-13, 2020! You'll have an opportunity to meet Erin and discuss the latest DecisionPoint news and Diamond Scans. The conference is free to attend or view online!
Watch the latest episode of DecisionPoint with Carl & Erin Swenlin LIVE on Mondays 5:00p EST or on the StockCharts TV YouTube channel here!
Technical Analysis is a windsock, not a crystal ball.
Happy Charting!
- Erin
erinh@stockcharts.com
NOTE: The stocks reported herein are from mechanical trading model scans that are based upon moving average relationships, momentum and volume. DecisionPoint analysis is then applied to get five selections from the scans. The selections given should prompt readers to do a chart review using their own analysis process. This letter is not a call for a specific action to buy, sell or short any of the stocks provided. There are NO sure things or guaranteed returns on the daily selection of "diamonds in the rough."
Helpful DecisionPoint Links:
DecisionPoint Shared ChartList and DecisionPoint Chart Gallery
Price Momentum Oscillator (PMO)
Swenlin Trading Oscillators (STO-B and STO-V)
For more links, go to DecisionPoint.com!