
Today the scan "star" was Carl's Scan. I found some very interesting names on that list and will share them. The Diamond Ratio continues to log high numbers which means there are far more bullish scan results v. bearish scan results. I report the number of scan results for the bullish Diamond Scan and bearish Diamond Dog Scan at the bottom of these reports and calculate a ratio. I don't have quite enough data to chart the results, but that will come later. I think it will be an interesting gauge of market sentiment and market strength. If you haven't noticed, in order to protect my Diamonds Report subscribers, I try to not put any symbols or names in the first paragraph or in the title. Y'all pay for this and it shouldn't be available to anyone other than you, dear reader.
SPDR S&P Oil & Gas Equipment & Services (XES) - Earnings: N/A
I decided I wanted to revisit XES, the Oil & Equipments Services ETF. For the original article, click here. I also want to thank one of our Diamonds readers for selecting it for Reader Request Thursday. It's been on my radar since then and I think it is still attractive. We now have a short-term double-bottom possibly forming that is sitting on all-time lows. We have a slight positive divergence over the longer-term between the OBV and price lows. Setting a fairly tight stop is easy here.
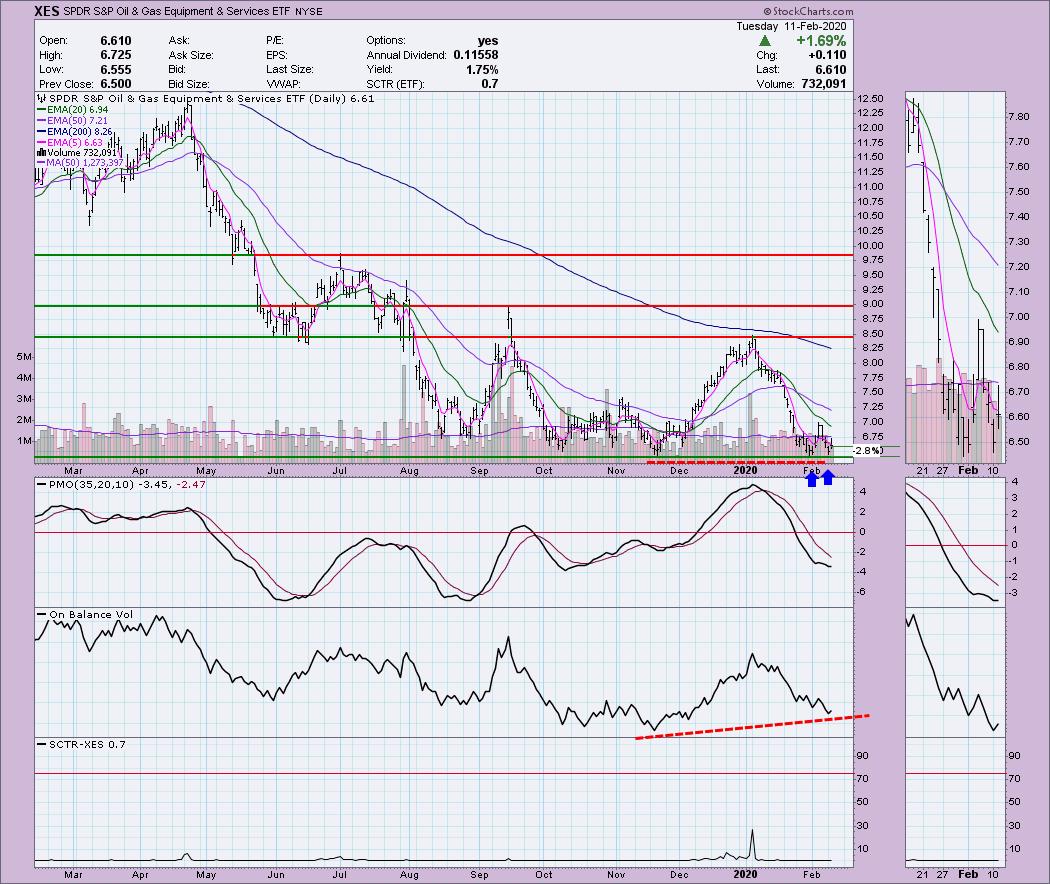
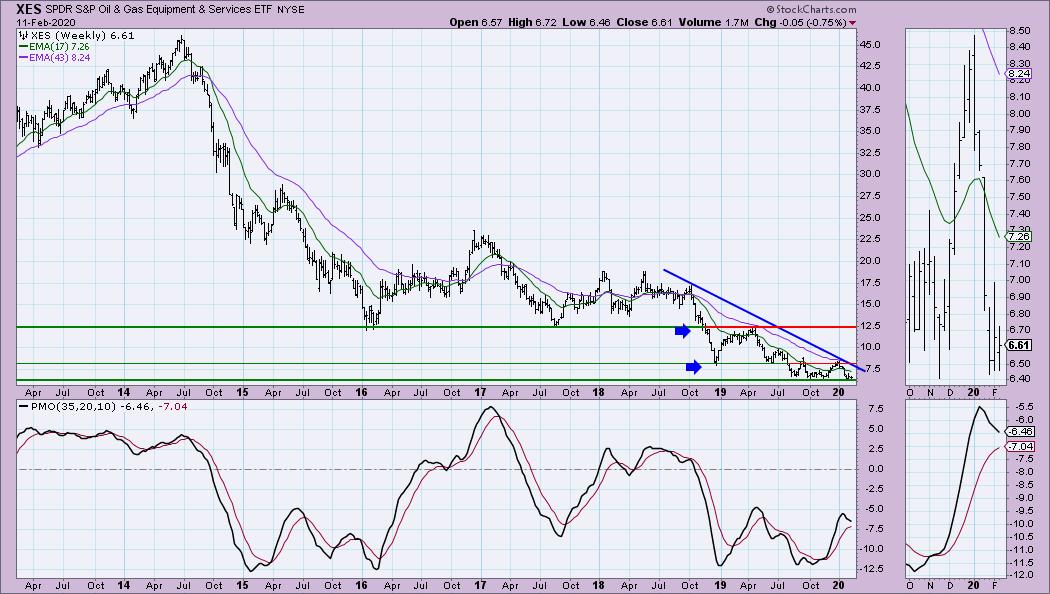
While the weekly chart is still somewhat negative, it does point out that price is at those all-time lows. I like that it is an ETF and not an individual stock as well. I'll be watching this onefor probably entry this week . Sorry for the repeat, but as they say, "it bears repeating".
Welcome to DecisionPoint Daily Diamonds, wherein I highlight five "diamonds in the rough." These are selected from the results of my DecisionPoint scans, which search for stocks that could benefit from the trend and condition of the market. Remember, these are not recommendations to buy or sell, but are the most interesting of the stocks that surfaced in my scans. My objective is to save you the work of the initial, tedious culling process, but you need to apply your own analysis to see if these stocks pique your interest as well. There are no guaranteed winners here!
Fresh Del Monte Produce (FDP) - Earnings: 2/19/2020 (BMO)
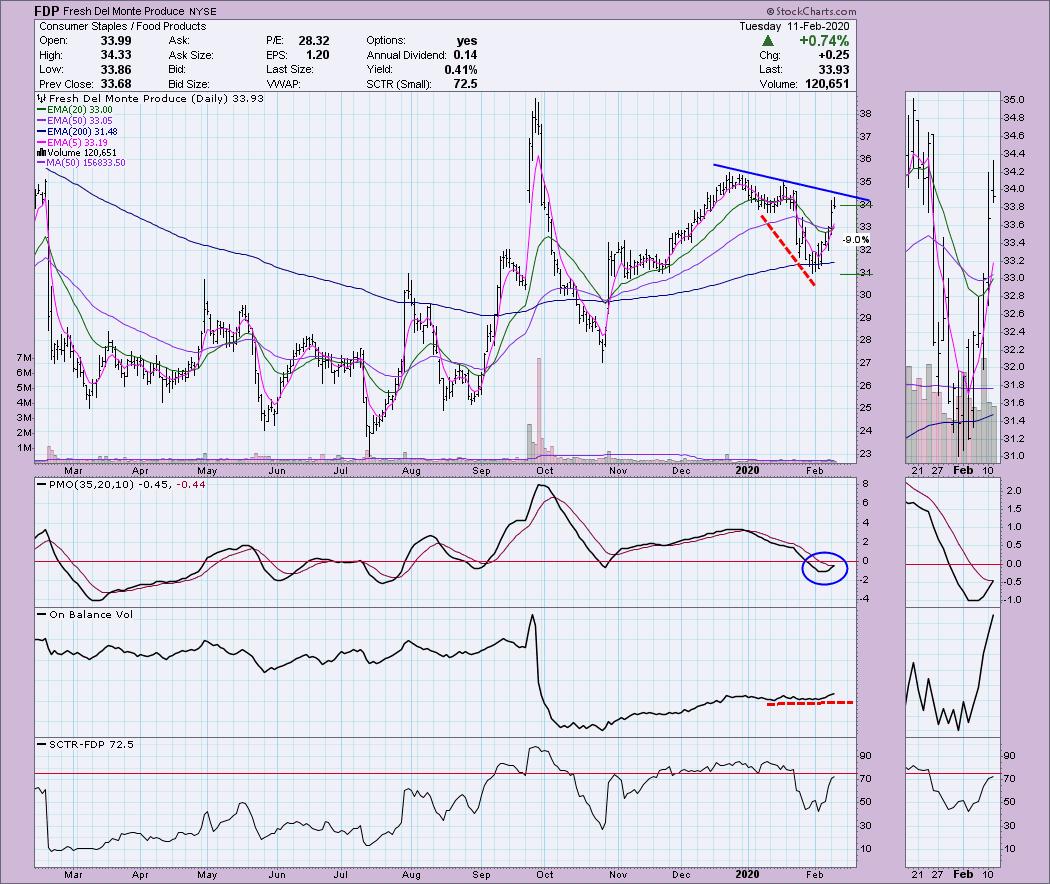
First "big name": I'm seeing a "V" Bottom. Believe it or not, these are bullish formations that tend to see follow-through to the beginning top of the "V" and further. (If you'd like more information on this, or really any other chart pattern, you can find it on John Bulkowski's website, ThePatternSite.com.). The declining tops trendline hasn't been broken yet, but the 20-EMA is on its way back up for a positive crossover the 50-EMA which would generate an IT Trend Model BUY signal. The PMO has turned up and is nearing a BUY signal. I like the OBV positive divergence. My main concern is whether price can get out of the declining trend. Setting a stop here will be tricky as the last area of support is 9% down.
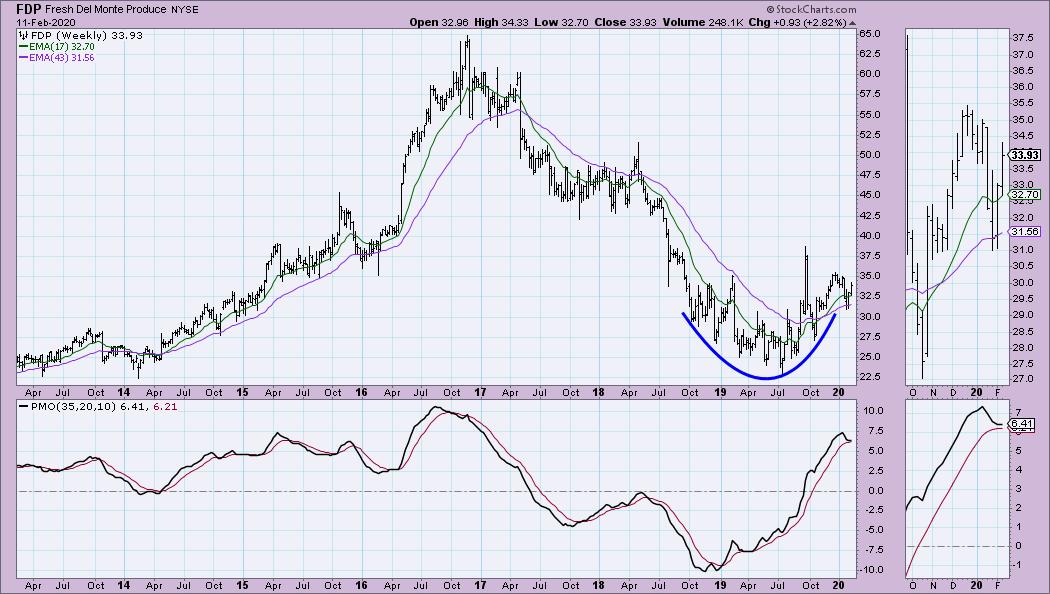
I think we are looking at a possible bullish cup and handle right now. The PMO is flattening and while it is overbought, it isn't at extremes. My upside target looking a this chart would be $42.50.
Don't forget, on Thursdays I look at reader-requested symbols, so shoot me an email at erin@decisionpoint.com. I read every email I receive and try to answer them all!
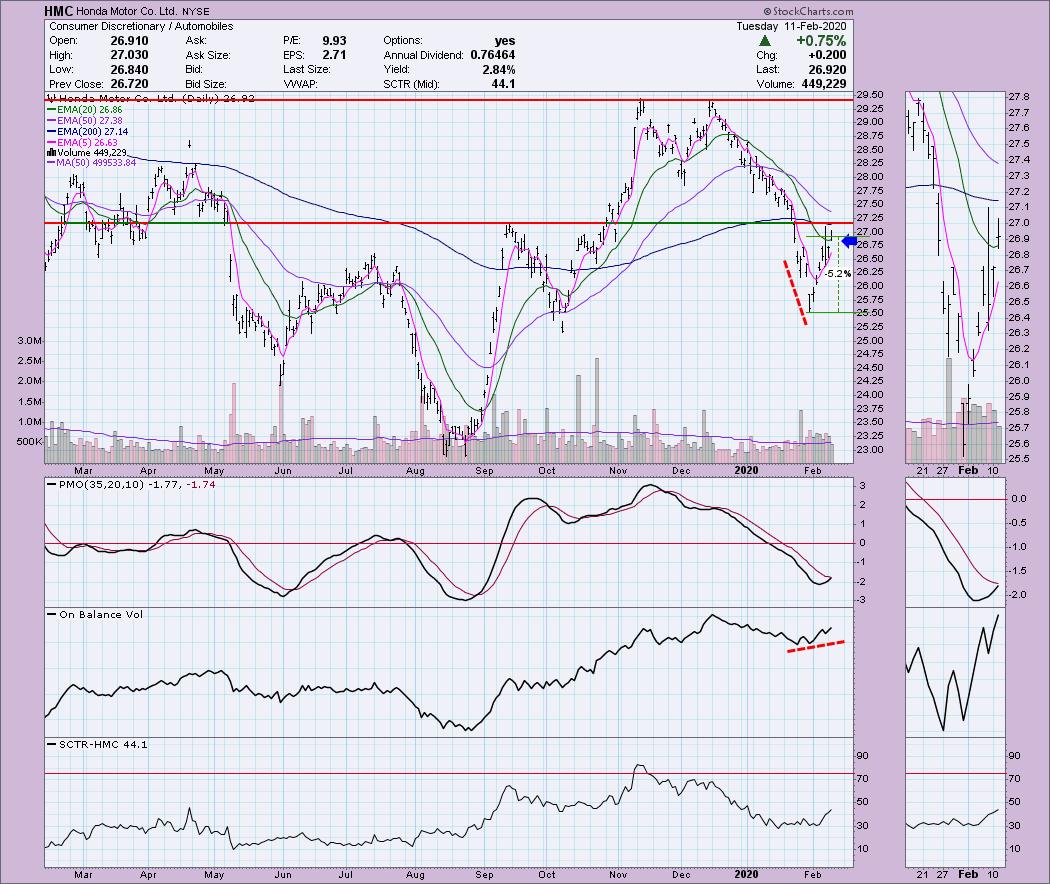
Honda Motor Co Ltd (HMC) - Earnings: 5/6/2020 (BMO)
Second "big name": Here we have another "V" Bottom. I'll feel better about this if it can breakout above the September top, but given it closed and traded above the 20-EMA, I am optimistic. We have another great positive divergence between the OBV and price lows. The PMO is nearing a BUY signal. The SCTR is so-so, but it is rising.
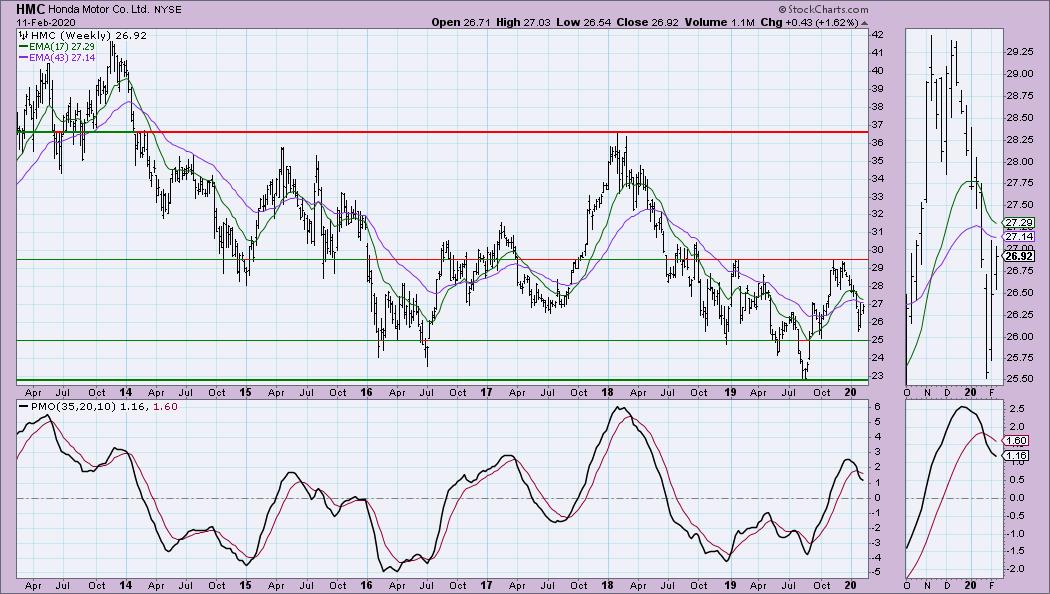
The PMO on the weekly chart is on a SELL signal, but it is trying to decelerate. It's a bit early so I didn't annotate it, but we could have a complex reverse head and shoulder pattern building. The 2018 low would be the left shoulder, the 2019 low would be the head and the low that was set two weeks ago would be the right shoulder. A move to test overhead resistance at $29.50 is entirely plausible.
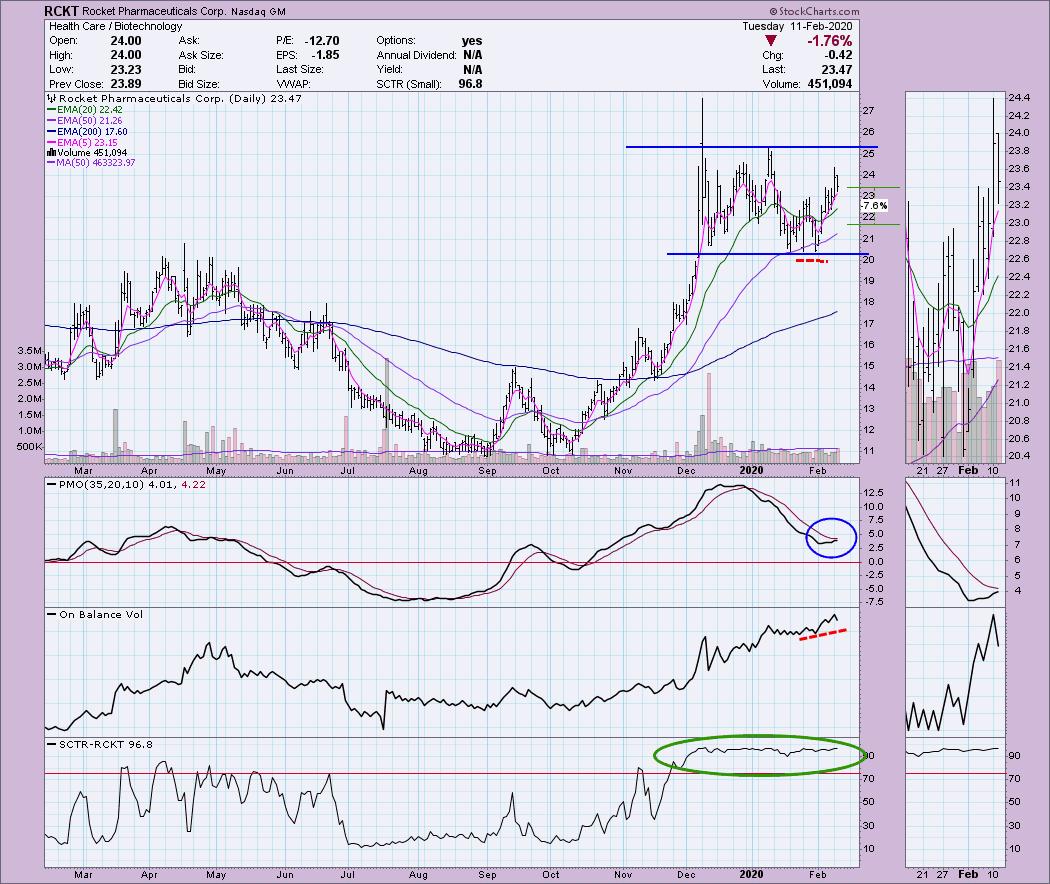
Rocket Pharmaceuticals Corp (RCKT) - Earnings: 3/5/2020 (BMO)
I'm familiar with Rocket Mortgage, but didn't realize there was a pharma company named Rocket. (My daughter's dog's name is Rocket too lol) Lots of good stuff on this chart. First, to begin, you really should watch yesterday's "DecisionPoint" Show. Carl talked about the constructive breakdown of the Biotech industry group from a parabolic. You can see the same pattern on this chart (which makes sense given it is in the same group) that he discussed. The large trading range has cleared overbought conditions. The OBV gave us a positive divergence with price lows and the SCTR remains in the "hot zone". Price is nearing the top of the range, but given the PMO is ready to trigger a BUY signal, I would look for a breakout.
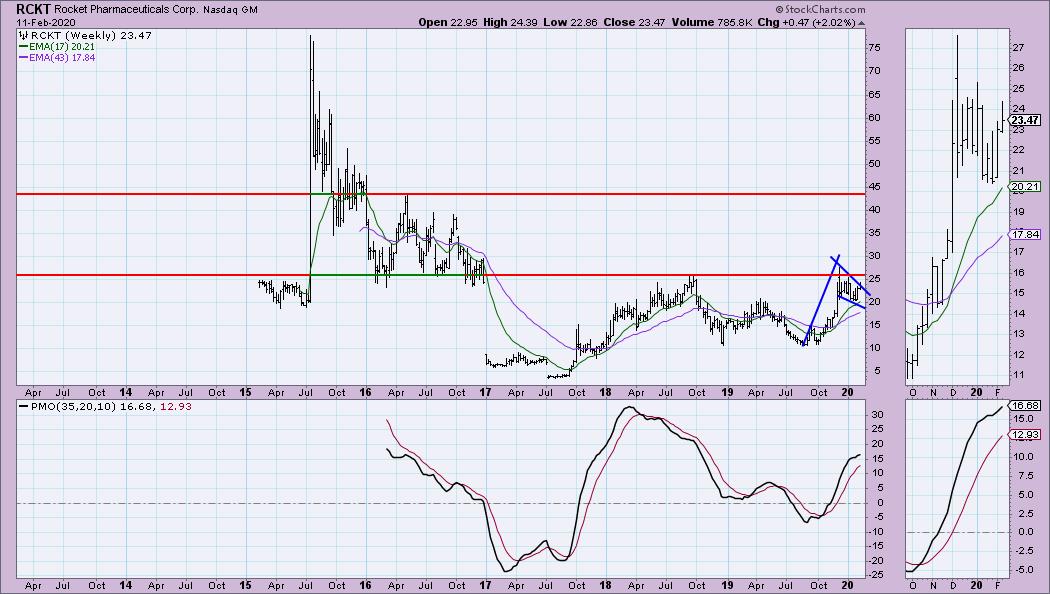
We have a bullish flag formation on the weekly chart and a rising (and not overbought) PMO.
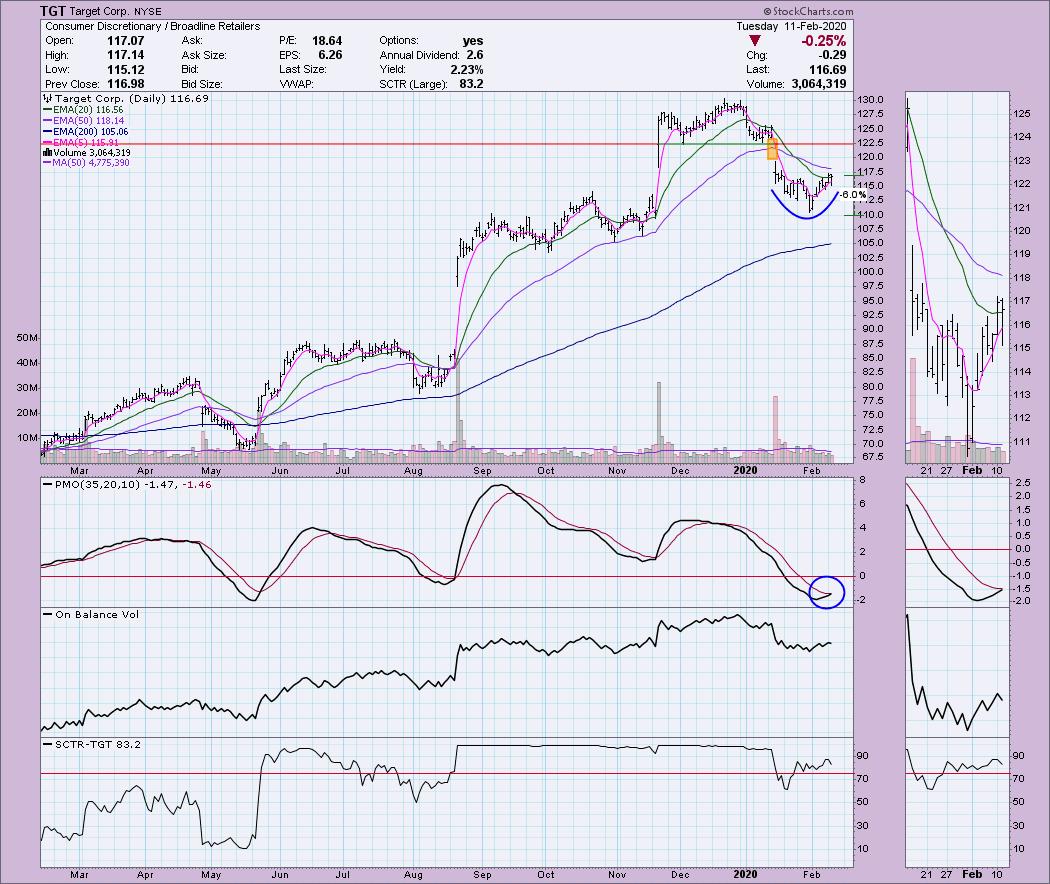
Target Corp (TGT) - Earnings: 3/3/2020 (BMO)
Third big name and a favorite shopping stop of mine. I think the stock is looking good right now. It is nearing a PMO BUY signal and it has a SCTR that has been in the "hot zone" most of the past year. I like the cup shaped bottom and that $110 is a nice area for a stop. Price closed above the 20-EMA for the second time since gapping down. I would look for the initial gap down to be covered on this next rally.
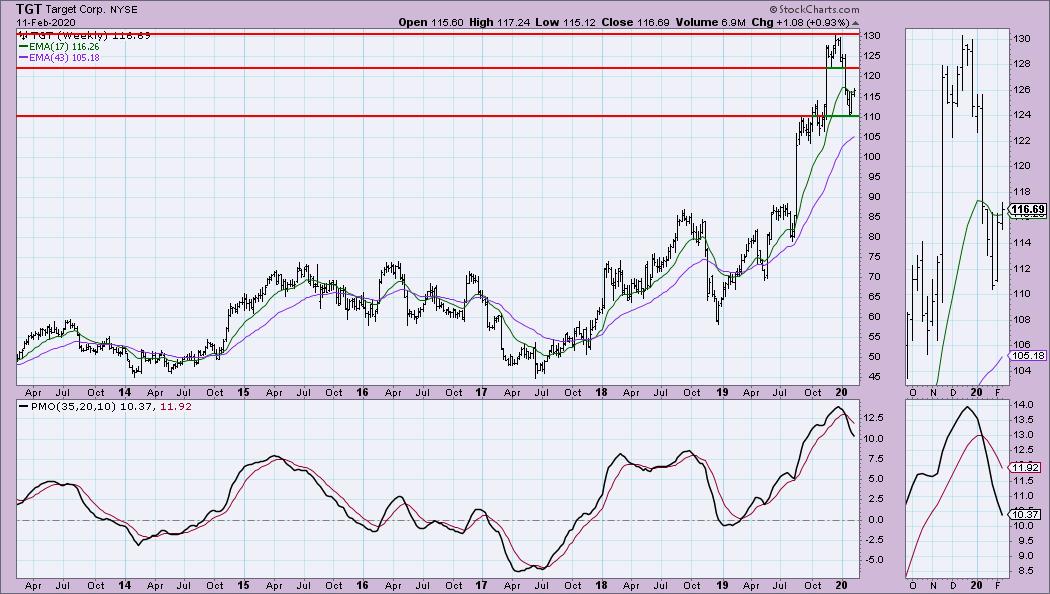
I really wish the weekly chart looked better as far as the PMO, but it may be decelerating. Price is currently above the 17-week EMA.
Current Market Outlook:
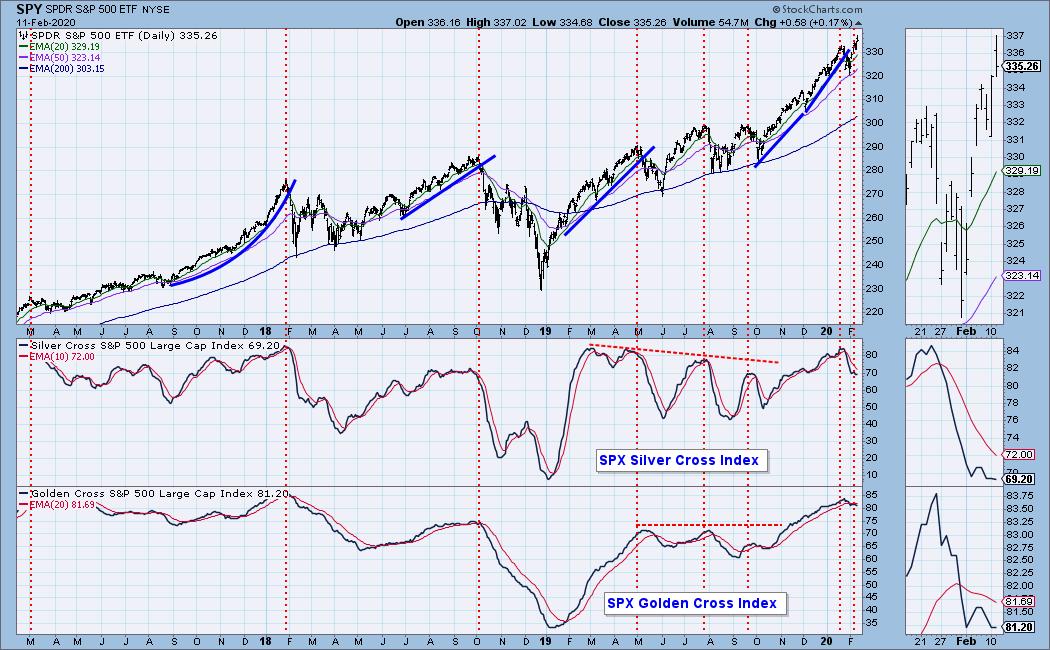
Market Environment: It is important to consider the odds for success. The Silver Cross Index measures the percentage of stocks on IT Trend Model BUY signals (20-EMA > 50-EMA), while the Golden Cross Index measures the percentage of stocks on LT Trend Model BUY signals (50-EMA > 200-EMA). Don't forget that as a "Diamonds" member, you have access to our GCI/SCI curated ChartList on DecisionPoint.com. You'll find it under "Members Only" links on the left side on the Blogs and Links Page. Here are the current percentages on the Silver and Golden Cross Indexes:
Diamond Index:
- Diamond Scan Results: 26
- Diamond Dog Scan Results: 1
- Diamond Bull/Bear Ratio: 26.0
For a more comprehensive review of current market conditions as well as analysis of Dollar, Gold, Oil and Bonds, subscribe to the DecisionPoint Alert! For a LIMITED TIME you can get a coupon code that will give you a discount for bundling your Diamonds subscription with the DecisionPoint Alert! Contact support@decisionpoint.com for more details.
Full Disclosure: I do not own any of the stocks above but will likely add XES to my portfolio this week. I'm currently 25% in cash.

Erin Swenlin will be presenting at the The MoneyShow Las Vegas on May 11-13, 2020! You'll have an opportunity to meet Erin and discuss the latest DecisionPoint news and Diamond Scans. The conference is free to attend or view online!
Watch the latest episode of DecisionPoint with Carl & Erin Swenlin LIVE on Mondays 5:00p EST or on the StockCharts TV YouTube channel here!
Technical Analysis is a windsock, not a crystal ball.
Happy Charting!
- Erin
erinh@stockcharts.com
NOTE: The stocks reported herein are from mechanical trading model scans that are based upon moving average relationships, momentum and volume. DecisionPoint analysis is then applied to get five selections from the scans. The selections given should prompt readers to do a chart review using their own analysis process. This letter is not a call for a specific action to buy, sell or short any of the stocks provided. There are NO sure things or guaranteed returns on the daily selection of "diamonds in the rough."
Helpful DecisionPoint Links:
DecisionPoint Shared ChartList and DecisionPoint Chart Gallery
Price Momentum Oscillator (PMO)
Swenlin Trading Oscillators (STO-B and STO-V)
For more links, go to DecisionPoint.com!