
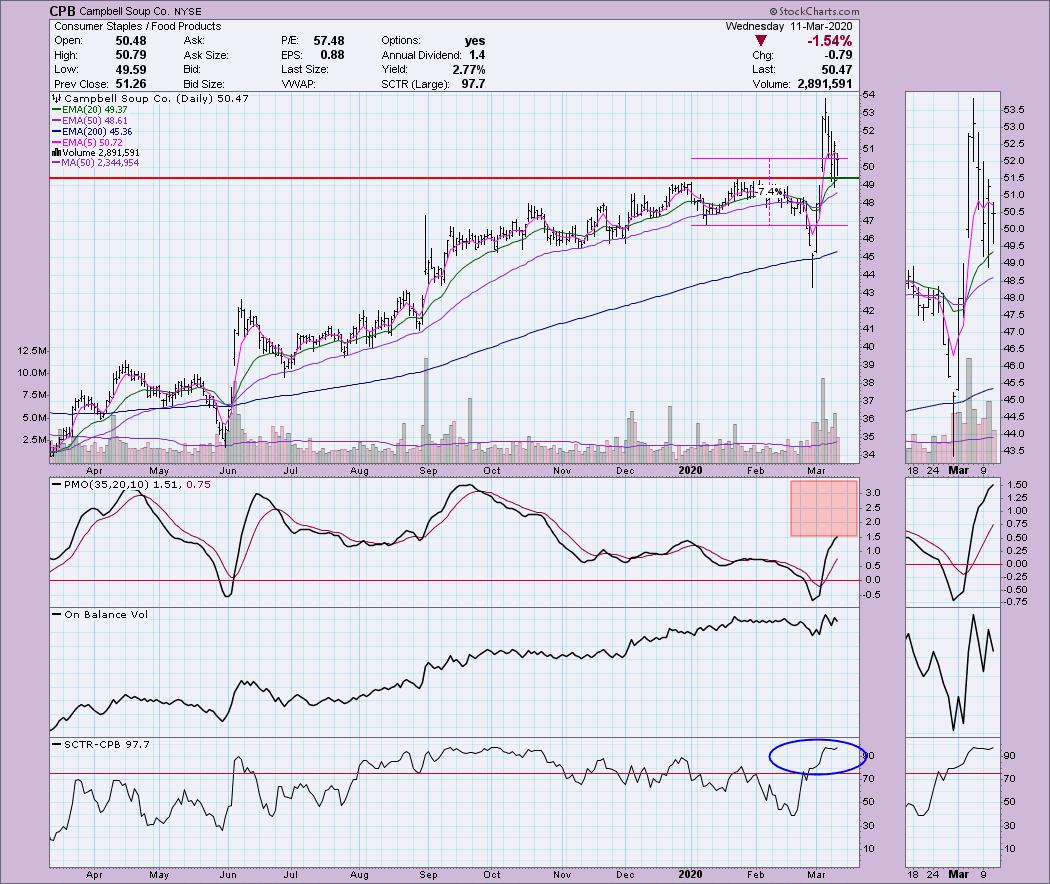
The wild ride continues. With volatility still off the charts, I recommend carefully managing all of your positions during the trading day (if you aren't already). I am currently selling into strength when I can and sitting in 80% cash now. I am having to adjust my scans to get results because no stocks are showing consistent positive momentum. That's a warning flag regarding entry. I have found a few stocks that are showing relative strength and I also will present a possible bottom fishing opportunity. Again, I stress caution and definitely set stops. I have marked some percentage stop areas in pink on the daily charts for your consideration. With one day of historic rally and the next historic decline, tight stops are difficult. Know your risk tolerance before entering these or any stock right now.
Campbell Soup Co (CPB) - Earnings: 5/22/2020 (BMO)
Maybe this one will turn out to be "mmmmm mmmmmm good". Chicken soup for the soul or portfolio? I like this chart. First price has stayed above the 20-EMA despite the damage done this past week to the overall market. The PMO is rising and is definitely not overbought. Price pulled back to support at $49 and appears ready to bounce from here. With a SCTR of 97.7, it is ranking in the top 3% of large-cap stocks in relative strength.
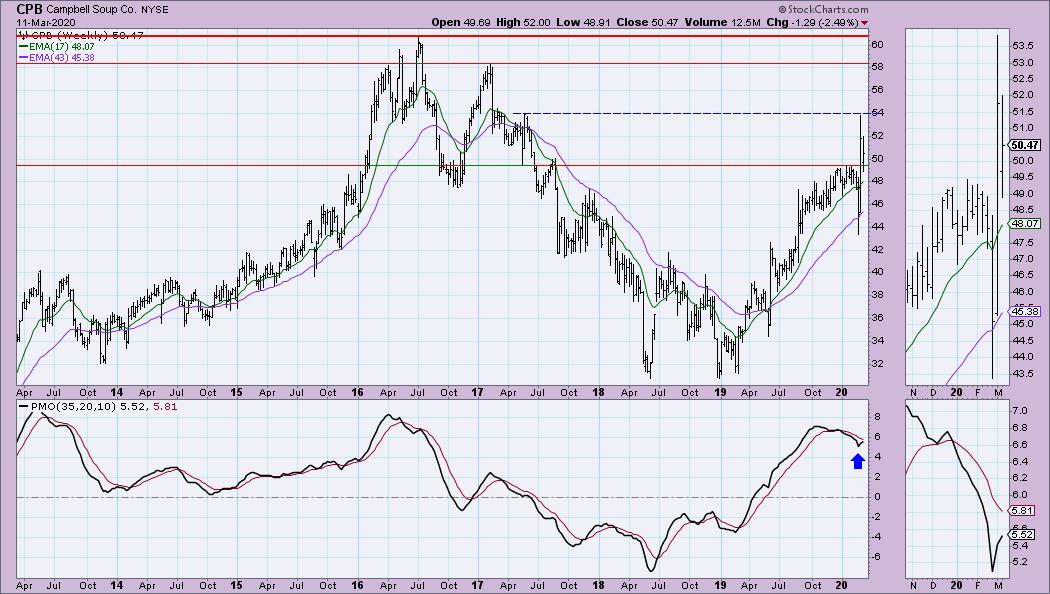
The weekly PMO is turning up. Price has held support at the 43-week EMA even after the 'crash'. Overhead resistance in the shorter-term is $54 as seen on the daily chart above, but also it aligns with the mid-2017 top.
Welcome to DecisionPoint Daily Diamonds, wherein I highlight five "diamonds in the rough." These are selected from the results of my DecisionPoint scans, which search for stocks that could benefit from the trend and condition of the market. Remember, these are not recommendations to buy or sell, but are the most interesting of the stocks that surfaced in my scans. My objective is to save you the work of the initial, tedious culling process, but you need to apply your own analysis to see if these stocks pique your interest as well. There are no guaranteed winners here!
Luminex Corp (LMNX) - Earnings: 5/4/2020 (AMC)
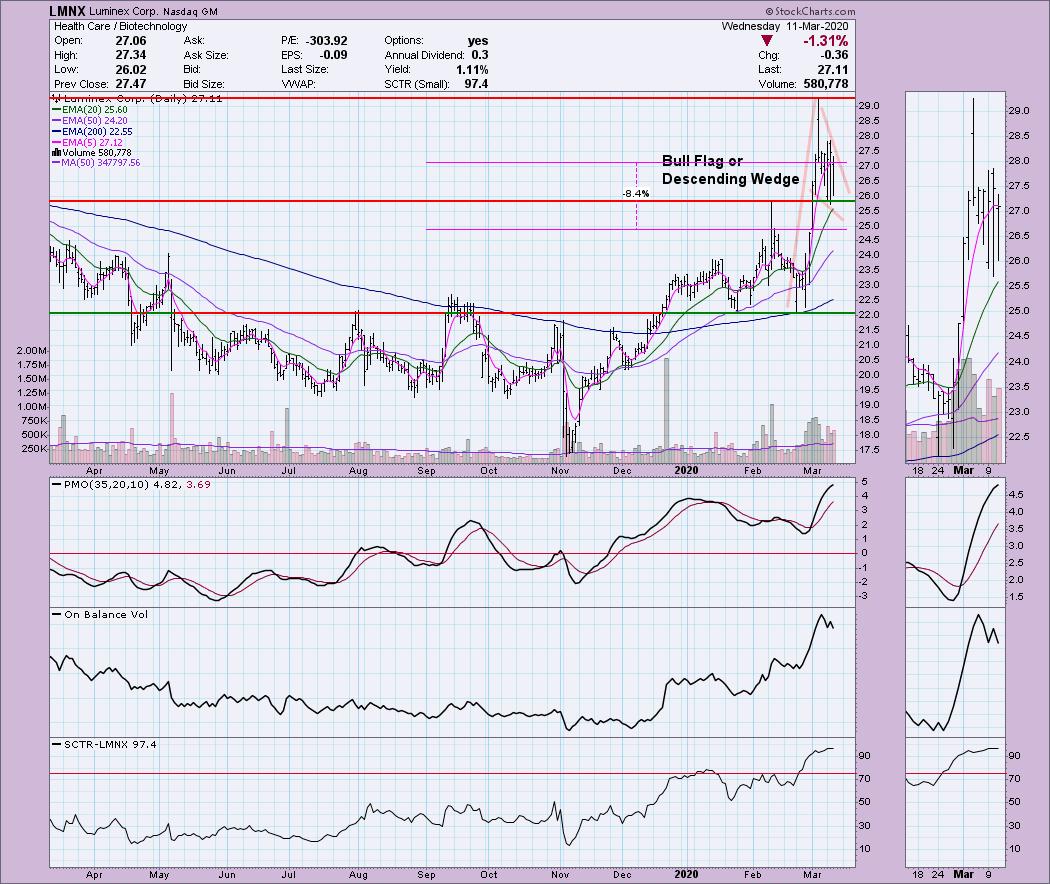
This another stock like CPB. It is holding above support at its mid-February top and well above the 20-EMA. The PMO is overbought which is a problem for me, but we do have a possible bull flag or descending wedge that suggests an upside resolution. It also is in the top 3% of small-caps (that StockCharts tracks in that 'universe').
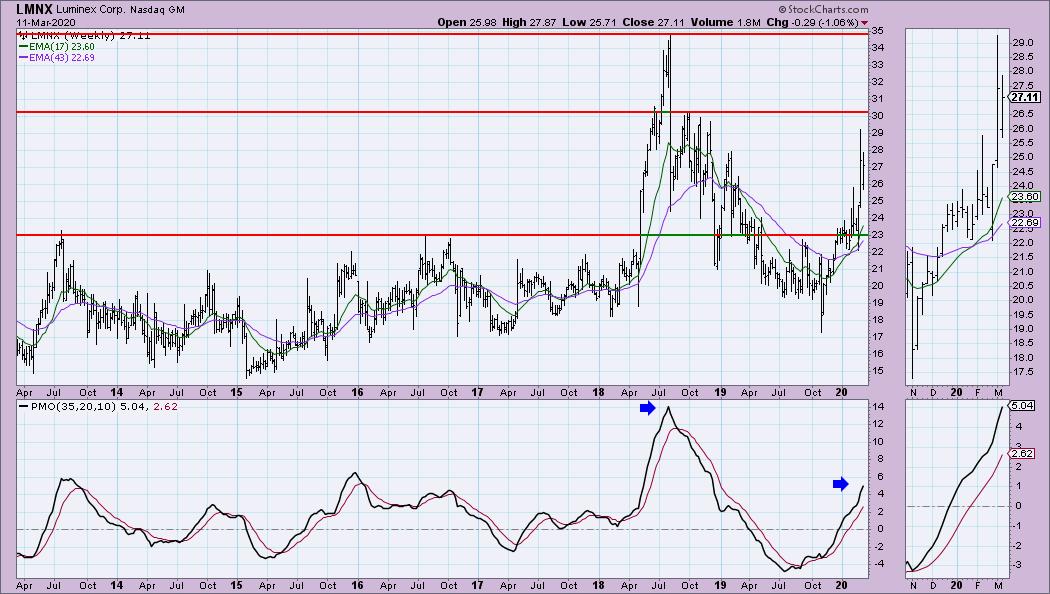
Overhead resistance is around $30, but it could potentially make a run for the all-time high. The PMO is far from overbought and could certainly support higher prices.
Don't forget, on Thursdays I look at reader-requested symbols, so shoot me an email at erin@decisionpoint.com. I read every email I receive and try to answer them all!
Masimo Corp (MASI) - Earnings: 5/6/2020 (AMC)
Here is another relative strength leader with a SCTR of 98.2 (top 2% of mid-caps). We just got a PMO BUY signal. I also note that we had a positive divergence on the OBV just before the rebound off last month's low. It continues to rise and confirm. Overhead resistance is close, if it manages to break above, I'd be more interested. Setting a stop here is also tricky. I chose just under $170 as a possibility to keep the stop within 8%.
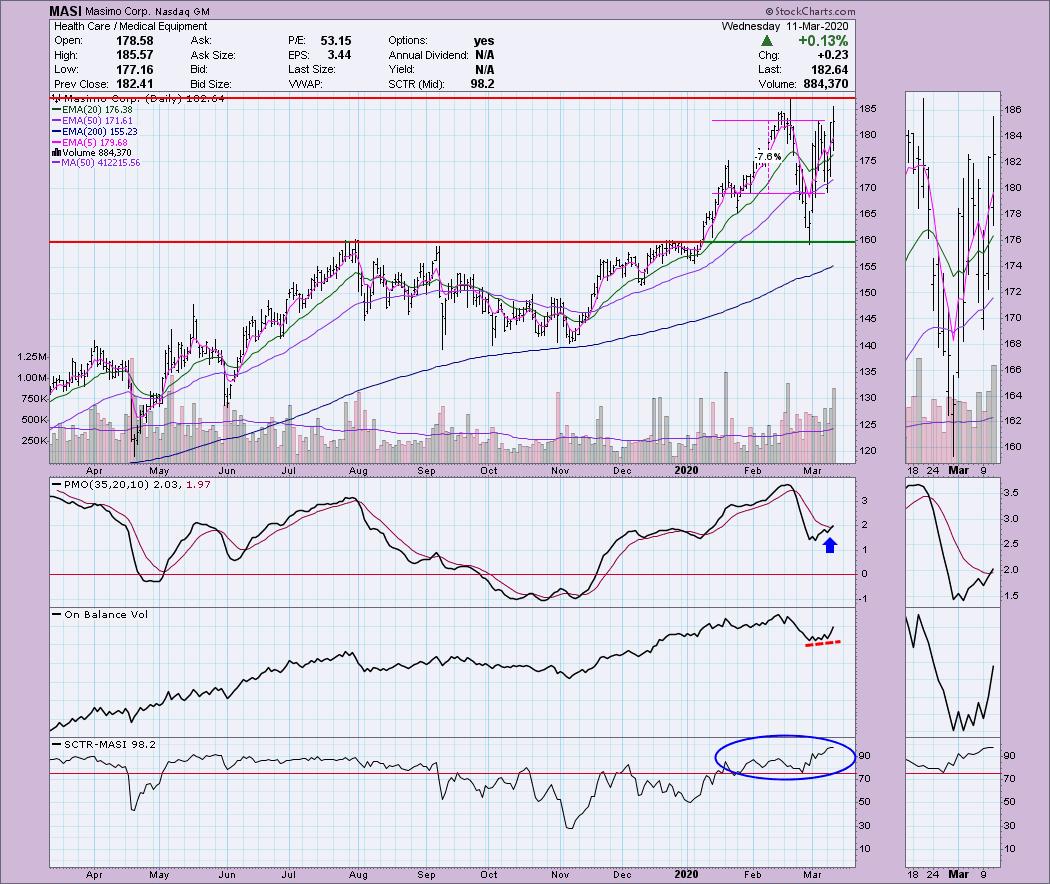
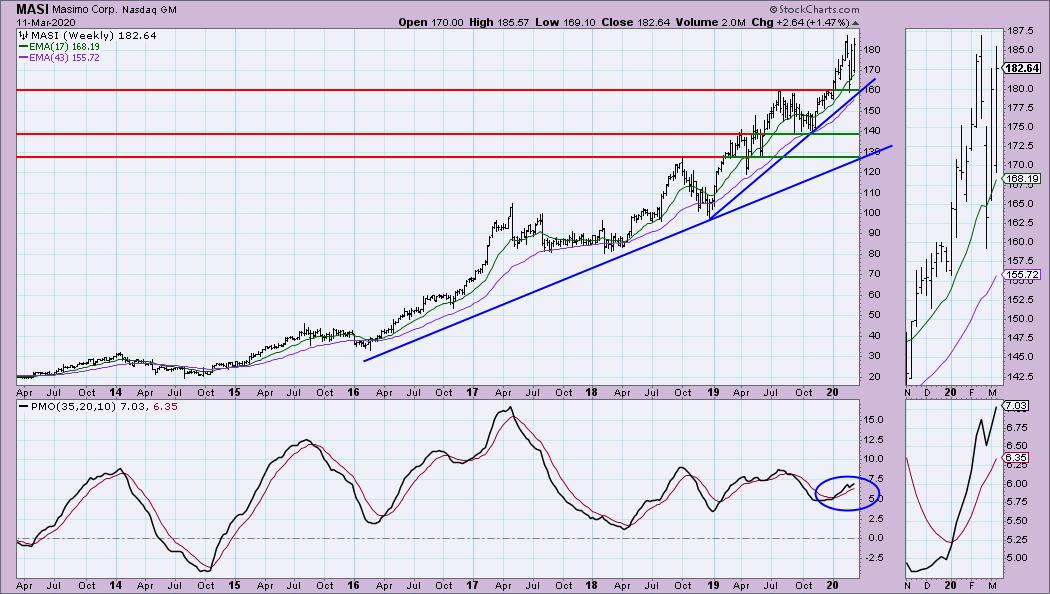
Another possible stop could be around $160, basically the area where we would see a breakdown of the current rising trend. The weekly PMO is very positive, having just formed a bottom above the signal line.
NetGear Inc (NTGR) - Earnings: 4/22/2020 (AMC)
This is a bottom fishing opportunity. We have a positive divergence with the OBV right now and that usually signals a rally off lows. It seems to be trying to rally. I do like the SCTR rise during this time of consolidation. However, it is in a serious bear market configuration and we don't really have a support area on the 1-year daily chart. This has promise given the rising PMO, but remember oversold conditions in a bear market don't necessarily make great support.
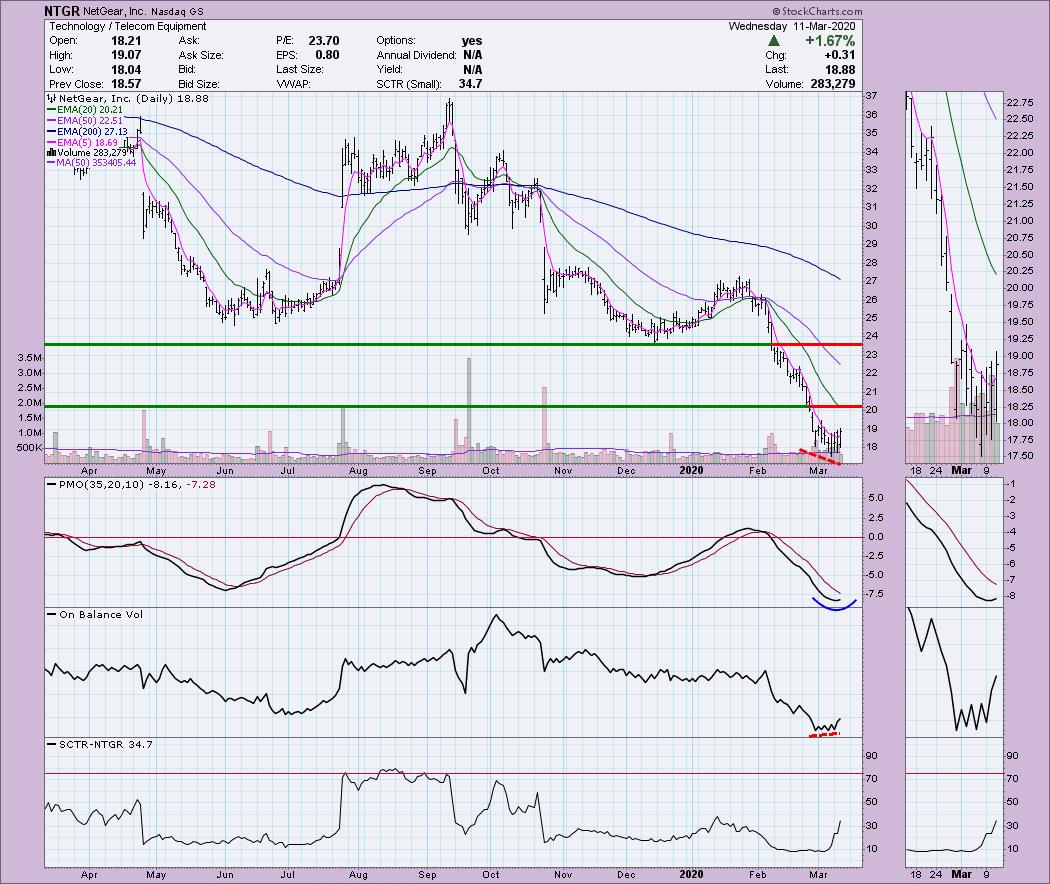
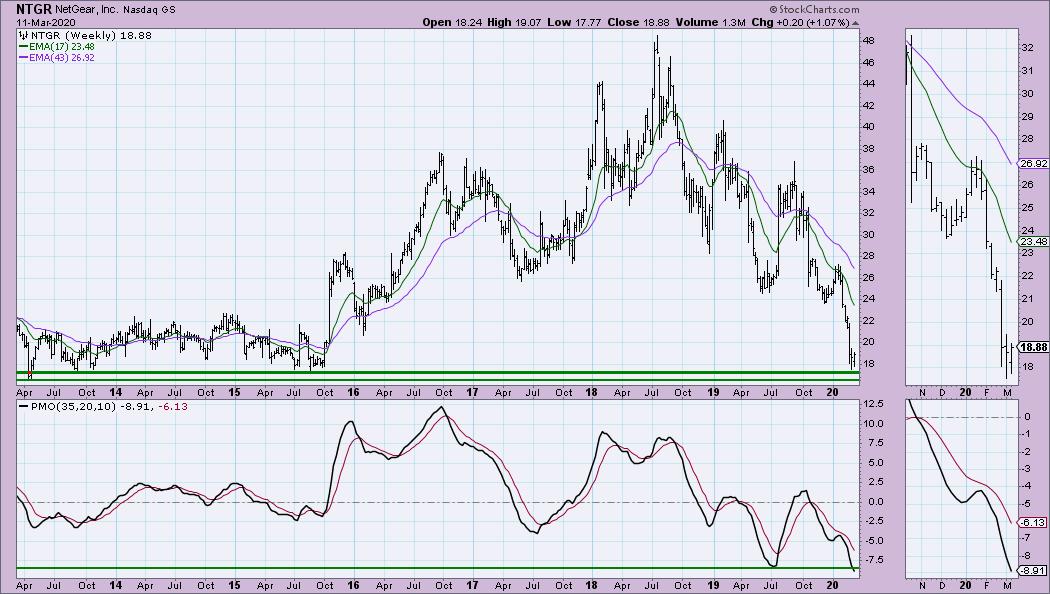
The weekly PMO is very oversold, but still in decline. Note that we are at multi-year support already. I generally like this set-up, but we've seen many stocks slide well below their multi-year lows. I didn't mark a stop area. Based on the weekly chart, I would be looking at $16 or $17.
Vipshop Holdings Ltd (VIPS) - Earnings: 5/20/2020 (BMO)
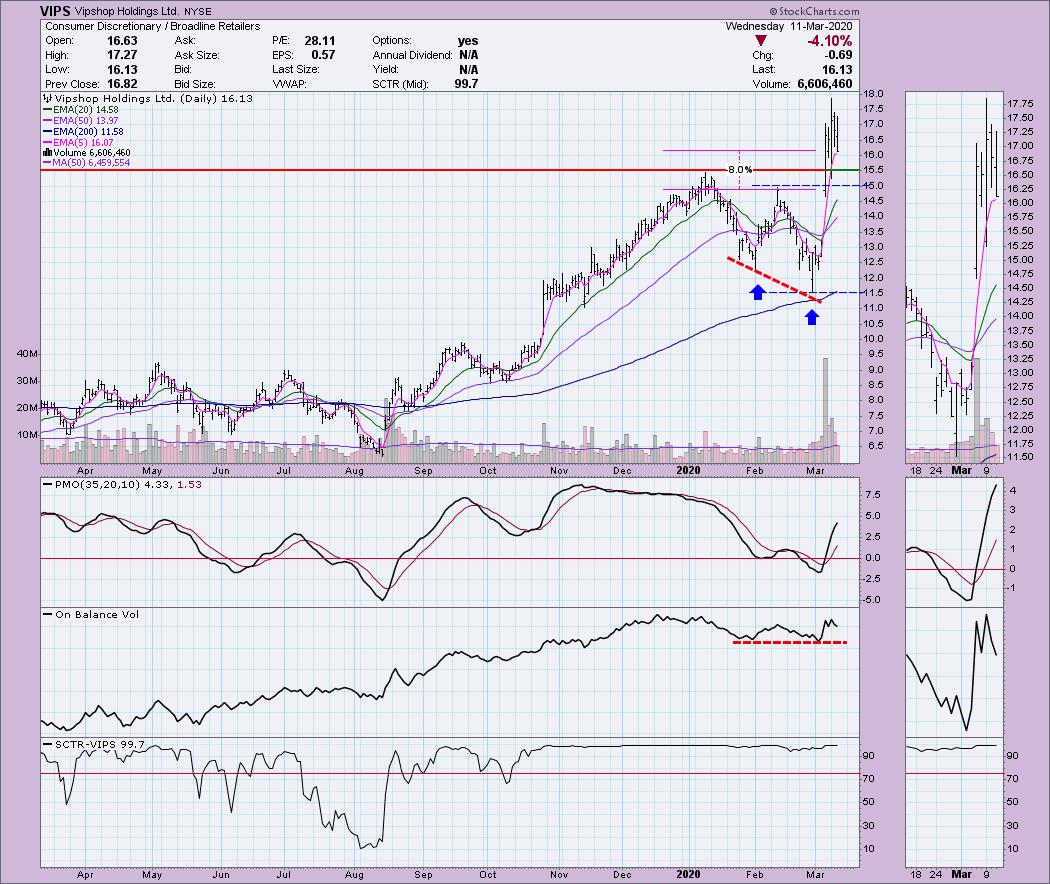
With a SCTR rank of 99.7, VIPS is in the top 0.5% of small-cap stocks. The very interesting OBV positive divergence really panned out. Price leapt higher off the 200-EMA. It took a beating today and I would look at support at $15.50 as a real possibility before it rallies back to all-time highs. If you want to chance an entry early, I would set my stop below the February top. That's still an 8% loss if it triggers, so again think about your risk tolerance.
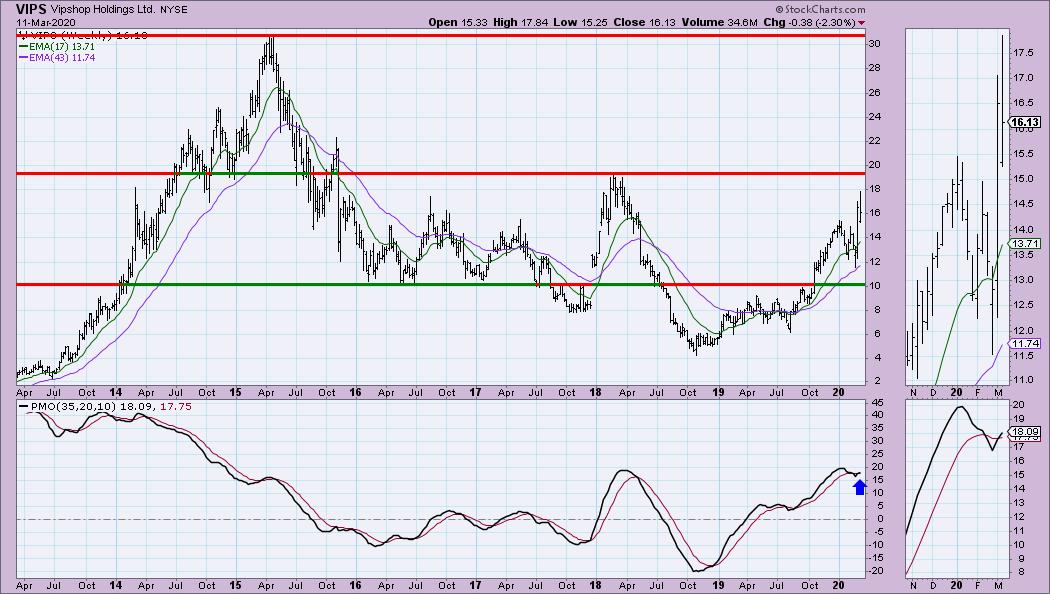
We are seeing a new PMO BUY signal shaping up on the weekly chart (it goes 'final' after trading on Friday). We saw a nice bounce off the 43-week EMA. It is now reaching stiff overhead resistance at $19.50, right at the 2018 top.
Current Market Outlook:
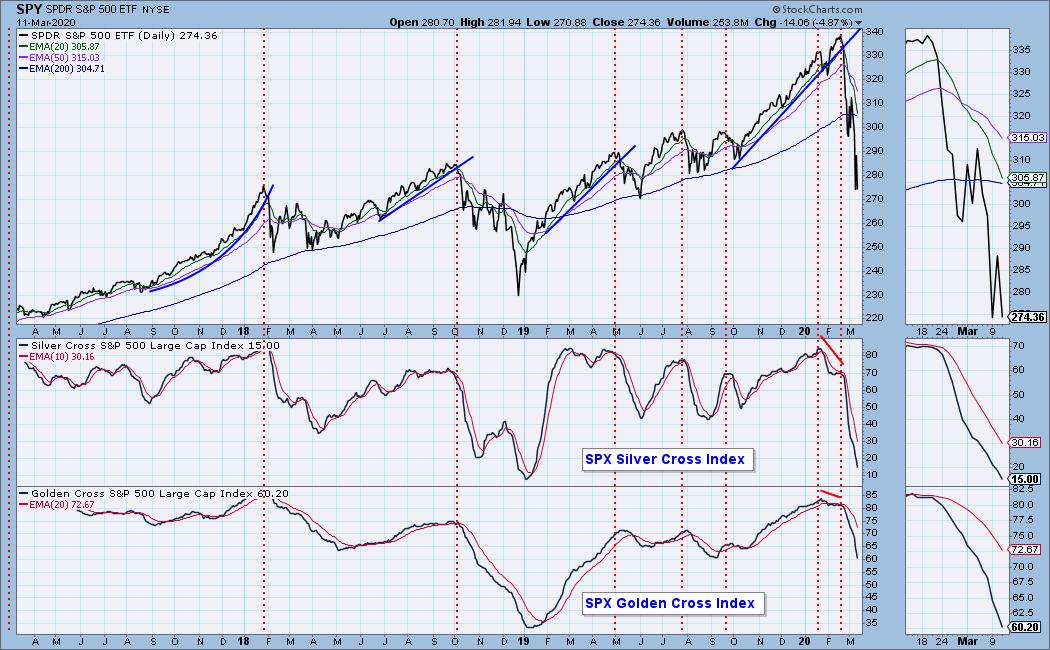
Market Environment: It is important to consider the odds for success. The Silver Cross Index measures the percentage of stocks on IT Trend Model BUY signals (20-EMA > 50-EMA), while the Golden Cross Index measures the percentage of stocks on LT Trend Model BUY signals (50-EMA > 200-EMA). Don't forget that as a "Diamonds" member, you have access to our GCI/SCI curated ChartList on DecisionPoint.com. You'll find it under "Members Only" links on the left side on the Blogs and Links Page. Here are the current percentages on the Silver and Golden Cross Indexes:
Diamond Index:
- Diamond Scan Results: 0
- Diamond Dog Scan Results: 2
- Diamond Bull/Bear Ratio: 0.00
For a more comprehensive review of current market conditions as well as analysis of Dollar, Gold, Oil and Bonds, subscribe to the DecisionPoint Alert! For a LIMITED TIME you can get a coupon code that will give you a discount for bundling your Diamonds subscription with the DecisionPoint Alert! Contact support@decisionpoint.com for more details.
Full Disclosure: I do not own any of the stocks above. I'm currently 80% in cash.

Erin Swenlin will be presenting at the The MoneyShow Las Vegas May 11-13, 2020! You'll have an opportunity to meet Erin and discuss the latest DecisionPoint news and Diamond Scans. Claim your FREE pass here! You can watch online with this pass too!!
Watch the latest episode of DecisionPoint with Carl & Erin Swenlin LIVE on Mondays 5:00p EST or on the StockCharts TV YouTube channel here!
Technical Analysis is a windsock, not a crystal ball.
Happy Charting!
- Erin
erinh@stockcharts.com
NOTE: The stocks reported herein are from mechanical trading model scans that are based upon moving average relationships, momentum and volume. DecisionPoint analysis is then applied to get five selections from the scans. The selections given should prompt readers to do a chart review using their own analysis process. This letter is not a call for a specific action to buy, sell or short any of the stocks provided. There are NO sure things or guaranteed returns on the daily selection of "diamonds in the rough."
Helpful DecisionPoint Links:
DecisionPoint Shared ChartList and DecisionPoint Chart Gallery
Price Momentum Oscillator (PMO)
Swenlin Trading Oscillators (STO-B and STO-V)
For more links, go to DecisionPoint.com!