
Again a relief to have 'reader request' Thursday. I decided to add one of my own as well as take a look at the only stock that was up today in the S&P 500. We are in panic mode in the market (like I need to tell you that). I highly recommend staying out and building a solid watch list. I believe DP DIAMONDS fit the bill. While we wade through the destruction, Diamonds will continue to provide insight through many teachable chart reviews. I'm keeping track of prior Diamonds and I'll be honing it down. While I don't want to manage a portfolio for Diamonds, I think it would be helpful to at least see when they hit targets or stops. The brightest spot in the historical Diamonds ChartList remains INO which a reader requested I revisit.
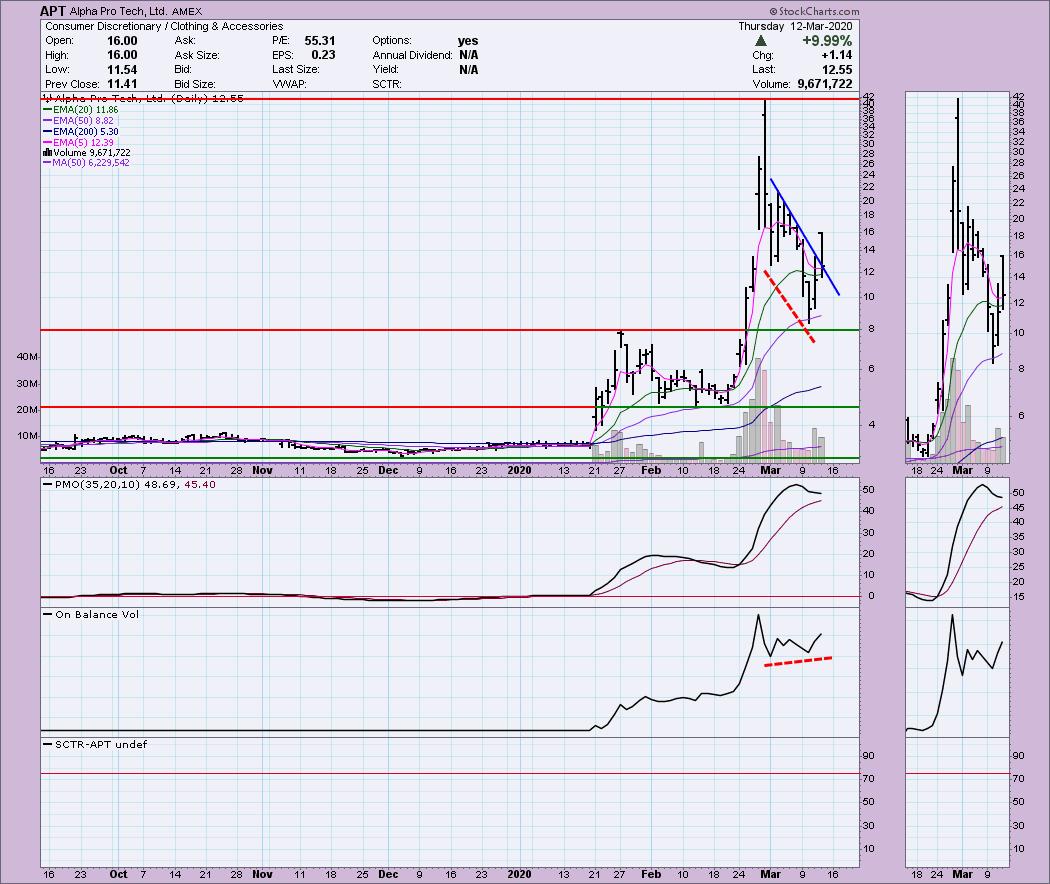
Alpha Pro Tech Ltd (APT) - Earnings: 5/6/2020 (BMO)
I want to preface some of these stock charts. I don't regularly use a log scale as Carl and I feel that drawing trendlines on log scale charts is nonsensical. However, many times I need to see stocks on the log scale to make out price moves. I did draw a declining trendline, but that is accurate based on my arithmetic scale. There was a breakout today, but the close brought price back to the declining trendline. The PMO is beginning to turn up and we can see that price has seen much higher prices just since the end of February. The very bright spot on the chart is the positive divergence between price and the OBV.
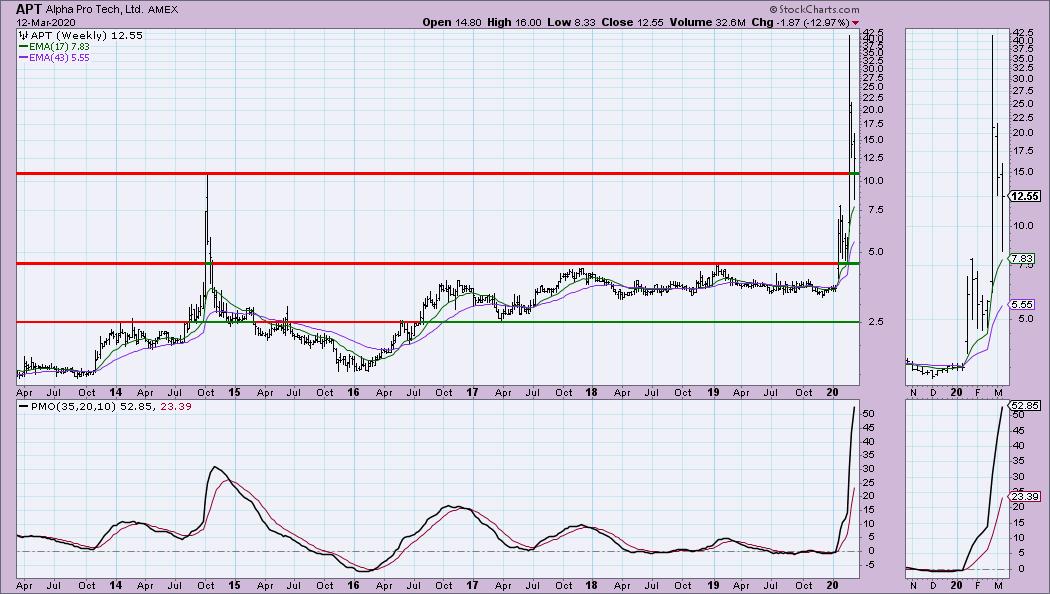
Price has pulled back considerably, but overall the PMO is still rising strongly. It's an interesting play, but a very volatile one (of course, most are in this environment).
Welcome to DecisionPoint Daily Diamonds, wherein I highlight five "diamonds in the rough." These are selected from the results of my DecisionPoint scans, which search for stocks that could benefit from the trend and condition of the market. Remember, these are not recommendations to buy or sell, but are the most interesting of the stocks that surfaced in my scans. My objective is to save you the work of the initial, tedious culling process, but you need to apply your own analysis to see if these stocks pique your interest as well. There are no guaranteed winners here!
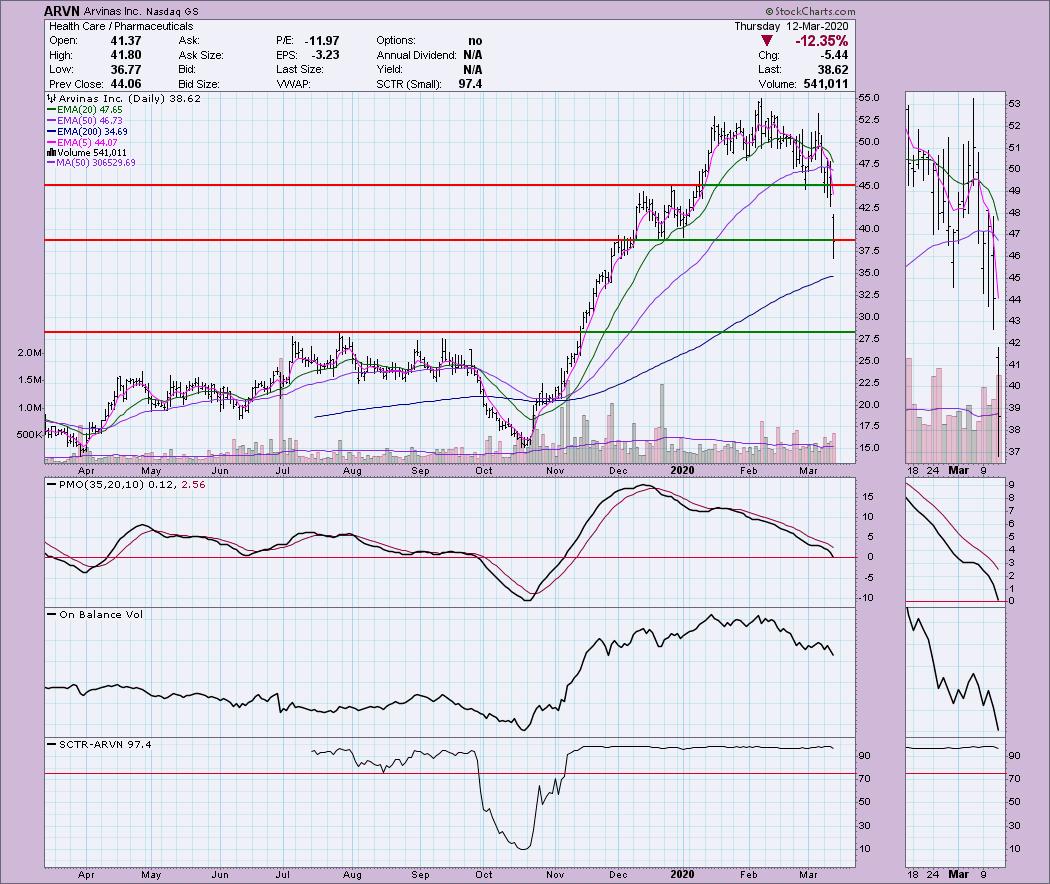
Arvinas Inc (ARVN) - Earnings: 3/24/2020 (AMC)
Price managed to close on at important support level after breaking down below it. It will be interesting to see if it can hold that level. I would add this to my watch list. We could see this one move even lower to test the 200-EMA or even the summer 2019 tops. It is in the pharma space which could recover sooner than most.
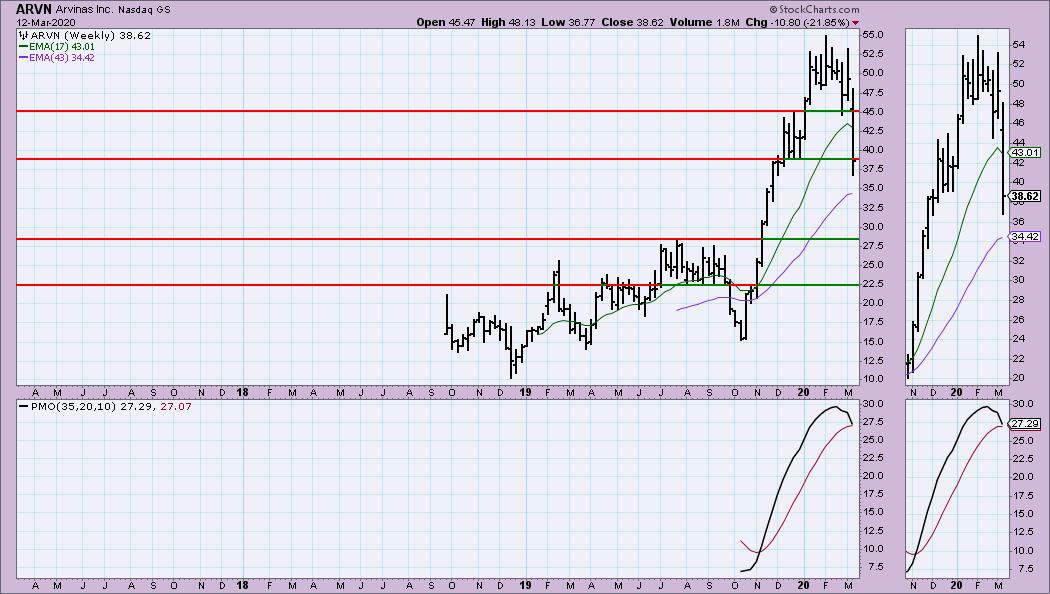
The weekly PMO is ugly but there isn't much data on this one yet.
Don't forget, on Thursdays I look at reader-requested symbols, so shoot me an email at erin@decisionpoint.com. I read every email I receive and try to answer them all!
Inovio Pharmaceuticals Inc (INO) - Earnings: 3/12/2020 (AMC)
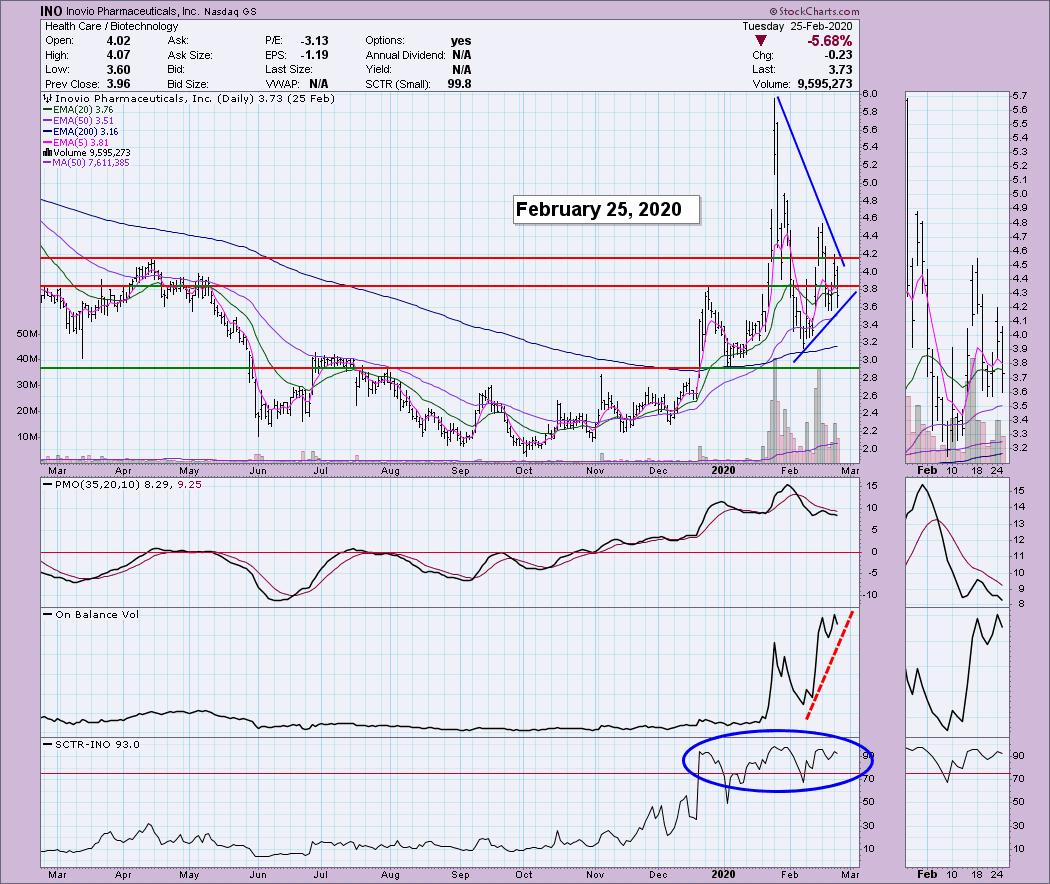
This is a revisit. I published this Diamond on February 25th. Below is the chart I presented that day. The positives are clear. The PMO was failing, but we were already beginning to see some volume action as the OBV confirmed.
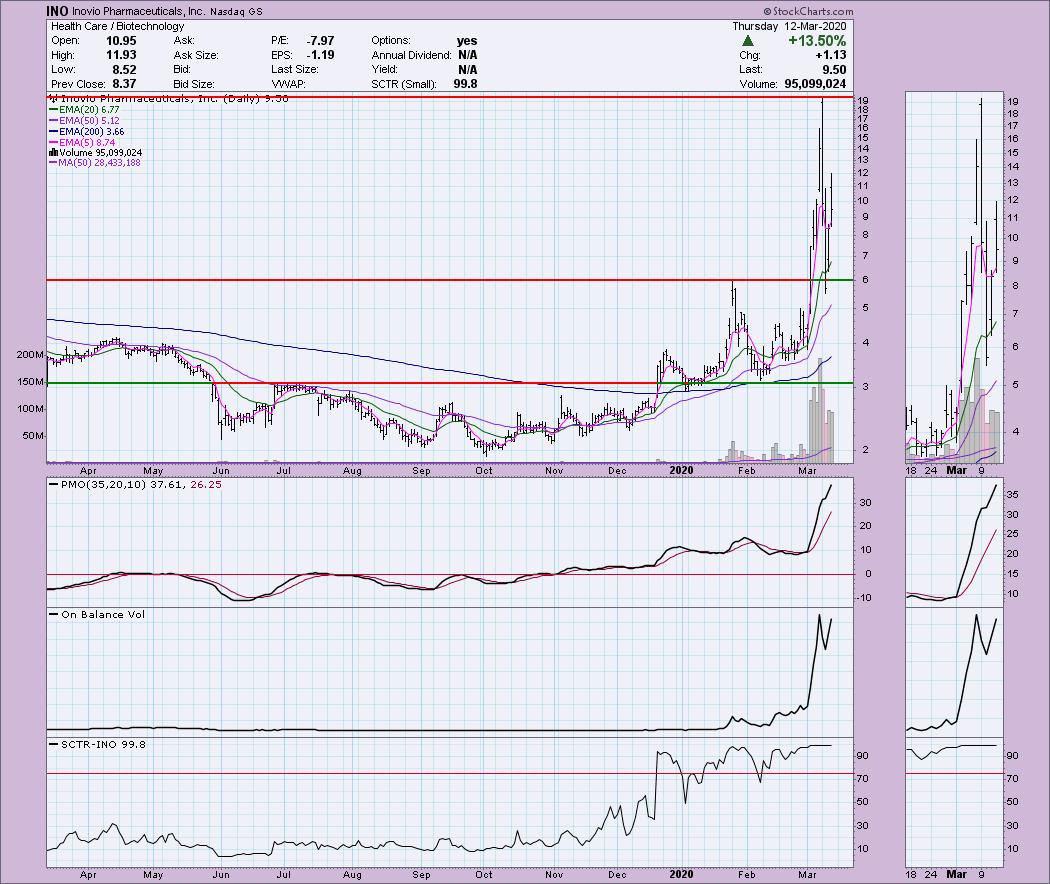
I'm using a log scale chart on today's chart because the rise was so quick you couldn't see the price action. The important support level right now would be $6. That is where the risk is. A drop to strong support would take out 1/3 of your profit. However, it is enticing given the highs at $19. A small position might be worthwhile given we did see a pullback. I also know that this is one of the companies that the government is working with on the vaccines for coronavirus.
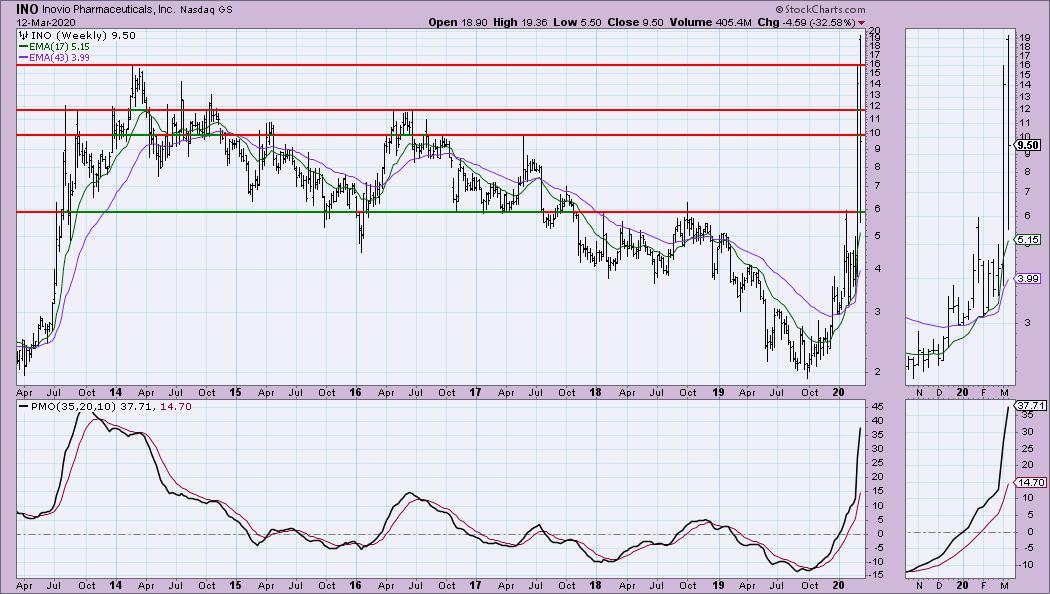
The price levels we're seeing right now are not unprecidented as we can see on the log scale weekly chart. I still believe the $6 level is key. A small position size might be a possibility depending on your risk profile.
Kroger Co (KR) - Earnings: 6/18/2020 (BMO)
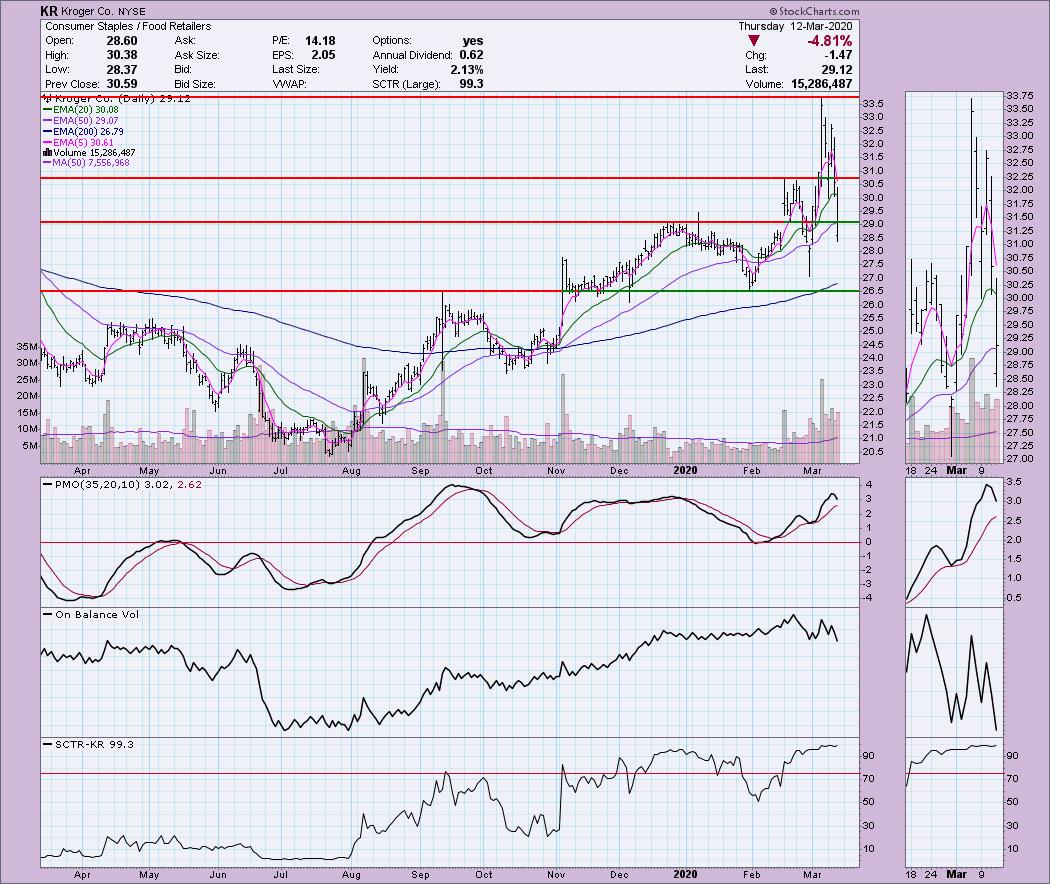
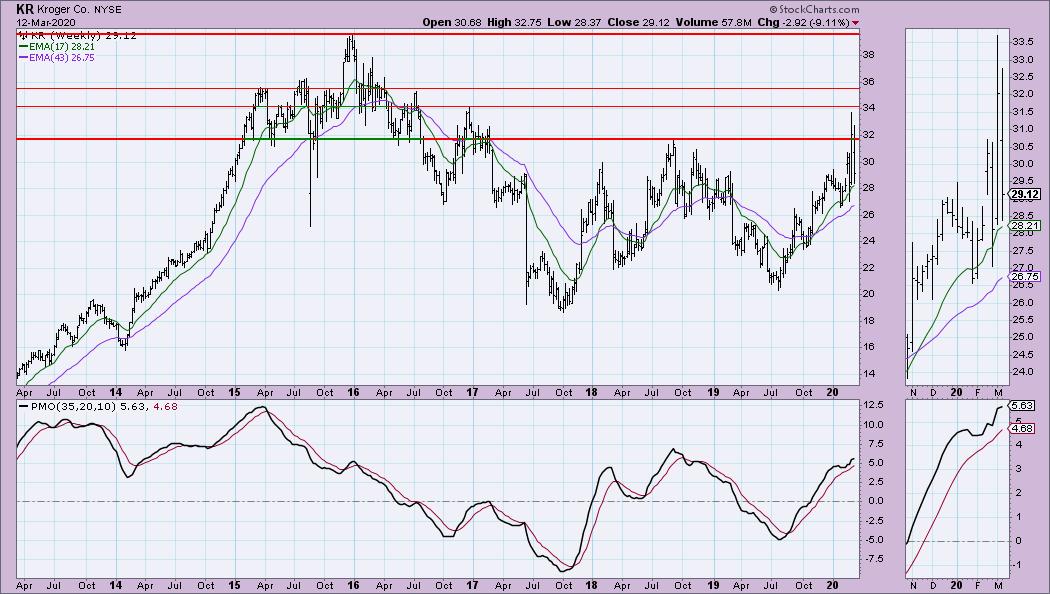
Mary Ellen McGonagle of MEM Investment Research (meminvestmentresearch.com) and I discussed Kroger at the end of our WealthWise Women show today. It is one of the few 'winners', if you will as the EMAs are still configured positively (5-EMA > 20-EMA > 50-EMA > 200-EMA). The PMO has topped right now, but price although dropping below support, managed to close on it. The OBV isn't great, but it does rank high within the large-cap space based on the SCTR. I think it may need to test support at $26.50. Grocery chains are interesting. While demand is high for their products, it will be interesting to see how they handle self-quarantines and fewer in-store shoppers. If they have good online delivery services that entice, we could see them win during the coronavirus containment process.
The weekly chart is quite favorable. It did get above the 2018 top, but it has since dropped below. The PMO is decelerating, but still rising.
Occidental Petroleum Corp (OXY) - Earnings: 5/7/2020 (AMC)
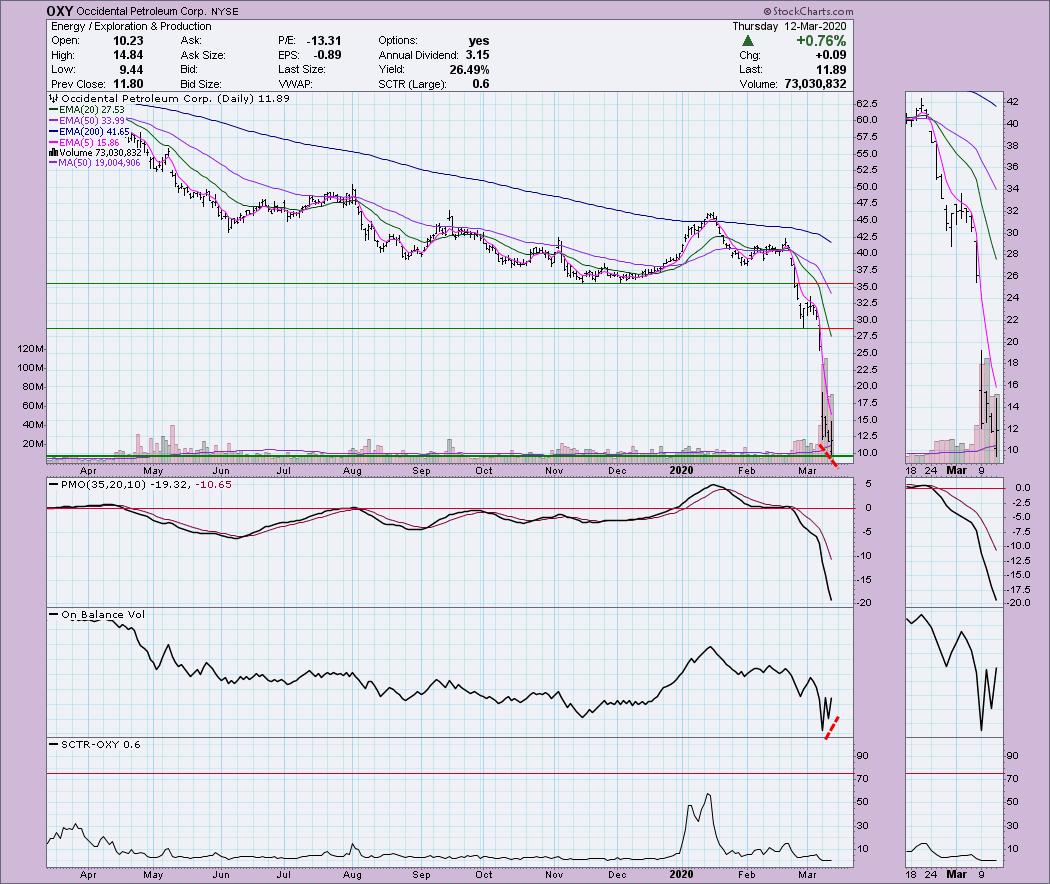
OXY was the only gainer in the S&P 500 so I decided we should take a look. It is in a very depressed sector and industry group, so I'm not really tempted. The daily chart is ugly except for the positive divergence on the OBV.
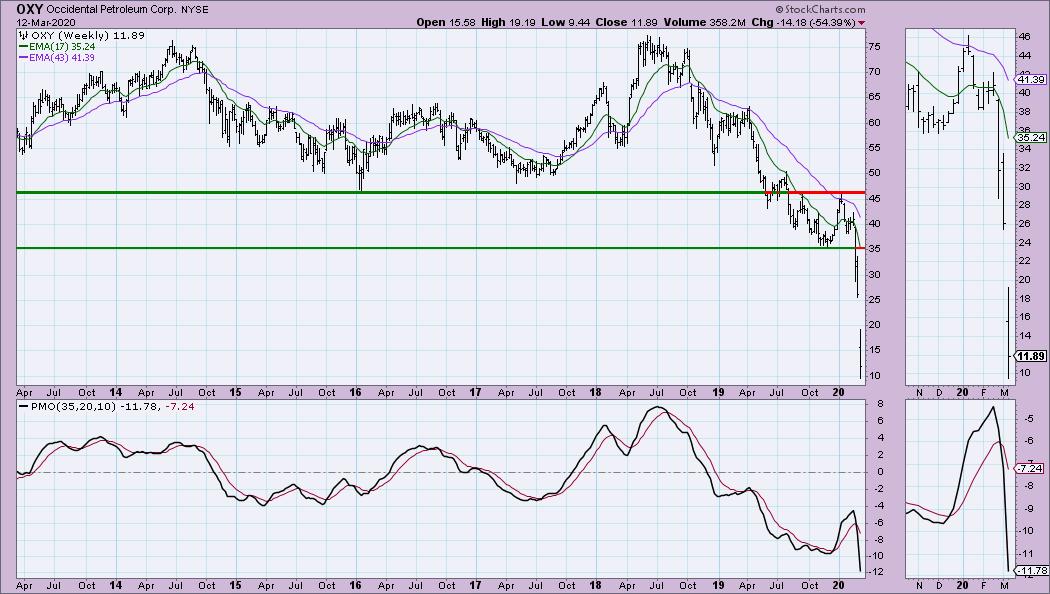
The weekly chart shows no evidence of support available. So, I've included the monthly chart below the weekly for your review. Don't think that this is a foundation at $10.
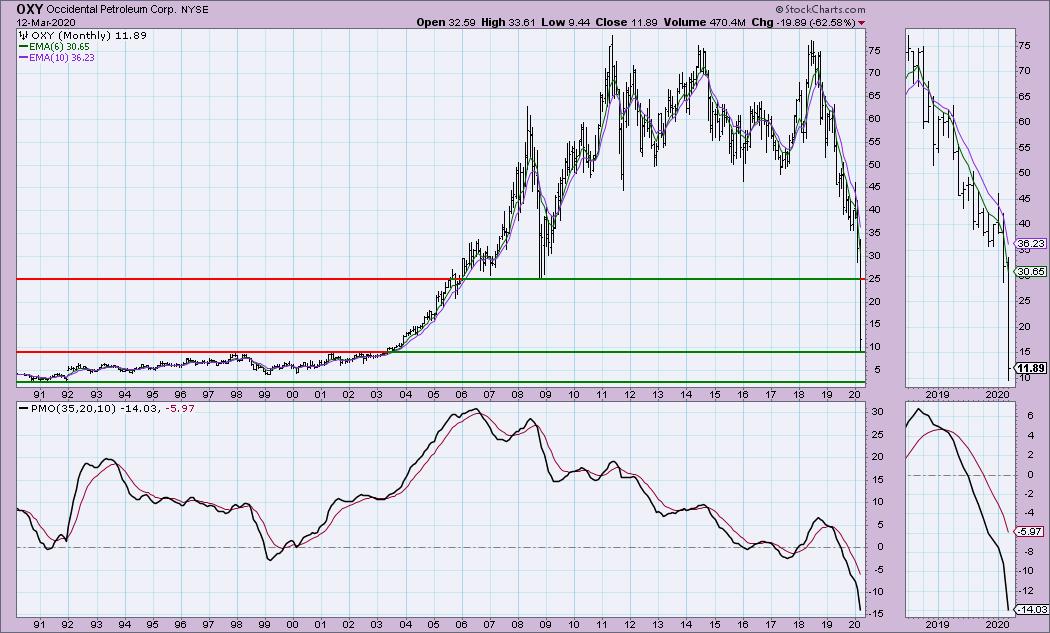
The monthly chart shows that we are at historic price lows. We haven't seen these levels since 2003. The lowest price? $2.00. That's very risky with price sitting at nearly $12, so don't let the fact that it had a good day sway you unless you are ready to take that possible hit.
Current Market Outlook:
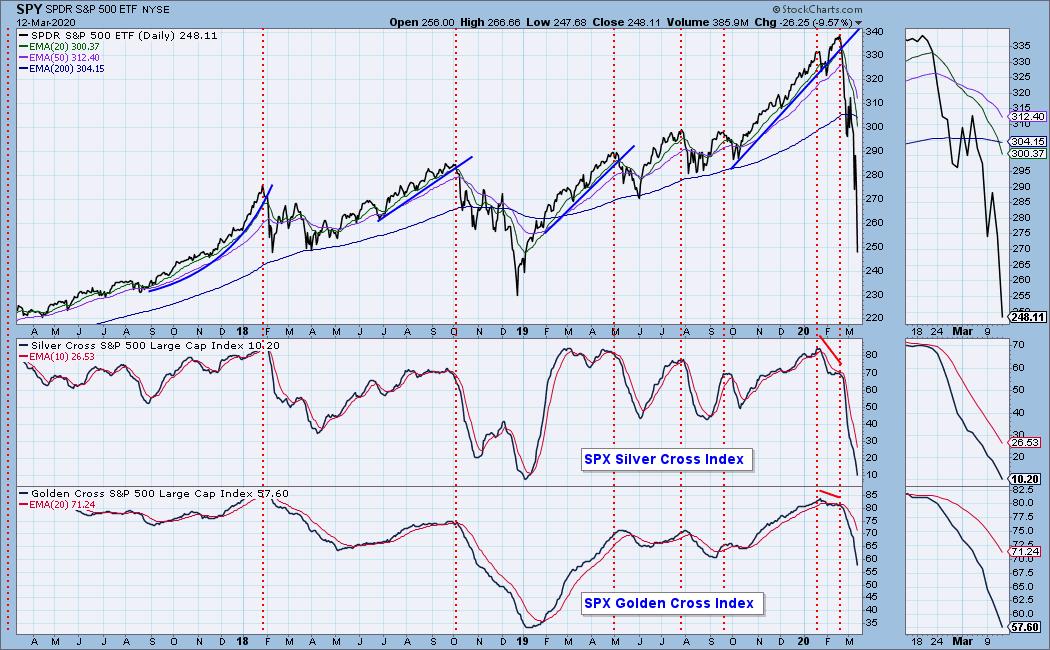
Market Environment: It is important to consider the odds for success. The Silver Cross Index measures the percentage of stocks on IT Trend Model BUY signals (20-EMA > 50-EMA), while the Golden Cross Index measures the percentage of stocks on LT Trend Model BUY signals (50-EMA > 200-EMA). Don't forget that as a "Diamonds" member, you have access to our GCI/SCI curated ChartList on DecisionPoint.com. You'll find it under "Members Only" links on the left side on the Blogs and Links Page. Here are the current percentages on the Silver and Golden Cross Indexes:
Diamond Index:
- Diamond Scan Results: 0
- Diamond Dog Scan Results: 1
- Diamond Bull/Bear Ratio: 0.00
For a more comprehensive review of current market conditions as well as analysis of Dollar, Gold, Oil and Bonds, subscribe to the DecisionPoint Alert! For a LIMITED TIME you can get a coupon code that will give you a discount for bundling your Diamonds subscription with the DecisionPoint Alert! Contact support@decisionpoint.com for more details.
Full Disclosure: I do not own any of the stocks above. I'm currently 85% in cash with holdings remaining in mostly defensive groups and silver.

Erin Swenlin will be presenting at the The MoneyShow Las Vegas May 11-13, 2020! You'll have an opportunity to meet Erin and discuss the latest DecisionPoint news and Diamond Scans. Claim your FREE pass here! You can watch online with this pass too!!
Watch the latest episode of DecisionPoint with Carl & Erin Swenlin LIVE on Mondays 5:00p EST or on the StockCharts TV YouTube channel here!
Technical Analysis is a windsock, not a crystal ball.
Happy Charting!
- Erin
erinh@stockcharts.com
NOTE: The stocks reported herein are from mechanical trading model scans that are based upon moving average relationships, momentum and volume. DecisionPoint analysis is then applied to get five selections from the scans. The selections given should prompt readers to do a chart review using their own analysis process. This letter is not a call for a specific action to buy, sell or short any of the stocks provided. There are NO sure things or guaranteed returns on the daily selection of "diamonds in the rough."
Helpful DecisionPoint Links:
DecisionPoint Shared ChartList and DecisionPoint Chart Gallery
Price Momentum Oscillator (PMO)
Swenlin Trading Oscillators (STO-B and STO-V)
For more links, go to DecisionPoint.com!