
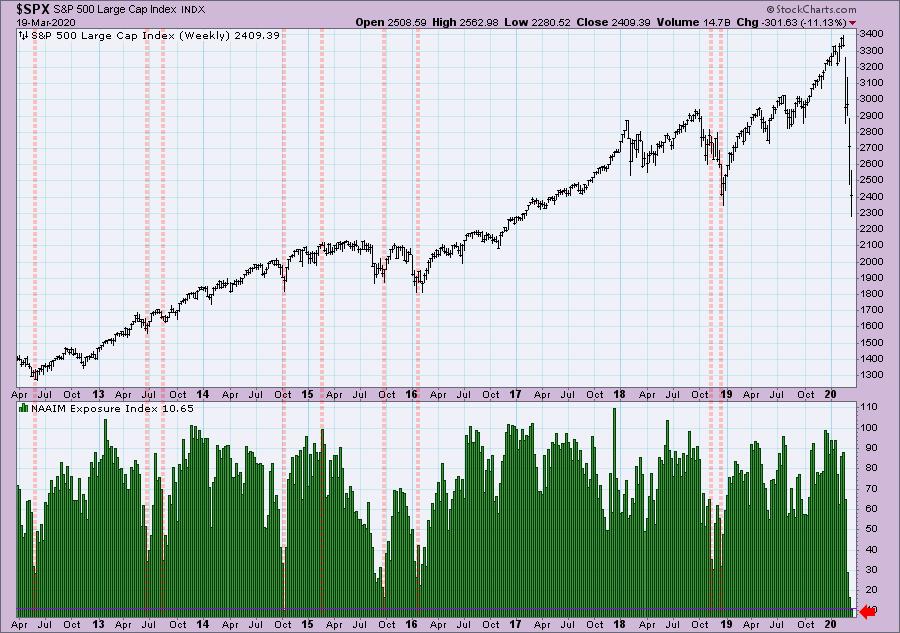
Today we received the exposure results from the National Association of Active Investment Managers (NAAIM). These are managers that base most of their investing on technical indicators. This is a great yardstick not only for what individual investors may want to model, but also for sentiment extremes. Managers are barely exposing themselves to the market on the equity side right now which suggests to me to stay out a bit longer. However, I do note that we are at a bearish extreme that could imply a market bottom on the way. I can give you a sneak preview of my ChartWatchers article on sentiment by telling you that while sentiment is at bearish extremes, some of the sentiment indicators still aren't bearish enough. I'll share those charts tomorrow in the ChartWatchers blog on StockCharts.com. I will also send out a link to all of our subscribers when it has been posted, so watch your email.
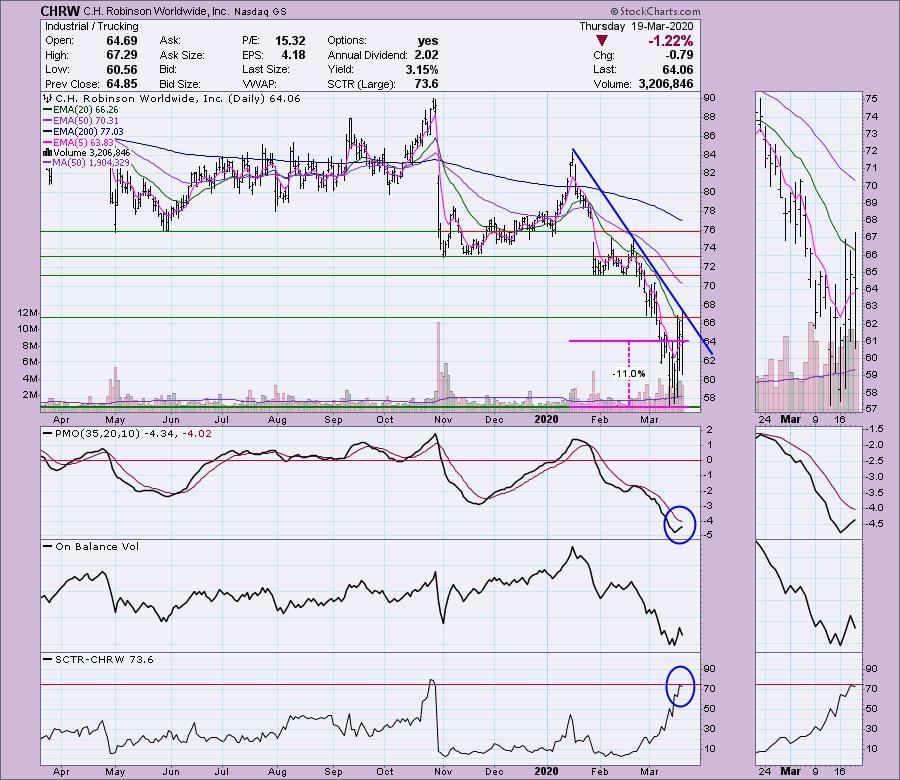
CH Robinson Worldwide Inc (CHRW) - Earnings: 4/28/2020 (AMC)
This is the Trucker that came to my attention in my Momentum Sleepers scan today. If you recall, yesterday I wrote about the Trucker industry and its new relative strength against the SPX. This one hasn't yet broken its declining trend yet and we are still looking at wide margins for setting stops. However, we have a PMO rising in oversold extremes and an improving SCTR. I'm not a fan of the OBV right now so all in all, I think this is a watch list candidate until we either get more pullback so I can set a better stop or a breakout from the declining bottoms trend line. A close above the 20-EMA would also be a good signal.
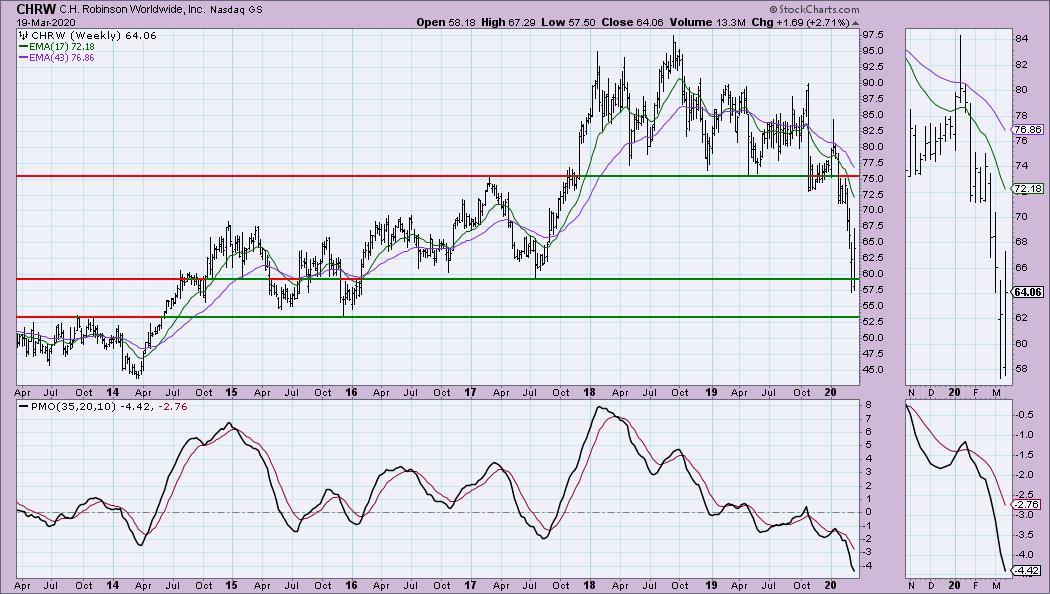
We aren't seeing what we want on the weekly PMO and there is another strong level of support that is lower. That level may need to be tested.
Welcome to DecisionPoint Daily Diamonds, wherein I highlight five "diamonds in the rough." These are selected from the results of my DecisionPoint scans, which search for stocks that could benefit from the trend and condition of the market. Remember, these are not recommendations to buy or sell, but are the most interesting of the stocks that surfaced in my scans. My objective is to save you the work of the initial, tedious culling process, but you need to apply your own analysis to see if these stocks pique your interest as well. There are no guaranteed winners here!
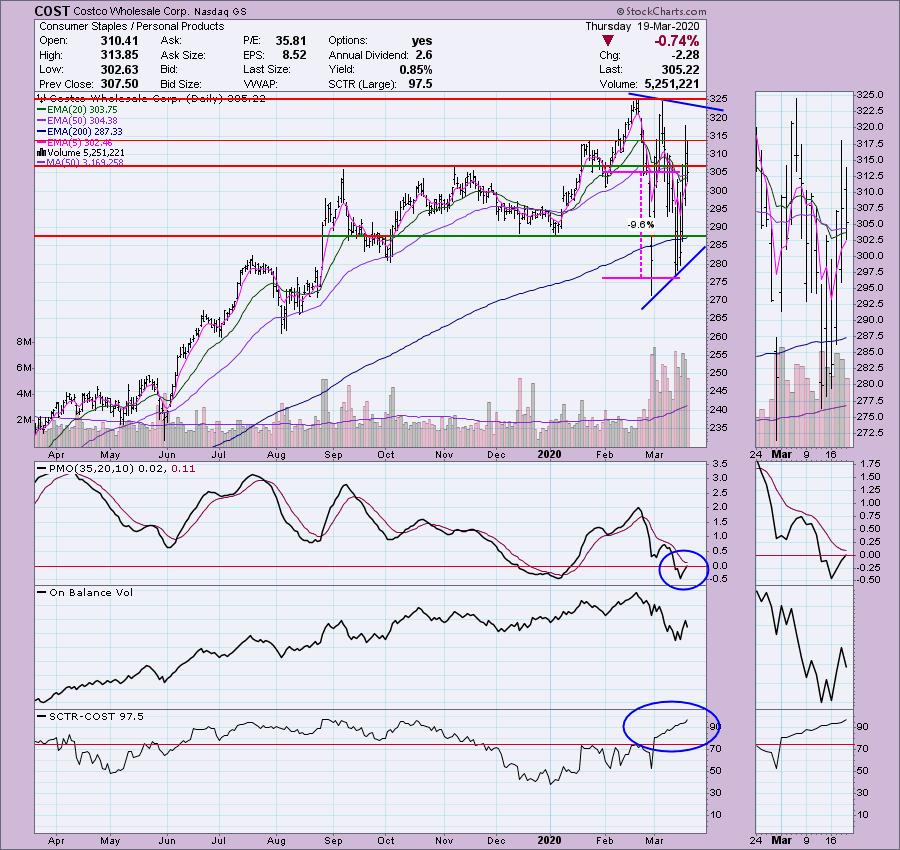
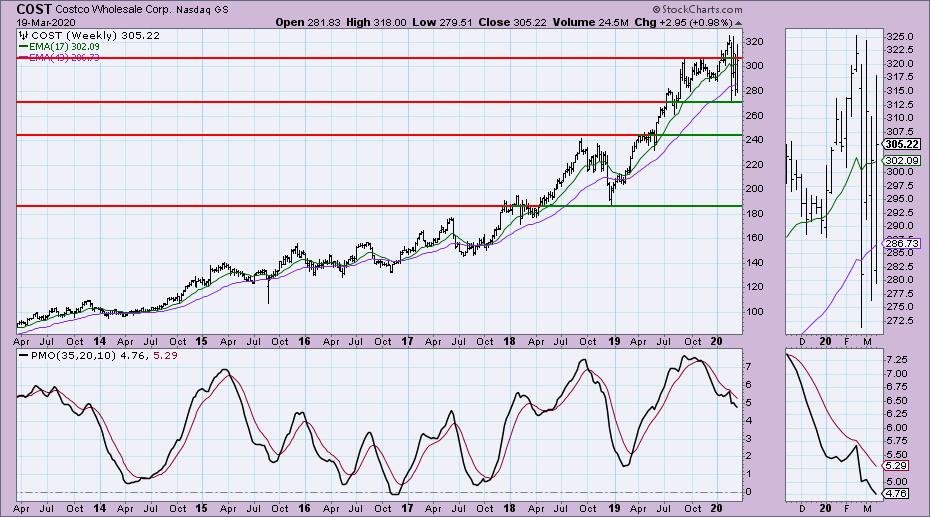
Costco Wholesale Corp (COST) - Earnings: 5/28/2020 (AMC)
I covered Costco two weeks ago in the Diamonds Report. It had closed around $311, so this is actually a more profitable area to get in. The PMO is turning up in oversold territory and we are seeing OBV bottoms beginning to rise somewhat. The SCTR remains very strong. You could also make a case for a symmetrical triangle which is a continuation pattern that would imply an upside breakout under normal conditions. Volatility is still a bit high for my taste here.
Intermediate-term support was tested at $270 and it so far is holding above it. I do have heartburn with the PMO as it has plenty of room to free fall before getting even remotely oversold.
Don't forget, on Thursdays I look at reader-requested symbols, so shoot me an email at erin@decisionpoint.com. I read every email I receive and try to answer them all!
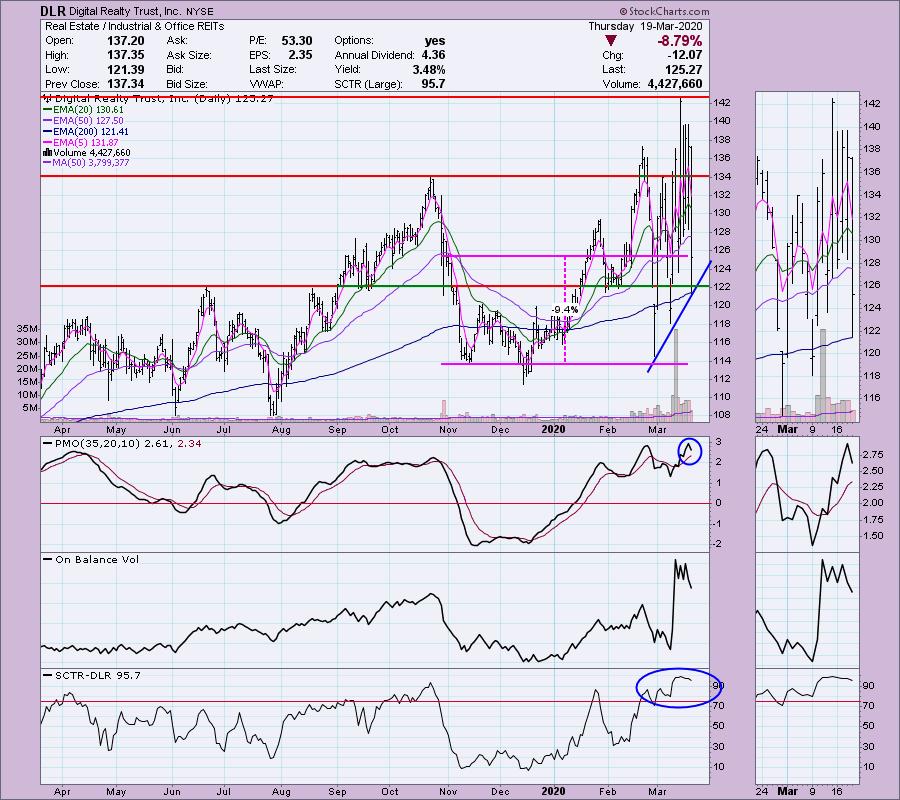
Digital Realty Trust Inc (DLR) - Earnings: 4/28/2020 (AMC)
I am completely avoiding Real Estate right now. I don't like how it is performing against the other sectors and I'm not seeing much in the way of scan results in Real Estate. The PMO, even if it were rising right now is very overbought. The OBV tops are falling in line with coordinating price tops. The SCTR is very high so it is technically outperforming other large-cap stocks. I'm not a fan of the volatility of course. The rising bottoms trendline is positive and holding the 200-EMA today is positive given the 8.79% drop.
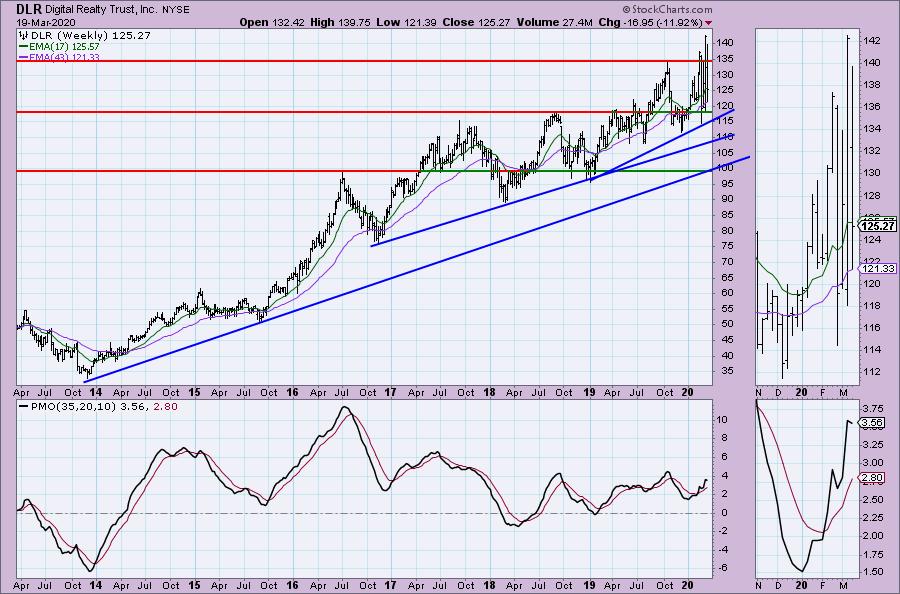
The weekly chart looks encouraging. The long-term rising trend hasn't been compromised and neither have the shorter-term rising trends. The PMO is ticking lower on this week's price action, but that isn't overly concerning.
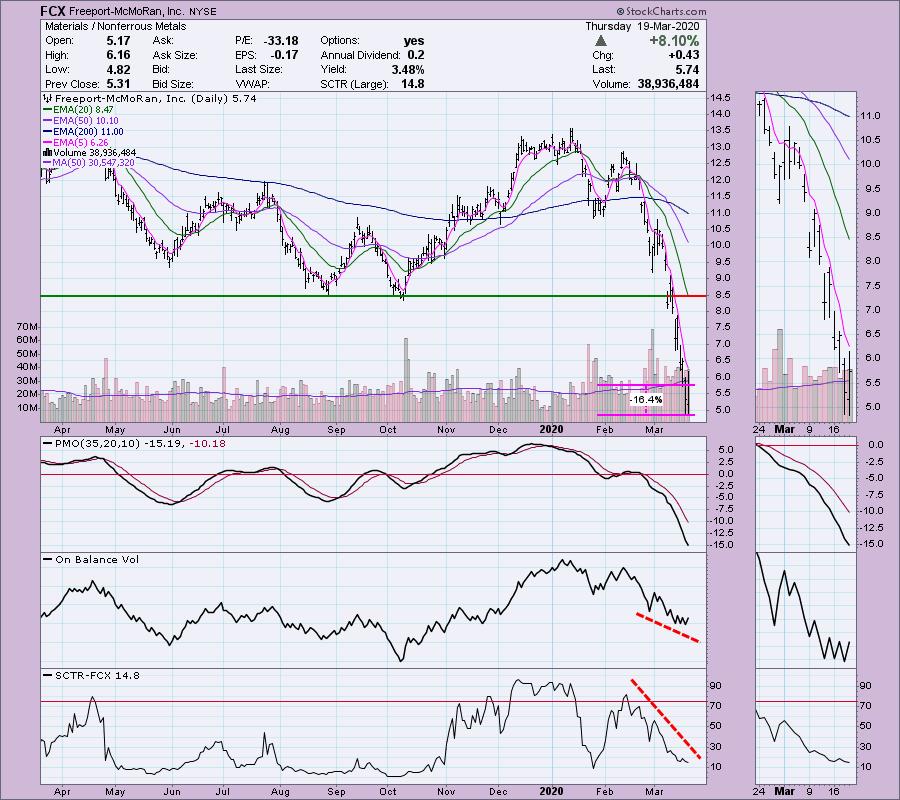
Freeport-McMoRan Inc (FCX) - Earnings: 4/23/2020 (BMO)
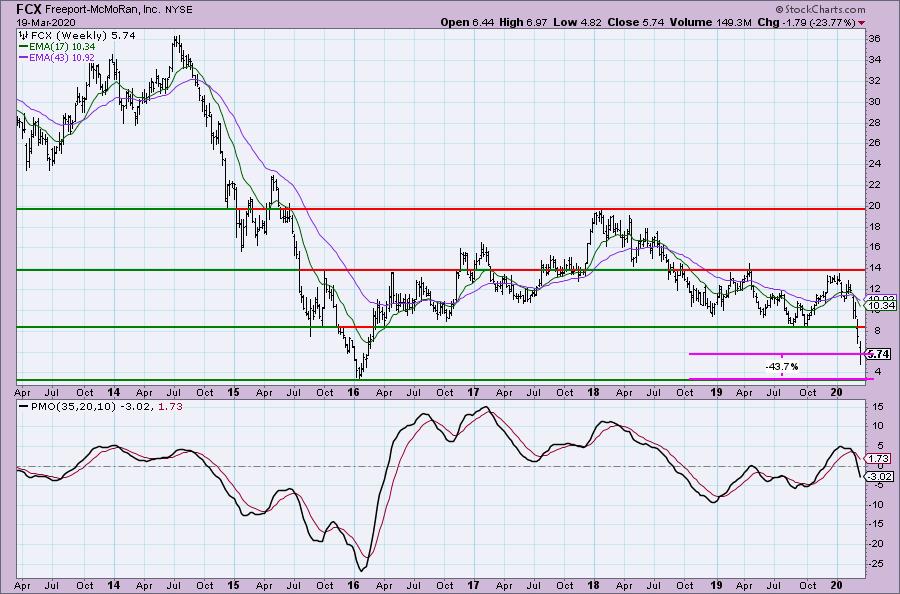
This would definitely be a bottom fishing expedition. One that I really can't recommend. Materials are getting hit hard. There are a few problems for me. One, the PMO hasn't begun to decelerate. Two, the OBV is not favorable. And finally three, the SCTR has been falling and not showing strength.
We haven't really seen the bottom here either. If price gets to support at the 2016 low, that might convince me. Based on the current closing price, it would be a 43% loss to get to that support level. The weekly PMO isn't oversold enough either.
Walgreens Boots Alliance Inc (WBA) - Earnings: 4/2/2020 (BMO)
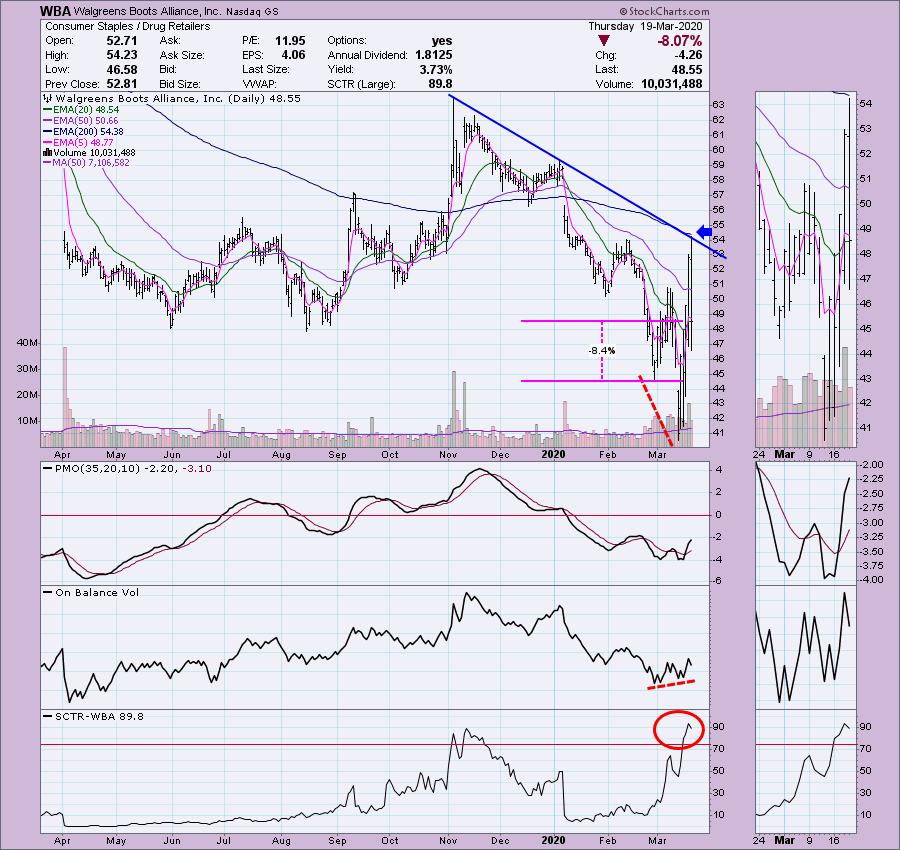
The declining trend hasn't been broken yet, but we did have another close above the 20-EMA. There is a bullish divergence on the OBV and we do have a PMO BUY signal. You could set a reasonable stop at the February low. The SCTR is very high and suggests nice relative strength.
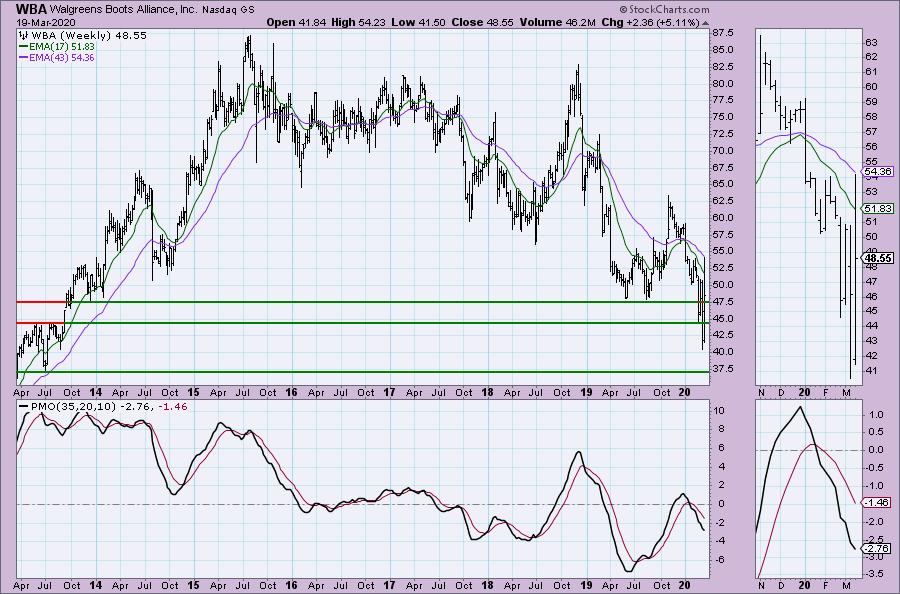
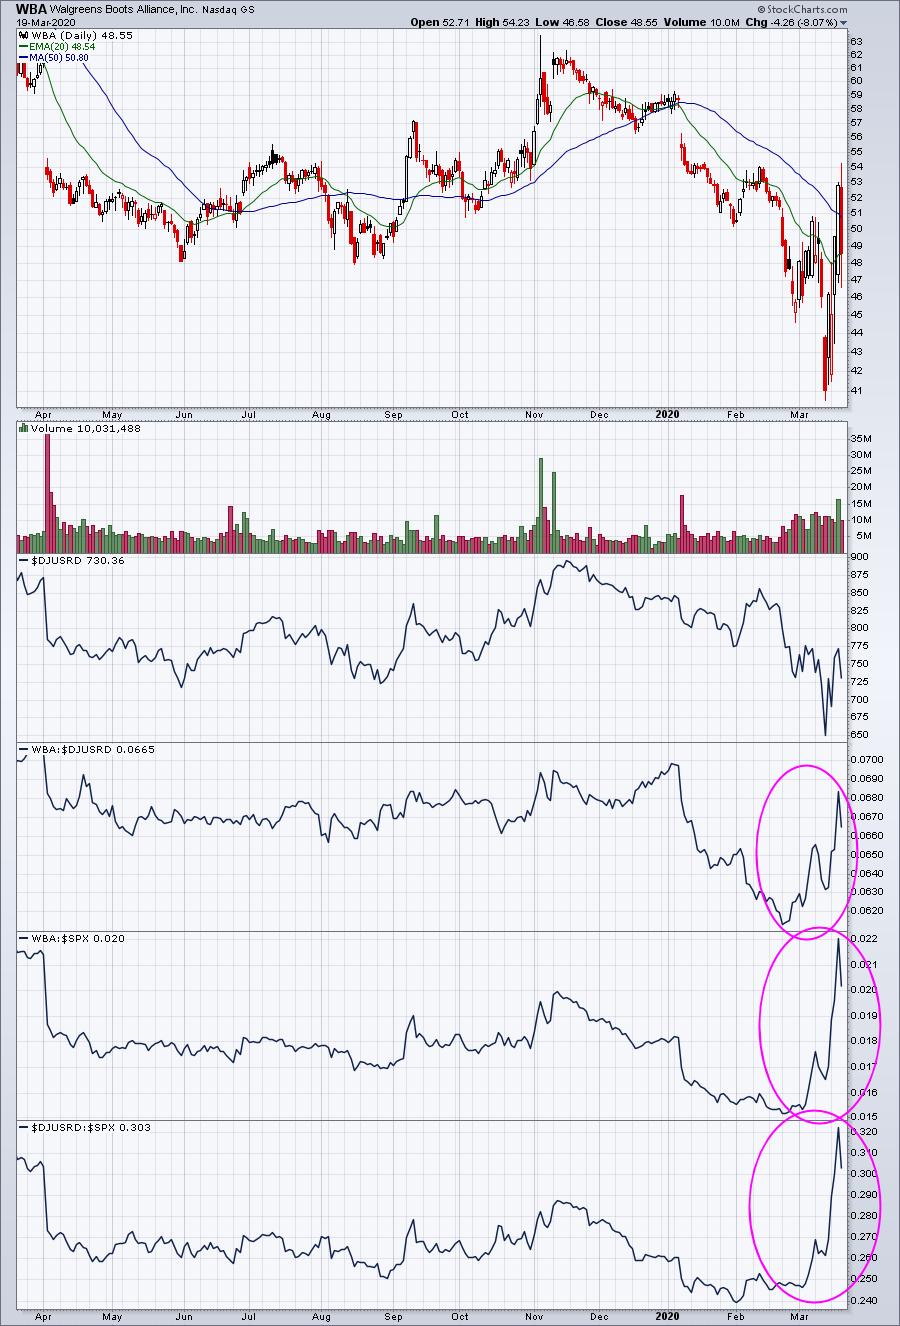
Another one that I am leery of given it hasn't really tested the strong support area at $37.50. The weekly PMO is decelerating slightly but hasn't actually switched positive. I do like this industry group and a quick peek at a relative strength chart (below the weekly chart) shows that WBA is showing overall relative strength along with its sector and industry group.
Current Market Outlook:
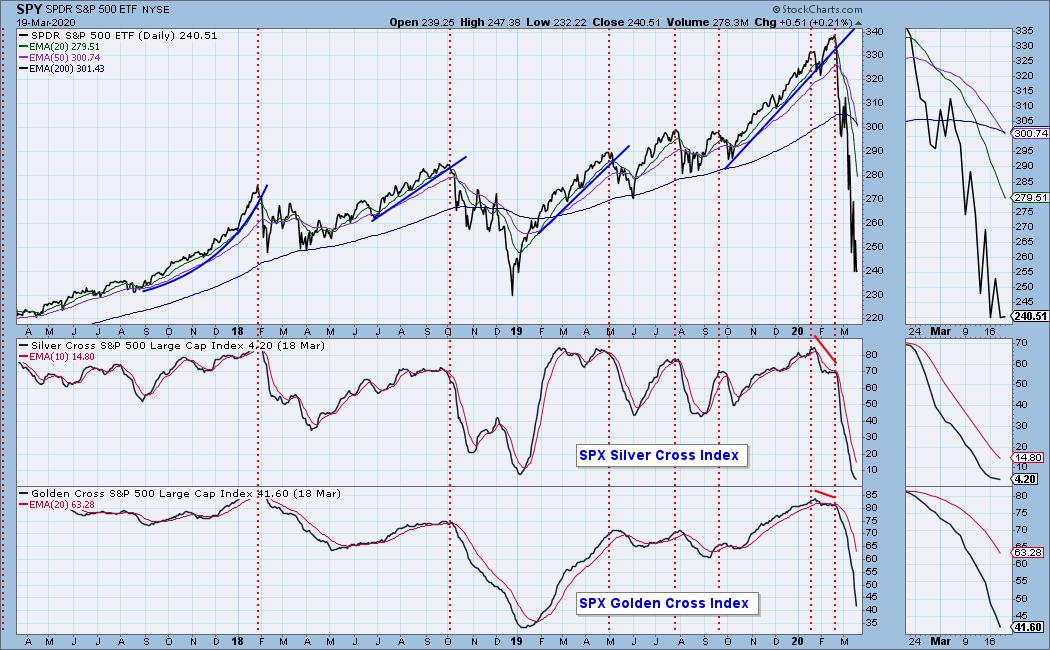
Market Environment: It is important to consider the odds for success. The Silver Cross Index measures the percentage of stocks on IT Trend Model BUY signals (20-EMA > 50-EMA), while the Golden Cross Index measures the percentage of stocks on LT Trend Model BUY signals (50-EMA > 200-EMA). Don't forget that as a "Diamonds" member, you have access to our GCI/SCI curated ChartList on DecisionPoint.com. You'll find it under "Members Only" links on the left side on the Blogs and Links Page. Here are the current percentages on the Silver and Golden Cross Indexes:
Diamond Index:
- Diamond Scan Results: 1
- Diamond Dog Scan Results: 0
- Diamond Bull/Bear Ratio: 0.00
For a more comprehensive review of current market conditions as well as analysis of Dollar, Gold, Oil and Bonds, subscribe to the DecisionPoint Alert! For a LIMITED TIME you can get a coupon code that will give you a discount for bundling your Diamonds subscription with the DecisionPoint Alert! Contact support@decisionpoint.com for more details.
Full Disclosure: I do not own any of the stocks above. I'm currently 80% in cash.

Erin Swenlin will be presenting at the The MoneyShow Las Vegas May 11-13, 2020! You'll have an opportunity to meet Erin and discuss the latest DecisionPoint news and Diamond Scans. Claim your FREE pass here! You can watch online with this pass too!!
Watch the latest episode of DecisionPoint with Carl & Erin Swenlin LIVE on Mondays 5:00p EST or on the StockCharts TV YouTube channel here!
Technical Analysis is a windsock, not a crystal ball.
Happy Charting!
- Erin
erinh@stockcharts.com
NOTE: The stocks reported herein are from mechanical trading model scans that are based upon moving average relationships, momentum and volume. DecisionPoint analysis is then applied to get five selections from the scans. The selections given should prompt readers to do a chart review using their own analysis process. This letter is not a call for a specific action to buy, sell or short any of the stocks provided. There are NO sure things or guaranteed returns on the daily selection of "diamonds in the rough."
Helpful DecisionPoint Links:
DecisionPoint Shared ChartList and DecisionPoint Chart Gallery
Price Momentum Oscillator (PMO)
Swenlin Trading Oscillators (STO-B and STO-V)
For more links, go to DecisionPoint.com!