
There were overlaps among readers and myself as far as requests. I was going to cover two of those that were requested! Many charts are currently showing bullish "V" Bottoms. The calculation on whether these pattern have executed is to watch for a 38.2% retracement off the low of the pattern. That is one of the Fibonacci levels that you can annotate on StockCharts. I'll be adding the Fibonacci levels to all "V" Bottoms that I'm presented with. A word of caution, the expectation of these patterns is a move past the top of the "V"; however, under current bear market conditions it is important to follow the bear market "rule" that tells us to expect bearish conclusions. In essence, the confidence level on bullish patterns reaching targets is far less in a bear market environment. Full disclosure: I did take a position in GLD this morning which I covered in yesterday's Diamonds Report.
IMPORTANT NEWS! Mary Ellen McGonagle (MEMInvestmentResearch.com) and I are putting together a LIVE trading room next week online! I'll send out the information within this blog and in email. Watch us as we look for trades real-time and show you our methodology for trading.
Churchill Downs Inc (CHDN) - Earnings: 4/22/2020 (AMC)
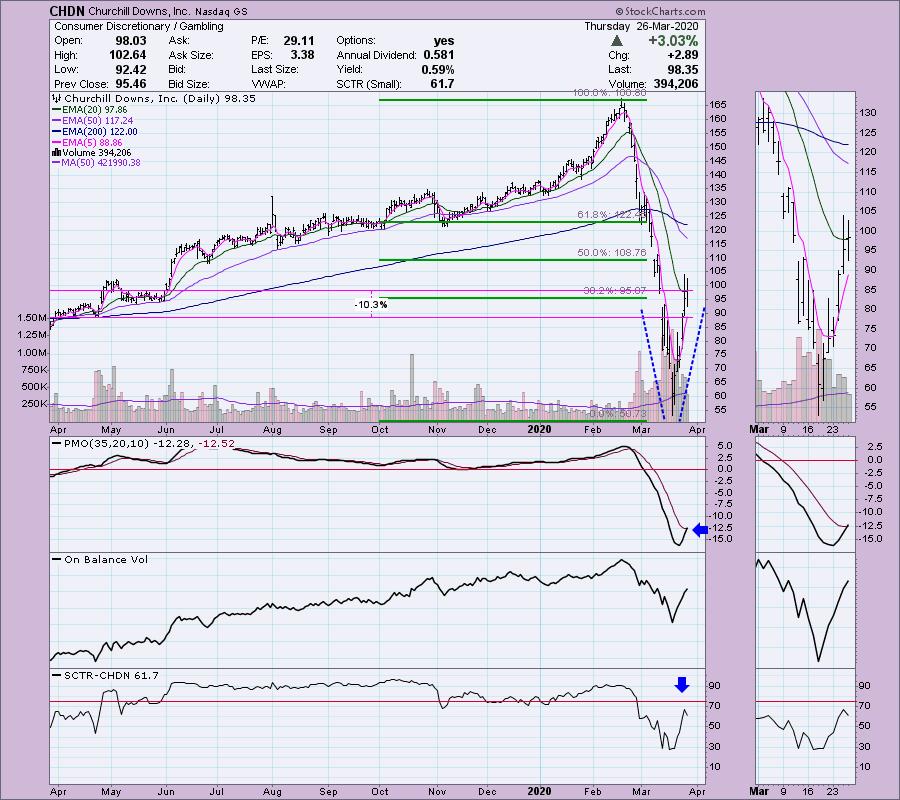
Reader Request: I've annotated the "V" bottom on this first chart, but don't on the others (you get the idea). Note the Fibonacci retracement lines. The 38.2% mark is basically where CHDN closed today. The PMO has triggered a BUY signal and price closed above the 20-EMA (barely) which is positive. Setting a stop on this one is tricky as volatility has been extreme. A 10% stop would put you at support from the April 2019 lows. The SCTR has topped, but it is only a 'tick' lower.
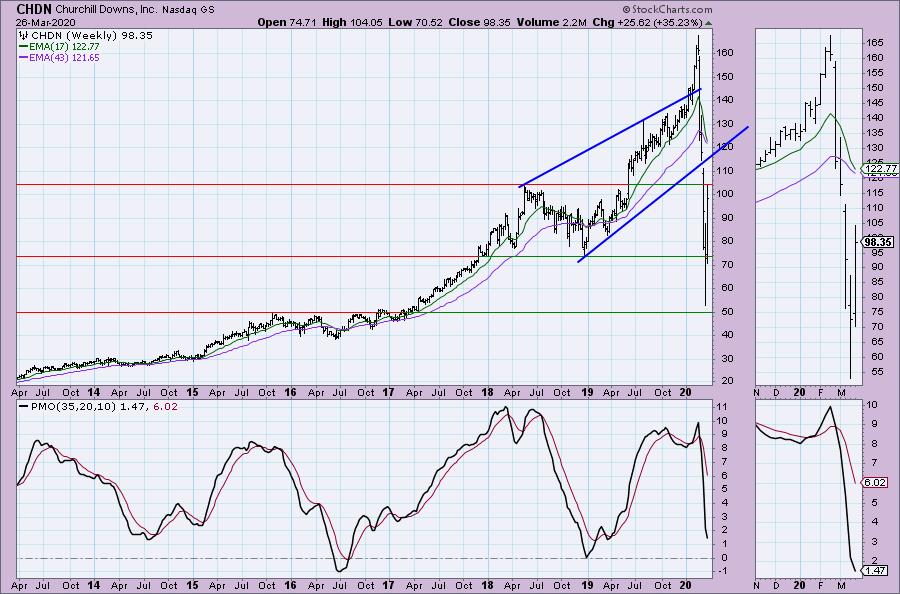
Important support was tested. Unlike the major market which hasn't tested its tops from 2015/2016, CHDN has and is now bouncing. We can see that the previous bearish rising wedge had a bullish resolution but that was quickly erased as the bear market began. The PMO is getting oversold, but isn't quite turning up yet.
Welcome to DecisionPoint Daily Diamonds, wherein I highlight five "diamonds in the rough." These are selected from the results of my DecisionPoint scans, which search for stocks that could benefit from the trend and condition of the market. Remember, these are not recommendations to buy or sell, but are the most interesting of the stocks that surfaced in my scans. My objective is to save you the work of the initial, tedious culling process, but you need to apply your own analysis to see if these stocks pique your interest as well. There are no guaranteed winners here!
Lululemon Athletica Inc (LULU) - Earnings: 3/26/2020 (AMC)
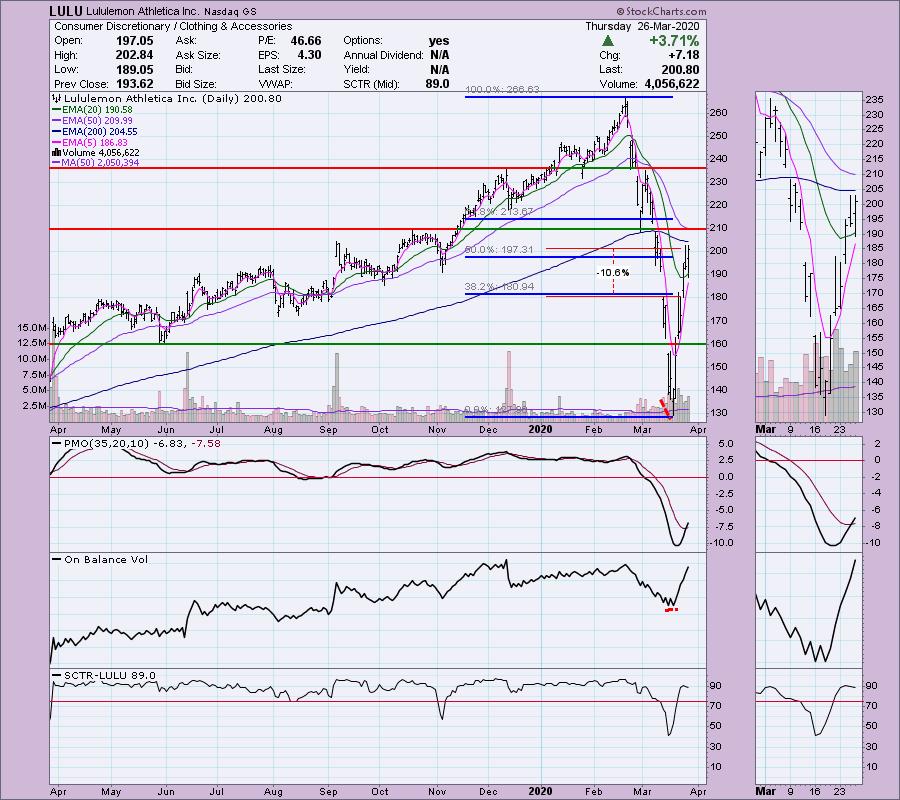
Reader Request: Despite gym closings, Lululemon is seeing an increase in price. Could be the opportunity to exercise at home or simply lounge in while in quarantine. You might want to take a look at FITB and Peloton (PTON) which are also looking bullish right now. LULU has already passed the 38% mark and has hit 50%. The expectation is still a move to test its all-time highs. The PMO has a new BUY signal and we see a small positive divergence between OBV bottoms and price bottoms that led this rally.
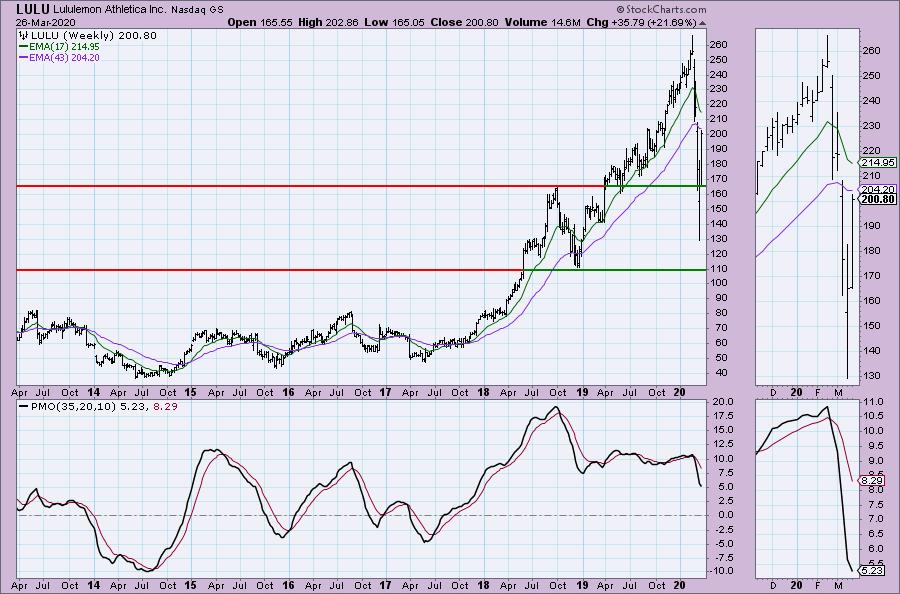
The weekly chart has a PMO in decline still, but it is decelerating. Note that while price did move down to the $130 level, it managed to close on support at the 2018 top. This suggests internal strength.
Don't forget, on Thursdays I look at reader-requested symbols, so shoot me an email at erin@decisionpoint.com. I read every email I receive and try to answer them all!
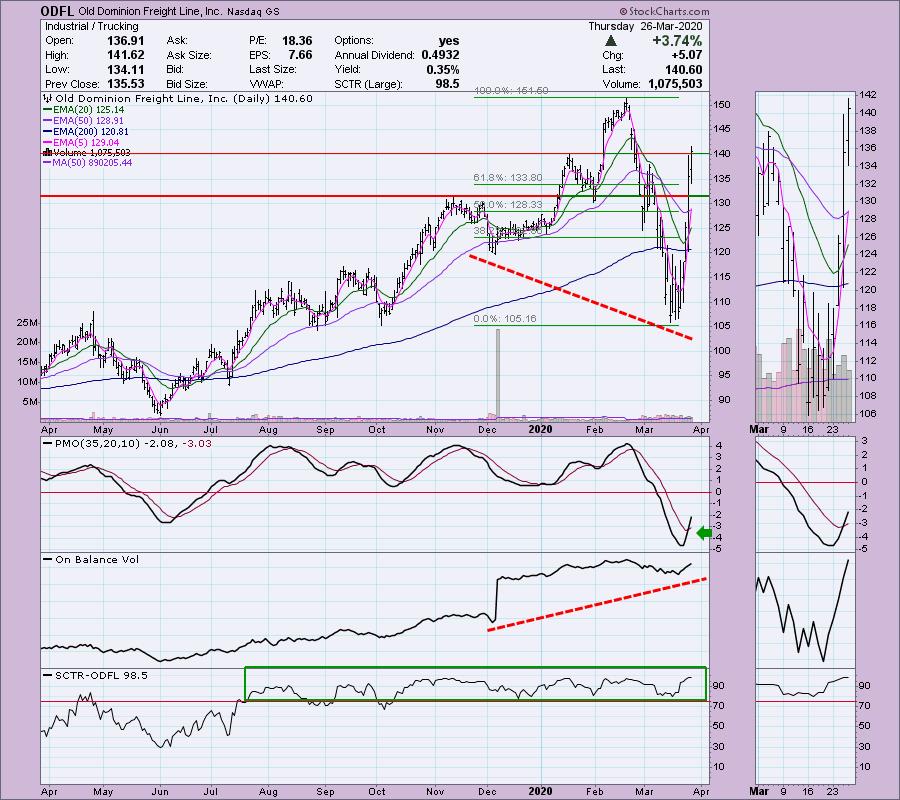
Old Dominion Freight Line Inc (ODFL) - Earnings: 4/23/2020 (BMO)
Reader Request and on my radar: On March 18, I noted that the Trucker industry group was showing excellent relative strength improvement and that it was an industry group to watch. While I didn't present ODFL, it has been on my radar. It certainly looks strong, I'm just unhappy its made most of its retracement so the pattern is finishing up. That doesn't mean it won't continue higher. There is a very nice OBV positive divergence showing up in the longer term. We have a PMO BUY signal that hit today. The SCTR remains strong.
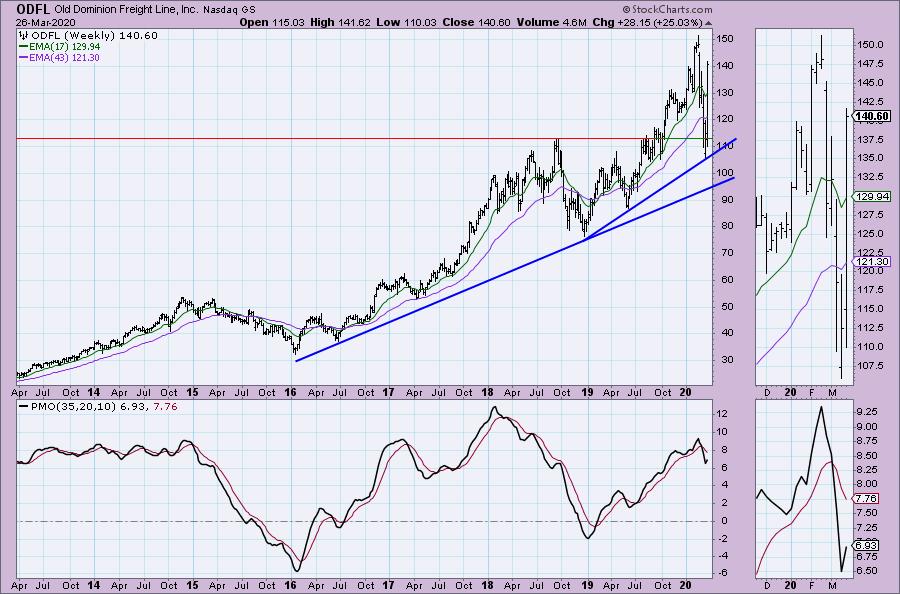
The weekly PMO has ticked back up and it isn't particularly overbought. I also note that the steeper rising trend was preserved and it hasn't even gone down to test the long-term rising trendline.
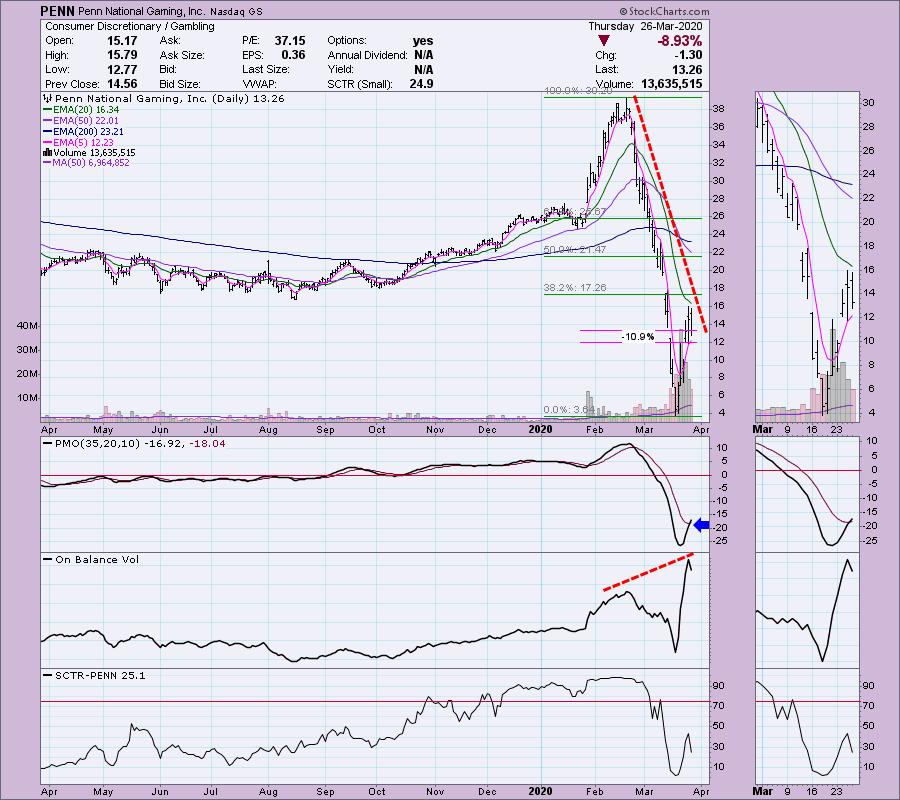
Penn National Gaming Inc (PENN) - Earnings: 4/30/2020 (BMO)
Reader Request: The "V" bottom pattern hasn't quite executed because it hasn't reached that 38.2% retracement level. I'm not a big fan of this one. There has been a ton of upside volume, but it hasn't managed to push it anywhere close to the previous price high that matches the OBV top. This is a reverse divergence and while not incredibly bearish, it is a caution flag. We do have a PMO BUY signal, but I'd want to keep a somewhat tight stop which is very hard to do in this volatile market environment. The SCTR doesn't look healthy.
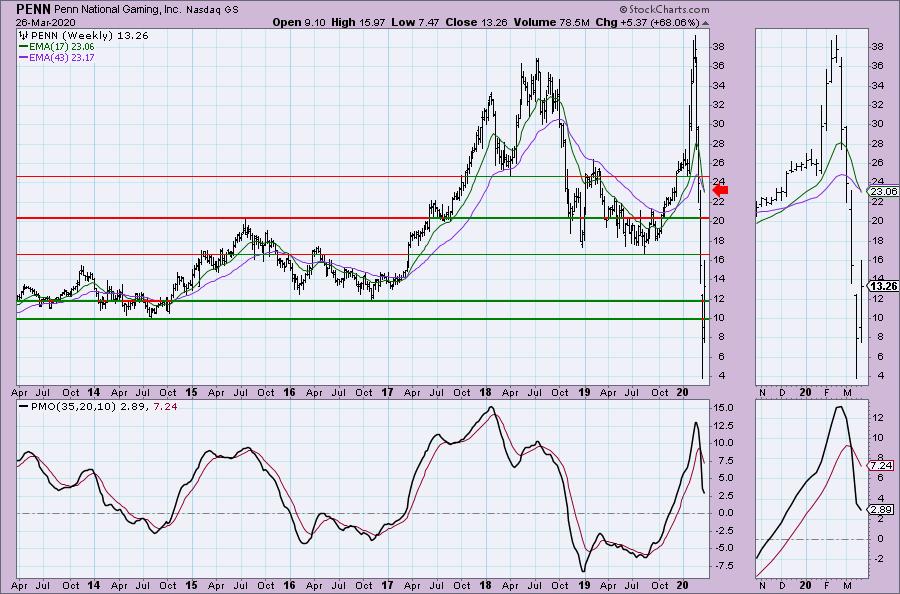
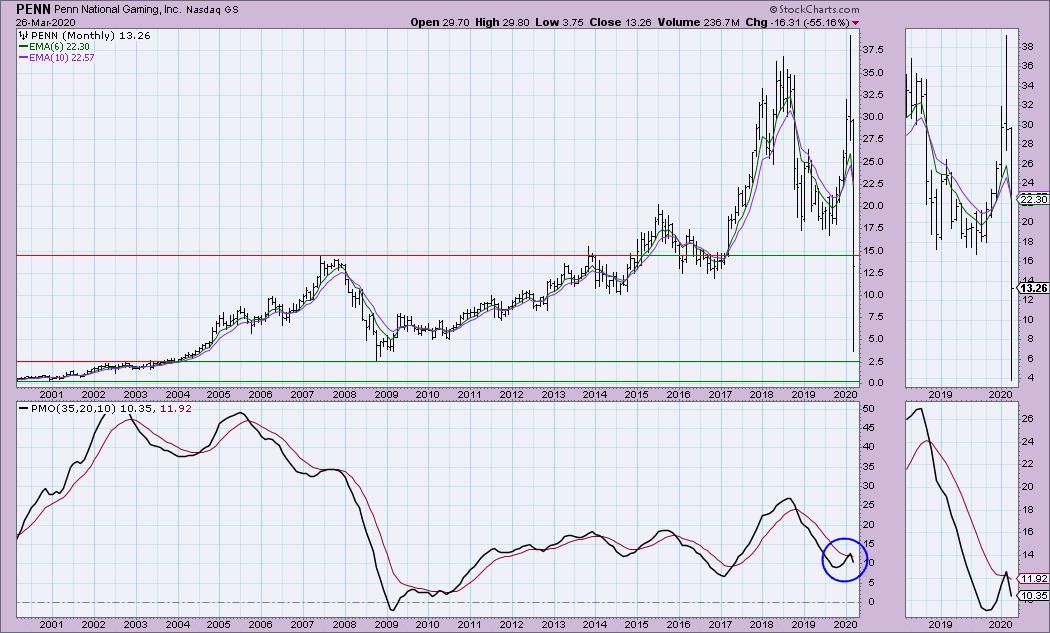
Interestingly PENN dropped well beneath its low for the past 7 years. I've put a monthly chart up underneath the weekly one to give you perspective. The weekly PMO is decelerating, I just think there are better places to put your money right now. Note that this was once a penny stock. That's rather risky.
Zoom Video Communications (ZM) - Earnings: 6/4/2020 (AMC)
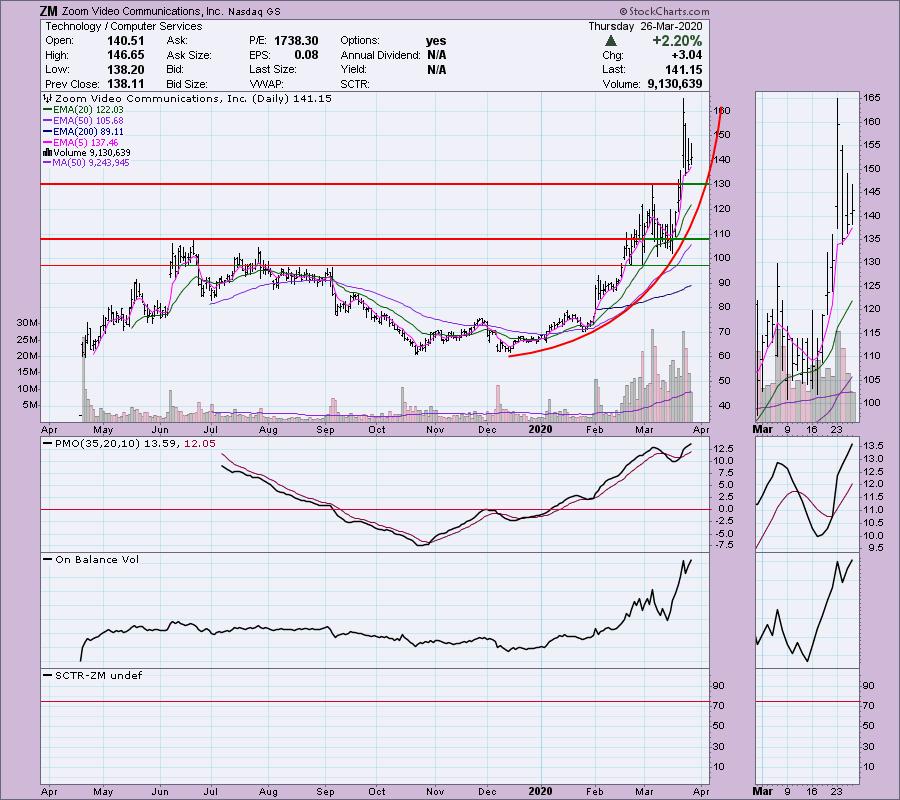
Reader Request and Diamond selection: This one was requested by multiple readers and was one I had planned on talking about today regardless. Admittedly this one is in the midst of a parabolic move. Yet, I believe we will see it move higher as we continue into the new telecommuting age. Many companies are considering making some of the telecommuting more permanent. This will serve Zoom well. Additionally, I personally know many people who have begun using it to communicate with family. Mary Ellen used it to have a family and friends game night this week! This technology is superior to GoToMeeting in my opinion, although Citrix (CTXS) is doing well. Technically, the chart looks good. While PMO is very overbought, we really don't have enough history to make a judgement on what its "normal" range really is. Parabolics break down and decline to the previous basing pattern. Again, not much history to determine that, but my educated guess would be the $100 level. There is no SCTR and the weekly chart isn't needed since it only starting trading last April. Right now we see a small symmetrical triangle in the thumbnail. I'd say that is a pennant on a flagpole. Should the flag execute with a breakout, the minimum upside target would be around $210. I would set a trailing stop at a percentage level you are comfortable with given it is a parabolic.
Current Market Outlook:
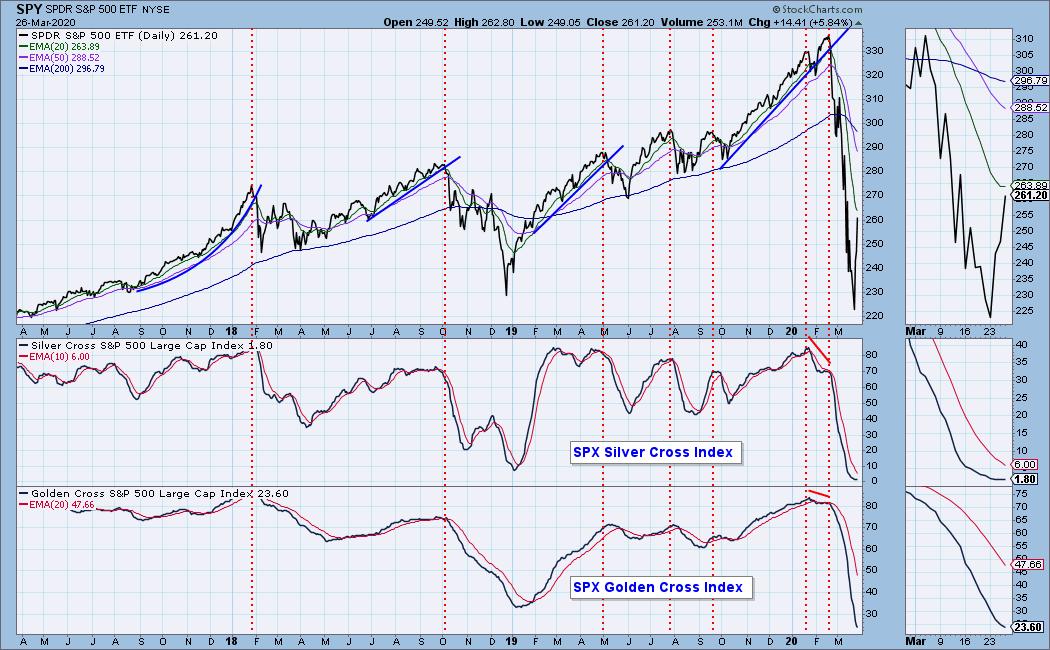
Market Environment: It is important to consider the odds for success. The Silver Cross Index measures the percentage of stocks on IT Trend Model BUY signals (20-EMA > 50-EMA), while the Golden Cross Index measures the percentage of stocks on LT Trend Model BUY signals (50-EMA > 200-EMA). Don't forget that as a "Diamonds" member, you have access to our GCI/SCI curated ChartList on DecisionPoint.com. You'll find it under "Members Only" links on the left side on the Blogs and Links Page. Here are the current percentages on the Silver and Golden Cross Indexes:
Diamond Index:
- Diamond Scan Results: 11
- Diamond Dog Scan Results: 1
- Diamond Bull/Bear Ratio: 11.00
For a more comprehensive review of current market conditions as well as analysis of Dollar, Gold, Oil and Bonds, subscribe to the DecisionPoint Alert! For a LIMITED TIME you can get a coupon code that will give you a discount for bundling your Diamonds subscription with the DecisionPoint Alert! Contact support@decisionpoint.com for more details.
Full Disclosure: I do not own any of the stocks above. I'm currently 80% in cash.

If the show isn't called off and the virus is under control, Erin Swenlin will be presenting at the The MoneyShow Las Vegas May 11-13, 2020! You'll have an opportunity to meet Erin and discuss the latest DecisionPoint news and Diamond Scans. Claim your FREE pass here! You can watch online with this pass too!!
Watch the latest episode of DecisionPoint with Carl & Erin Swenlin LIVE on Mondays 5:00p EST or on the StockCharts TV YouTube channel here!
Technical Analysis is a windsock, not a crystal ball.
Happy Charting!
- Erin
erinh@stockcharts.com
NOTE: The stocks reported herein are from mechanical trading model scans that are based upon moving average relationships, momentum and volume. DecisionPoint analysis is then applied to get five selections from the scans. The selections given should prompt readers to do a chart review using their own analysis process. This letter is not a call for a specific action to buy, sell or short any of the stocks provided. There are NO sure things or guaranteed returns on the daily selection of "diamonds in the rough."
Helpful DecisionPoint Links:
DecisionPoint Shared ChartList and DecisionPoint Chart Gallery
Price Momentum Oscillator (PMO)
Swenlin Trading Oscillators (STO-B and STO-V)
For more links, go to DecisionPoint.com!