
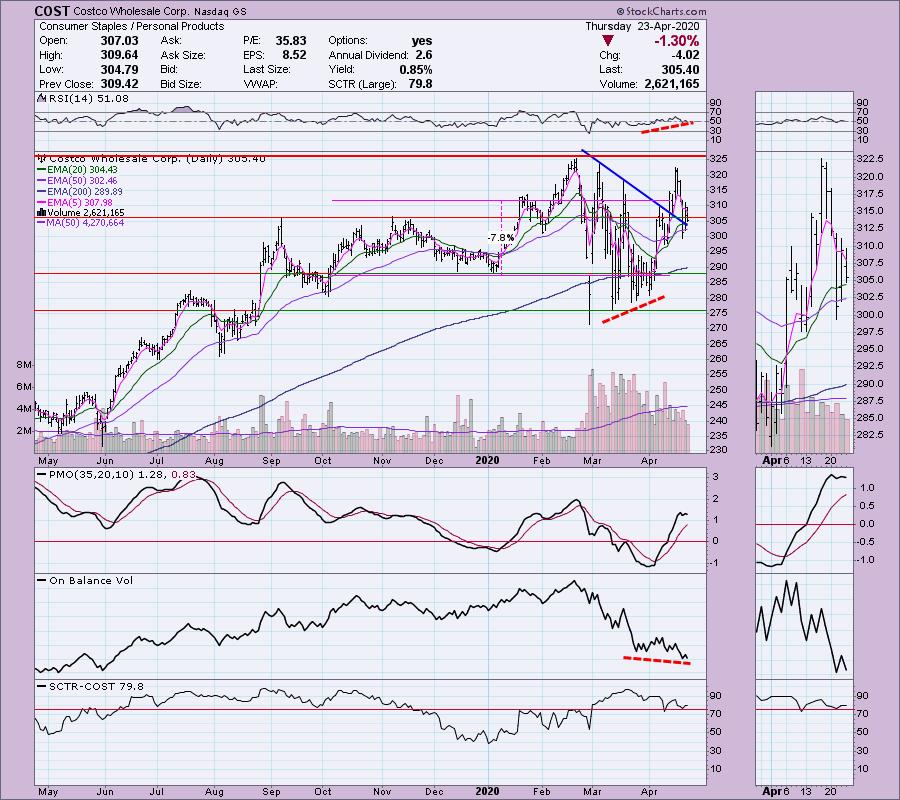
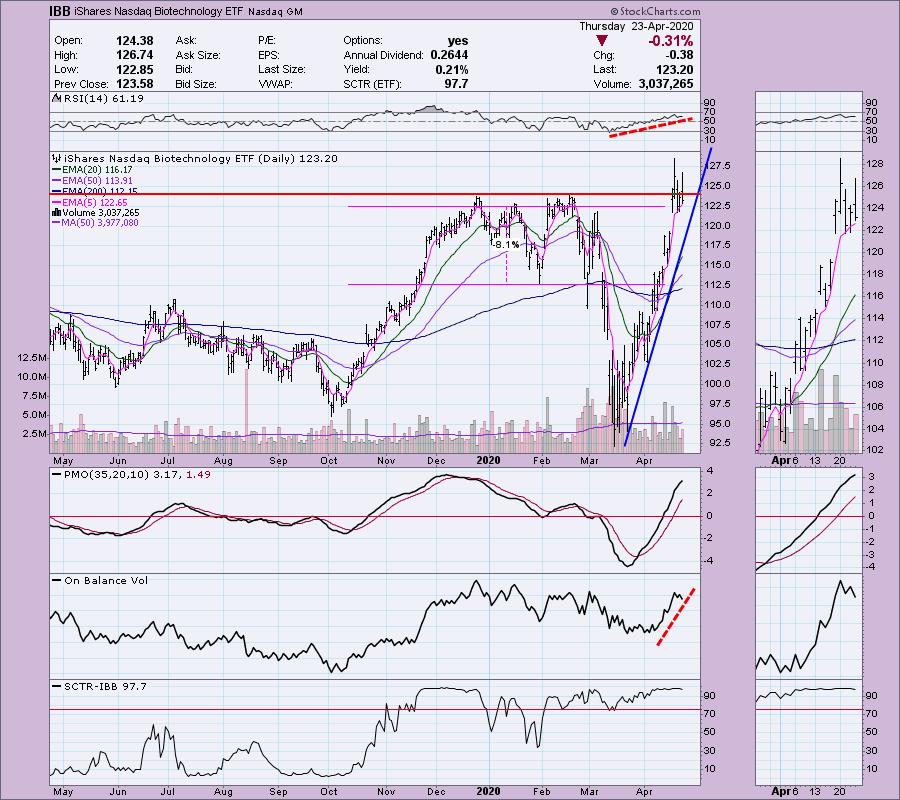
It was a little light on reader requests this week so I picked three from my scans (and truth be told, one of the reader requests was in my scan results today too, so I definitely am covering that one)! I found it interesting when scanning the over 120 results from my bullish EMA scan and found that the most tasty treats were in the defensive areas of the market. As an aside, I'm still stalking COST and I do have a limit order in for IBB which was a Diamond yesterday (it was actually a reader request for today that I opted not to cover since I covered it yesterday). Both COST and IBB were down on the day setting up better entries if you're game. Below are COST and IBB as annotated previously:
Announcement: DP Diamonds will now be published Mondays, Tuesdays and Thursdays (reader request day). We have moved the DecisionPoint Show to a Wednesday taping from Mondays so my time constraints have caused me to move the publishing of DP Diamonds. From here on out the DP Show is being recorded on Wednesday afternoons and will air 8:00a EST on Thursday. You'll find the SCTV programming schedule here. The DecisionPoint YouTube channel can be reached here.
Live Trading Room - Tuesdays/Thursdays
I'm teaming up with Mary Ellen McGonagle (MEMInvestmentResearch.com) to do regular "LIVE Trading Room" sessions for FREE at 11:00a EST. We've had excellent reviews on our new LIVE Trading Rooms so far and plan on continuing them Tuesdays/Thursdays 11:00a EST. The link will be sent out the day before the event, so watch your email and tell your colleagues to sign up for our free email list on DecisionPoint.com to be notified!
Here is the link for tomorrow's live trading room with Mary Ellen McGonagle.
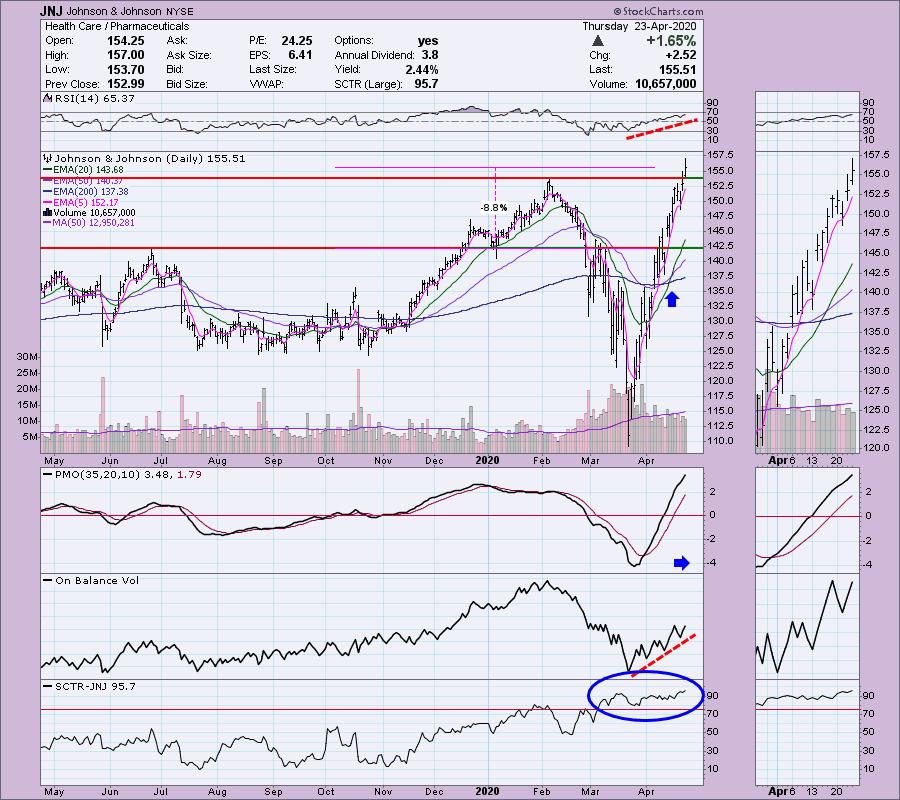
Reader Request: Johnson & Johnson (JNJ) - Earnings: 7/16/2020 (BMO)
This was a reader request, but it also came up on my scans. It looked great and it was likely I would have added it even had it not been a reader request. The EMAs are set up beautifully with a Golden Cross (50-EMA > 200-EMA) and a Silver Cross (20-EMA > 50-EMA). The PMO may look overbought, but we've seen a low at -4, meaning the upside range can go to +4. Additionally, if you review the RSI it tells us that price isn't overbought. The OBV is rising and the SCTR has been in the "hot zone" above 75 since March. There is a very reasonable stop level at the June top which matches well with the January low.
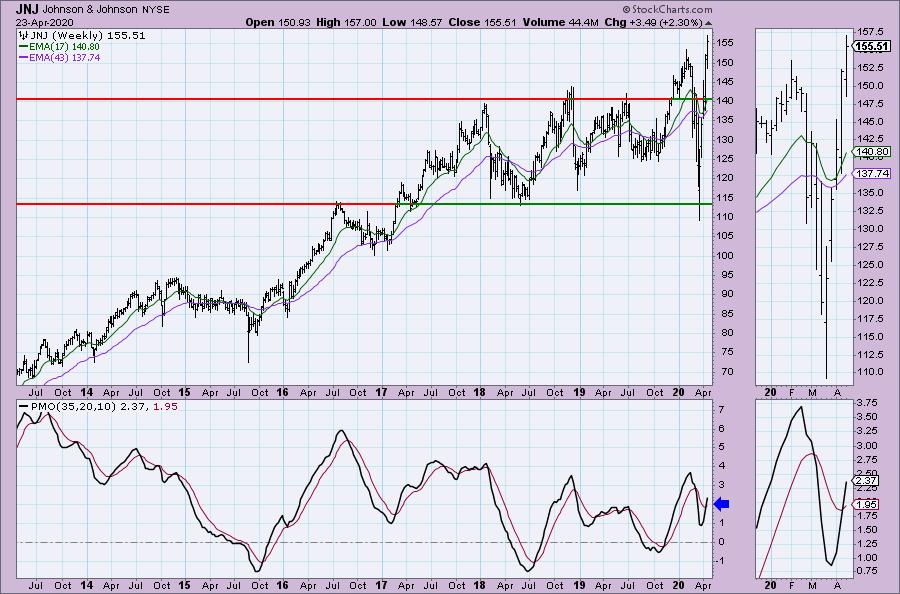
Excellent weekly chart. The breakout this week is impressive and the weekly PMO is likely going to log a new BUY signal when the weekly chart goes "final" after tomorrow's close.
Welcome to DecisionPoint Daily Diamonds, wherein I highlight five "diamonds in the rough." These are selected from the results of my DecisionPoint scans, which search for stocks that could benefit from the trend and condition of the market. Remember, these are not recommendations to buy or sell, but are the most interesting of the stocks that surfaced in my scans. My objective is to save you the work of the initial, tedious culling process, but you need to apply your own analysis to see if these stocks pique your interest as well. There are no guaranteed winners here!
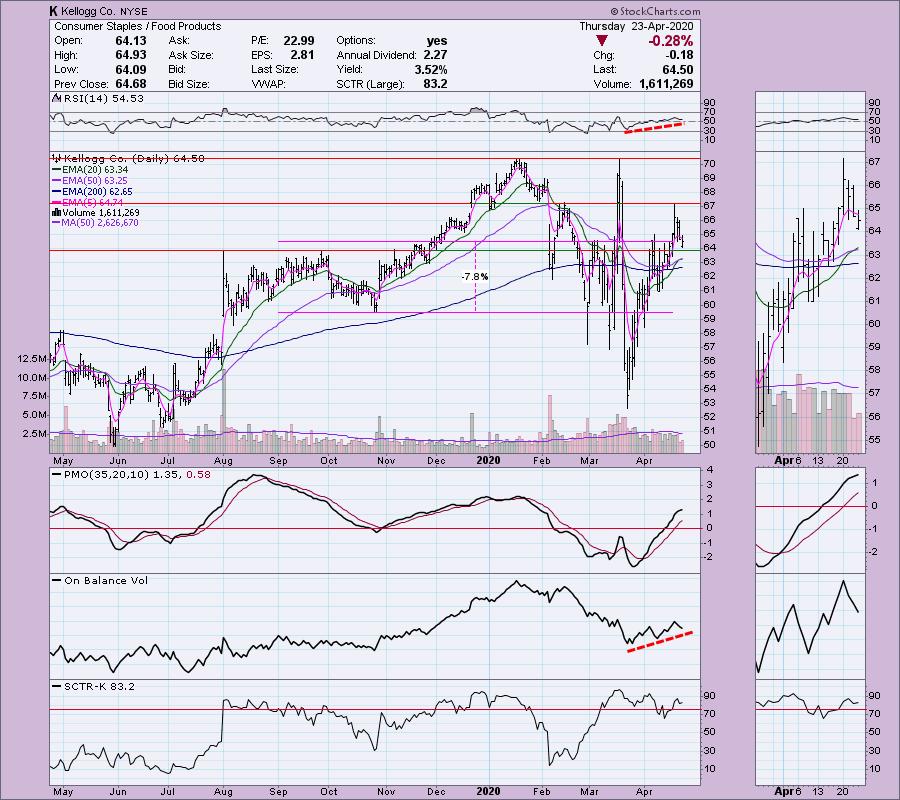
Kellogg Co (K) - Earnings: 4/30/2020 (BMO)
This one came up on my intraday scan this morning. I like the pullback this week as it makes a better entry point. Today a new Silver Cross IT Trend Model BUY signal came in as the 20-EMA crossed above the 50-EMA. The PMO is rising and not overbought. The RSI is above 'net neutral' or 50 and has been trending higher. The SCTR is in the hot zone. Notice that pullback is taking right down to support at the September top. If the internal strength is there based on these indicators, it should bounce and head back up.
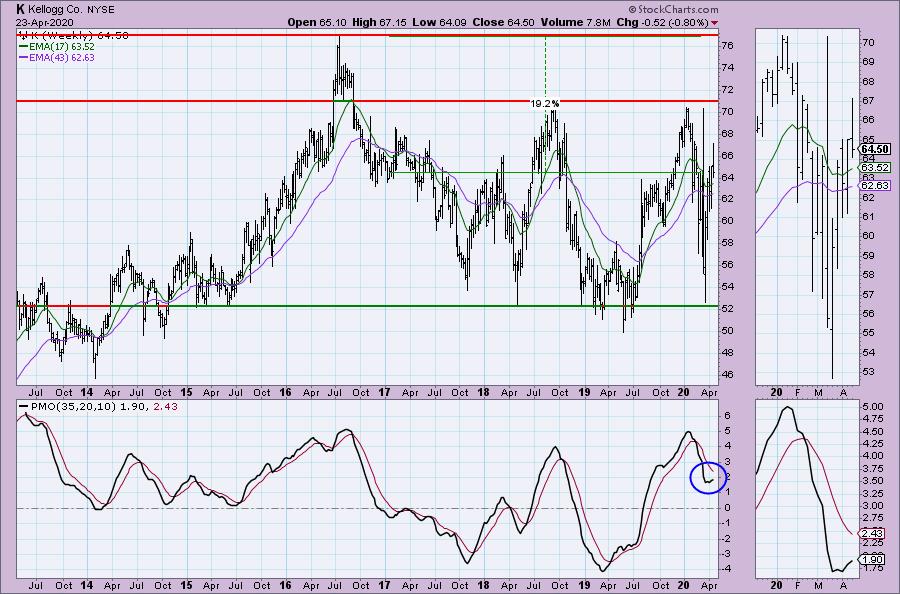
Nice profit target at the 2016 high. The PMO has turned up.
Don't forget, on Thursdays I look at reader-requested symbols, so shoot me an email at erin@decisionpoint.com. I read every email I receive and try to answer them all!
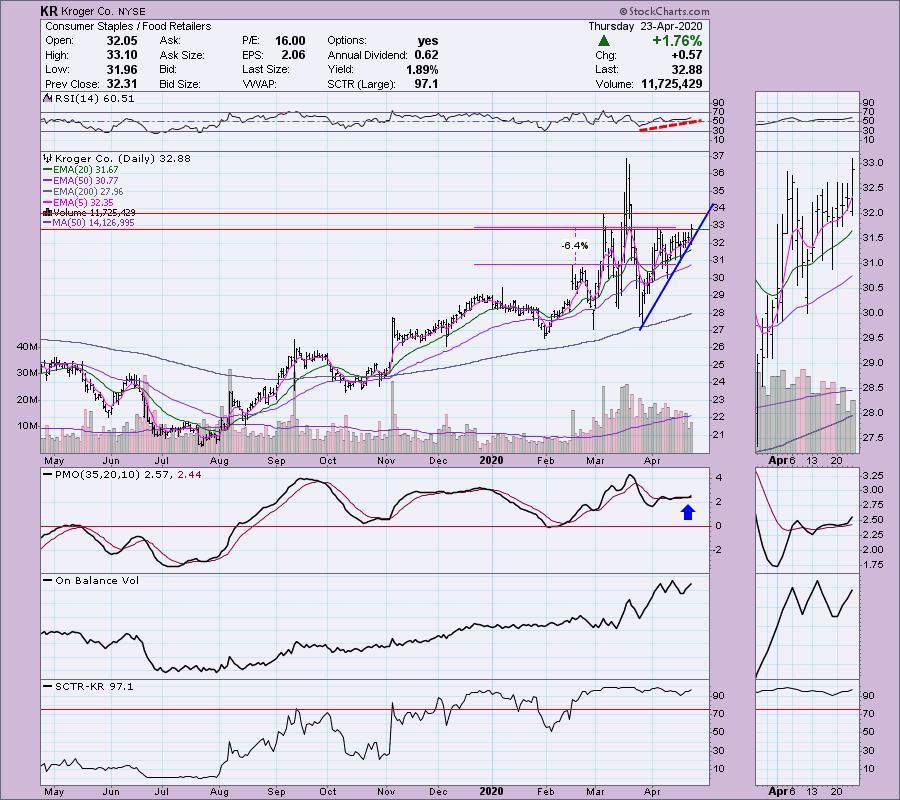
Kroger (KR) - Earnings: 6/18/2020 (BMO)
I really liked this chart which came up today in my scans. KR had a tiny breakout today that I find encouraging. The PMO has been rather flat, but it is now rising again. You can set a reasonable stop at the February top or if you prefer, a stop at the December 2019 high. The RSI is trending higher and isn't overbought.
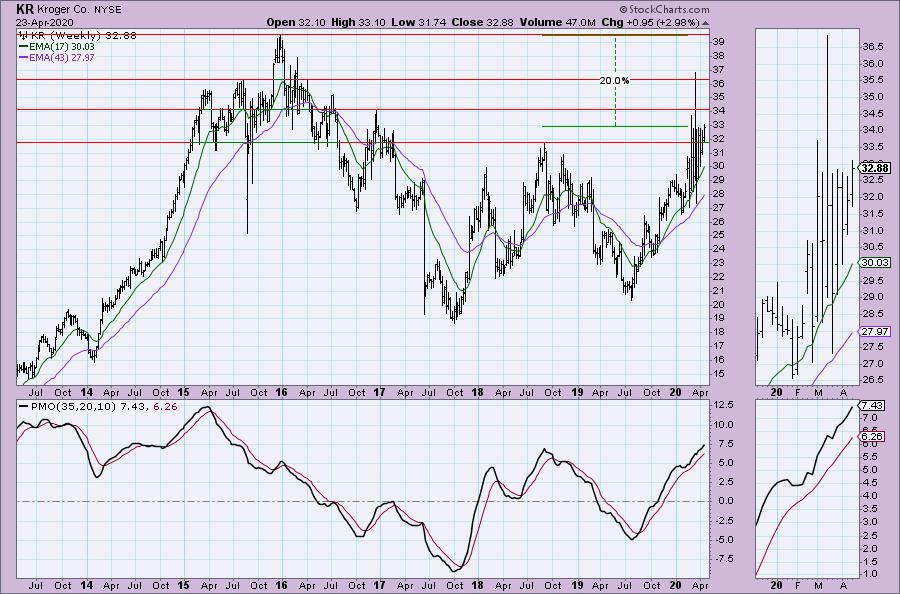
Upside potential is 20% should it challenge its all-time high from 2015. The PMO is rising nicely and on a BUY signal.
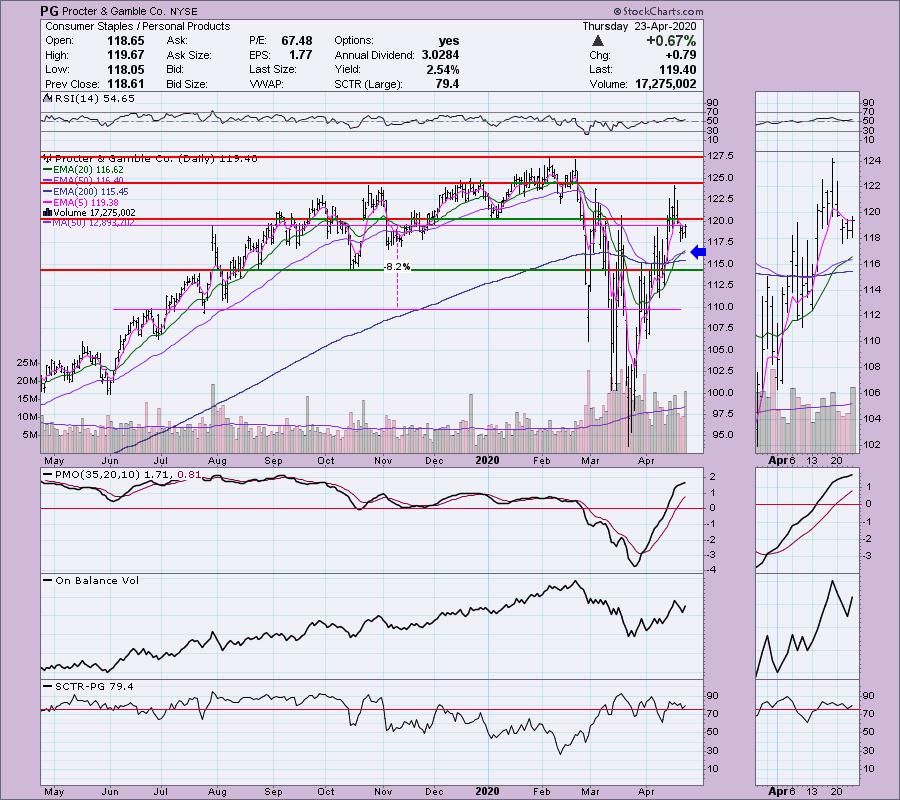
Procter & Gamble Co (PG) - Earnings: 7/28/2020 (BMO)
This is another Consumer Staple that I like. We just got a Silver Cross IT Trend Model BUY signal as the 20-EMA crossed above the 50-EMA. My one dislike is that it isn't sitting on strong support. The PMO is rising and not particularly overbought given the downside of the range is -4. The RSI is positive and rising again. I like the pullback off last week's top. This is another that you can set a comfortable stop. I've chosen the June top and July lows.
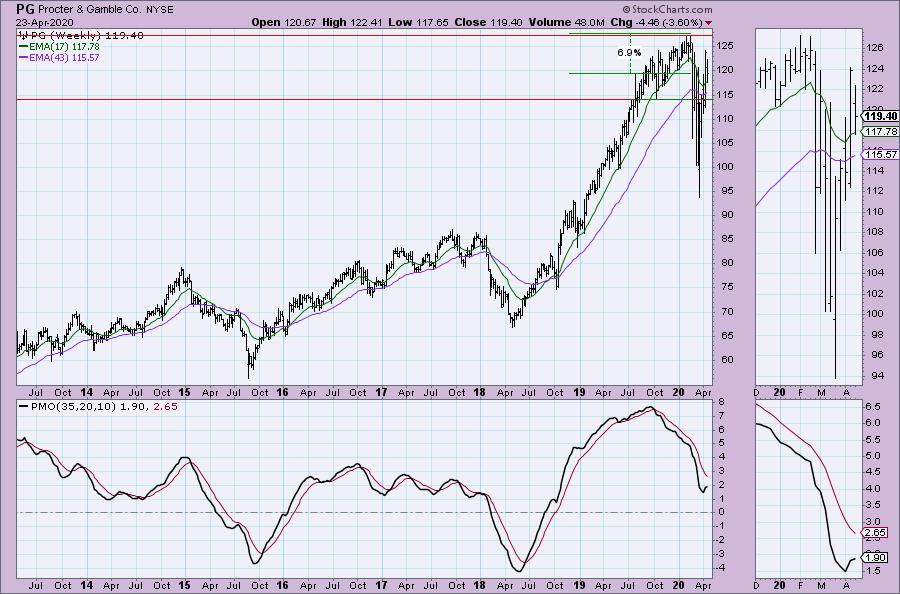
Price will need to reach all-time highs to get a 7% gain, but the PMO has turned up and I suspect it can move much higher.
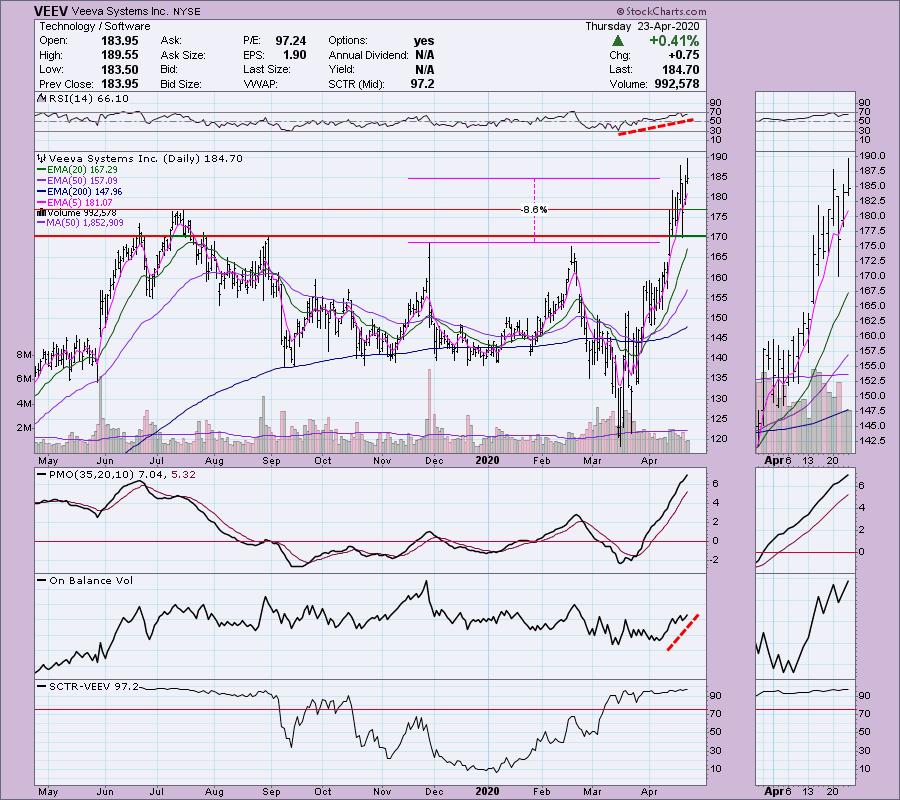
Reader Request: Veeva Systems Inc (VEEV) - Earnings: 5/27/2020 (AMC)
This stock was requested to me via email, but Mary Ellen and I also took a look at it during the Trading Room (or was it WealthWise Women?). It's in a great sector and industry group. Software stocks have really been outperforming and VEEV is no exception. I really would like to wait for a pullback on this one but you can see it has been a 'runner', shooting higher after breaking through resistance at about $155/$160. The PMO is on the overbought side, but I'll forgive it since the RSI tells me that price itself isn't overbought. The OBV is rising in confirmation.
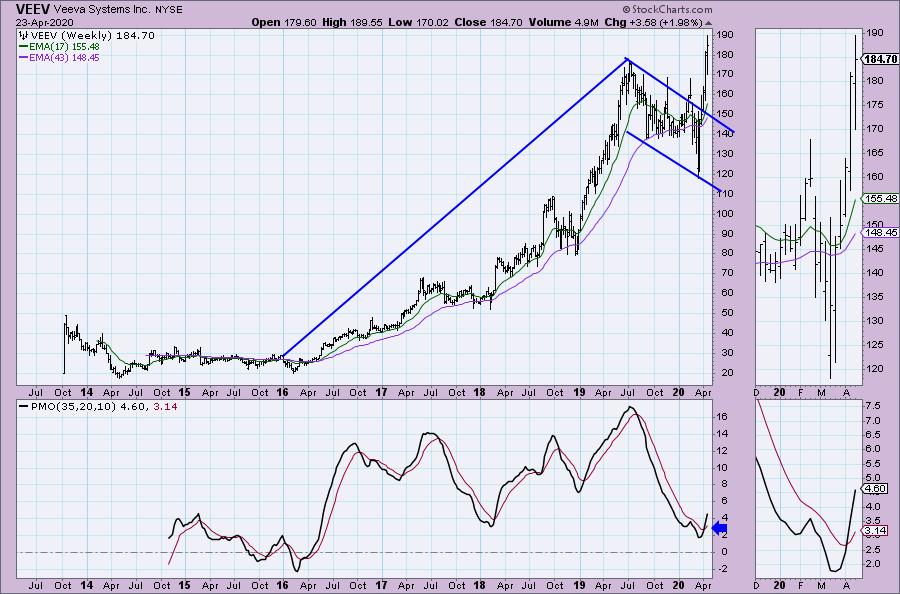
This is somewhat eye-popping. This is a longer-term bull flag on the weekly chart. According to textbooks, you take the length of the flag pole (about $160) and add it to the breakout point to determine a minimum upside target. Well, folks, that would mean VEEV could shoot up to over $320. I'm not saying it will do that soon, but it certainly is lined up nicely. Add on the PMO BUY signal that is just coming in and this one is quite interesting. I think I'll add it to my watch list.
Current Market Outlook:
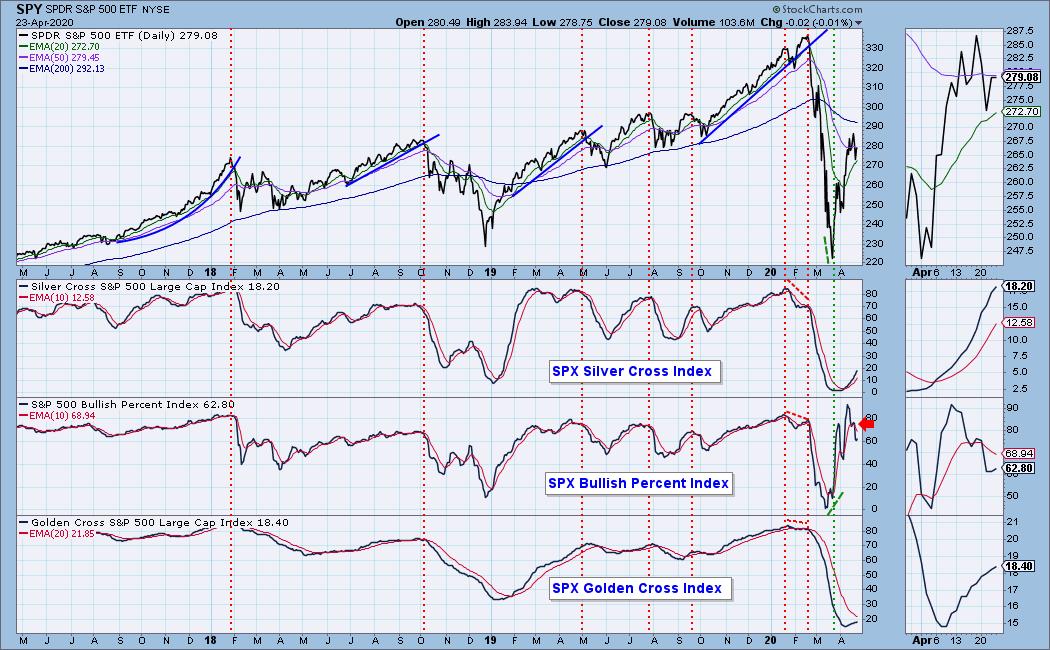
Market Environment: It is important to consider the odds for success. The Silver Cross Index measures the percentage of stocks on IT Trend Model BUY signals (20-EMA > 50-EMA), while the Golden Cross Index measures the percentage of stocks on LT Trend Model BUY signals (50-EMA > 200-EMA). Don't forget that as a "Diamonds" member, you have access to our GCI/SCI curated ChartList on DecisionPoint.com. You'll find it under "Members Only" links on the left side on the Blogs and Links Page. Here are the current percentages on the Silver and Golden Cross Indexes:
Diamond Index:
- Diamond Scan Results: 2
- Diamond Dog Scan Results: 111
- Diamond Bull/Bear Ratio: 0.02
For a more comprehensive review of current market conditions as well as analysis of Dollar, Gold, Oil and Bonds, subscribe to the DecisionPoint Alert! For a LIMITED TIME you can get a coupon code that will give you a discount for bundling your Diamonds subscription with the DecisionPoint Alert! Contact support@decisionpoint.com for more details.
Full Disclosure: I do not own any of the stocks above and I'm currently 20% in cash. My trading timeframe has moved from intermediate-term to short-term and therefore I'm investing more. It is strange to be this invested in a bear market, but the indicators and scans have so far protected me from peril.

Erin Swenlin will be presenting at the The MoneyShow Las Vegas August 16 - 20 at Bally's/Paris Resort! You'll have an opportunity to meet Erin and discuss the latest DecisionPoint news and Diamond Scans. Claim your FREE pass here! You can watch online with this pass too!! There will be online events held in May and when I have more information I'll let you know.
Watch the latest episode of DecisionPoint with Carl & Erin Swenlin LIVE on Wednesdays 5:00p EST or on the StockCharts TV YouTube channel here!
Technical Analysis is a windsock, not a crystal ball.
Happy Charting!
- Erin
erinh@stockcharts.com
NOTE: The stocks reported herein are from mechanical trading model scans that are based upon moving average relationships, momentum and volume. DecisionPoint analysis is then applied to get five selections from the scans. The selections given should prompt readers to do a chart review using their own analysis process. This letter is not a call for a specific action to buy, sell or short any of the stocks provided. There are NO sure things or guaranteed returns on the daily selection of "diamonds in the rough."
Helpful DecisionPoint Links:
DecisionPoint Shared ChartList and DecisionPoint Chart Gallery
Price Momentum Oscillator (PMO)
Swenlin Trading Oscillators (STO-B and STO-V)
For more links, go to DecisionPoint.com!