
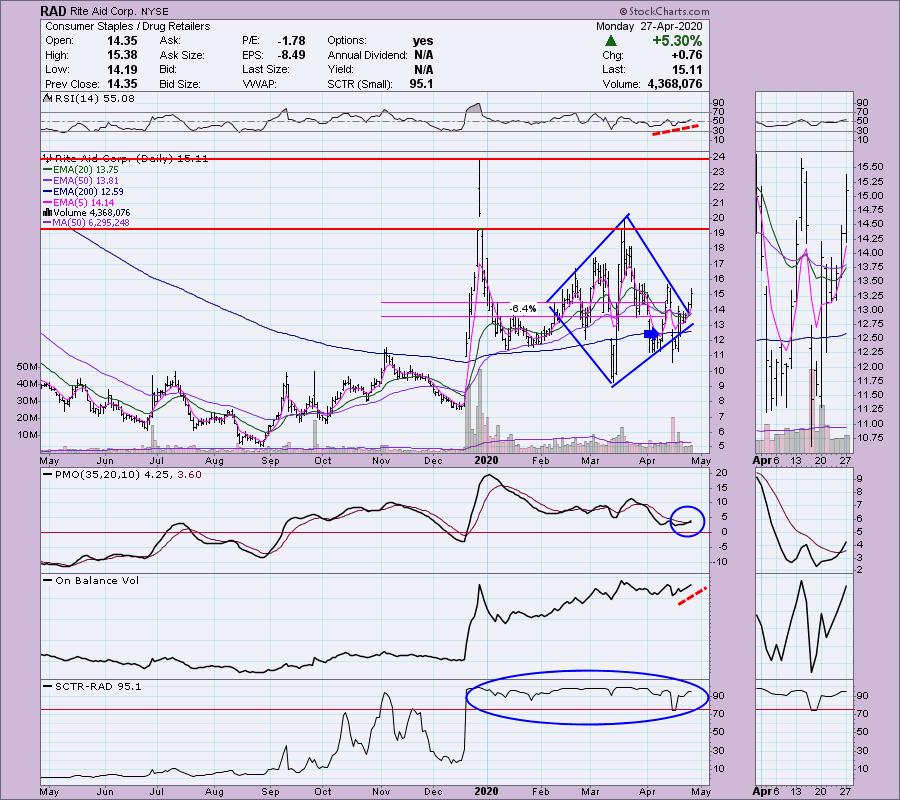
I decided to take a look at some of the results in my Momentum Sleepers scan. It hasn't really turned up much in results, but today it offered a few interesting gems. I also found a stock that is a darling that had a pullback that we could take advantage of. The market must be pricing in the possible opening up of America as it really is uninterested in declining. Well we might as well get in there and take advantage of the rallies. I am pleased that RiteAid (RAD) turned out to be an excellent choice from a few reports back. I was unhappy that it gapped down (blue arrow) and I ended up with a deep decline to digest right out of the gate, but it served me well as it has been rebounding. I think the chart is looking good with the recent breakout from the declining tops trendline.
Announcement: DP Diamonds will now be published Mondays, Tuesdays and Thursdays (reader request day). We have moved the DecisionPoint Show to a Wednesday taping from Mondays so my time constraints have caused me to move the publishing of DP Diamonds. From here on out the DP Show is being recorded on Wednesday afternoons and will air 8:00a EST on Thursday. You'll find the SCTV programming schedule here. The DecisionPoint YouTube channel can be reached here.
Live Trading Room - Tuesdays/Thursdays
I'm teaming up with Mary Ellen McGonagle (MEMInvestmentResearch.com) to do regular "LIVE Trading Room" sessions for FREE at 11:00a EST. We've had excellent reviews on our new LIVE Trading Rooms so far and plan on continuing them Tuesdays/Thursdays 11:00a EST. The link will be sent out the day before the event, so watch your email and tell your colleagues to sign up for our free email list on DecisionPoint.com to be notified!
Here is the link for tomorrow's (4/28) live trading room.
Aegion Corp (AEGN) - Earnings: 4/29/2020 (AMC)
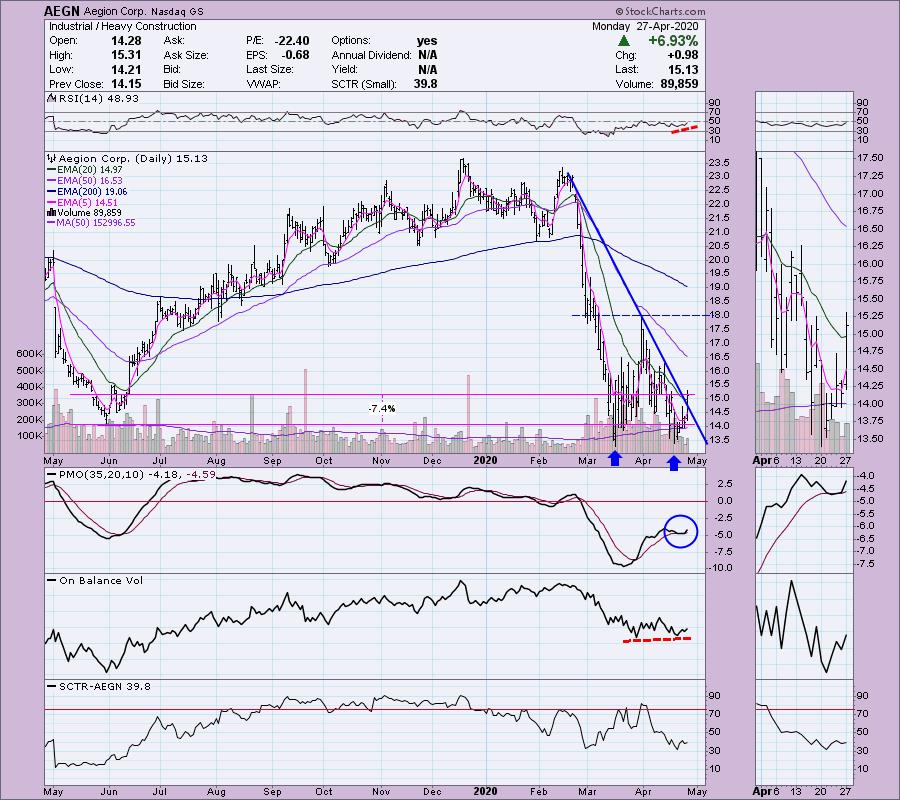
This was a momentum sleeper scan result. I've had a few readers tell me that they wish I were presenting more stocks that haven't participated in the rally of the past few weeks but are showing momentum. Well, here you are. There are few things to know before going in. 1) It may need a pullback after today's 7% move, 2) They report earnings on Thursday. I see a double-bottom pattern possibly forming. Most importantly, I see that today's move was the first time it's broken out of the declining trend after multiple attempts. I would watch the 30 and 60 min charts closely before entering. I lined up a possible stop area at the May 2019 low.
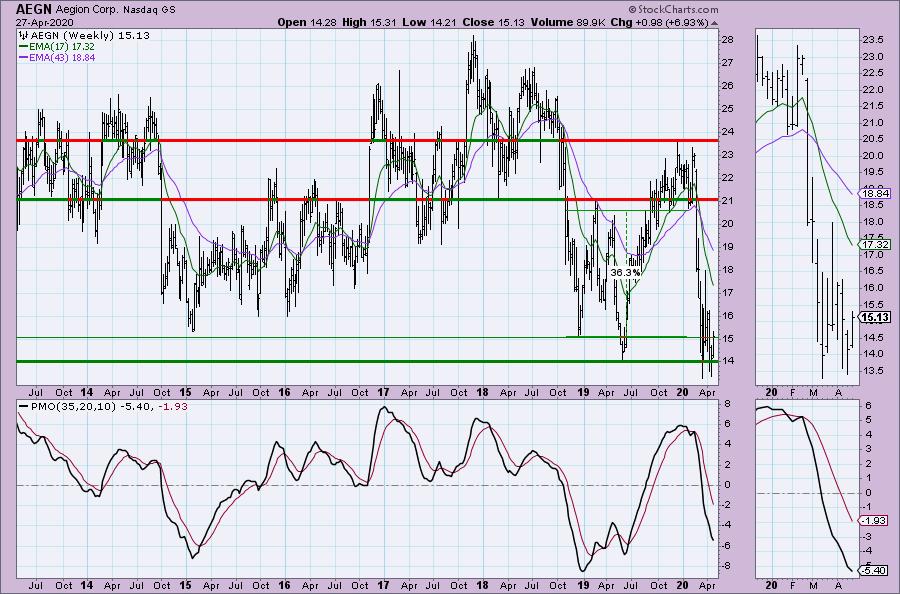
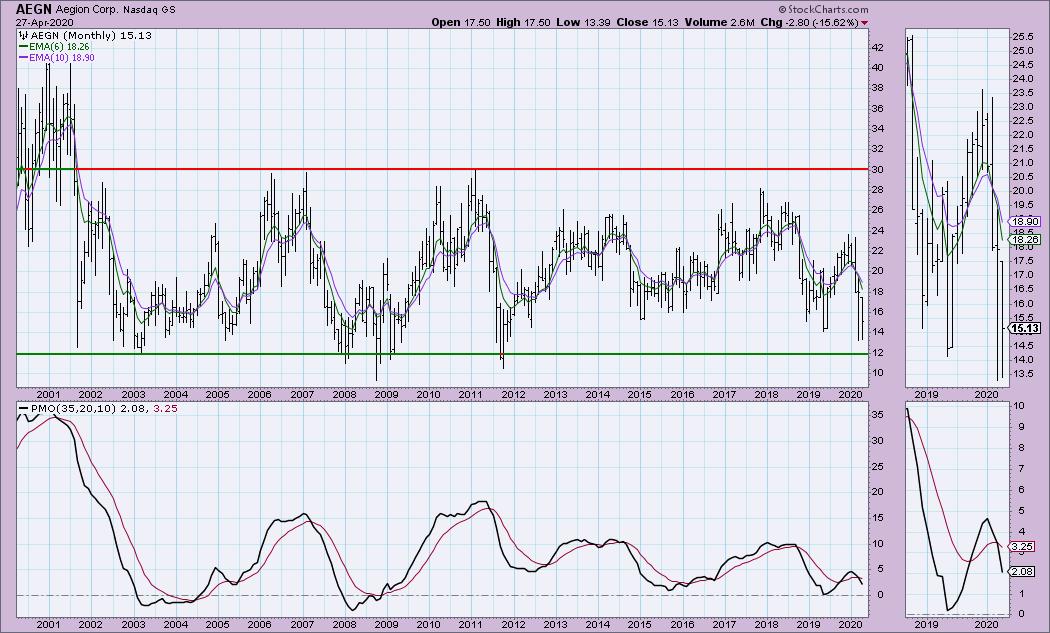
I'm including the monthly chart below the weekly chart. This stock trades in a very wide trading range and currently it is at the bottom. The weekly/monthly PMOs don't look great, but they usually don't on bottom fishing candidates.
Welcome to DecisionPoint Daily Diamonds, wherein I highlight five "diamonds in the rough." These are selected from the results of my DecisionPoint scans, which search for stocks that could benefit from the trend and condition of the market. Remember, these are not recommendations to buy or sell, but are the most interesting of the stocks that surfaced in my scans. My objective is to save you the work of the initial, tedious culling process, but you need to apply your own analysis to see if these stocks pique your interest as well. There are no guaranteed winners here!
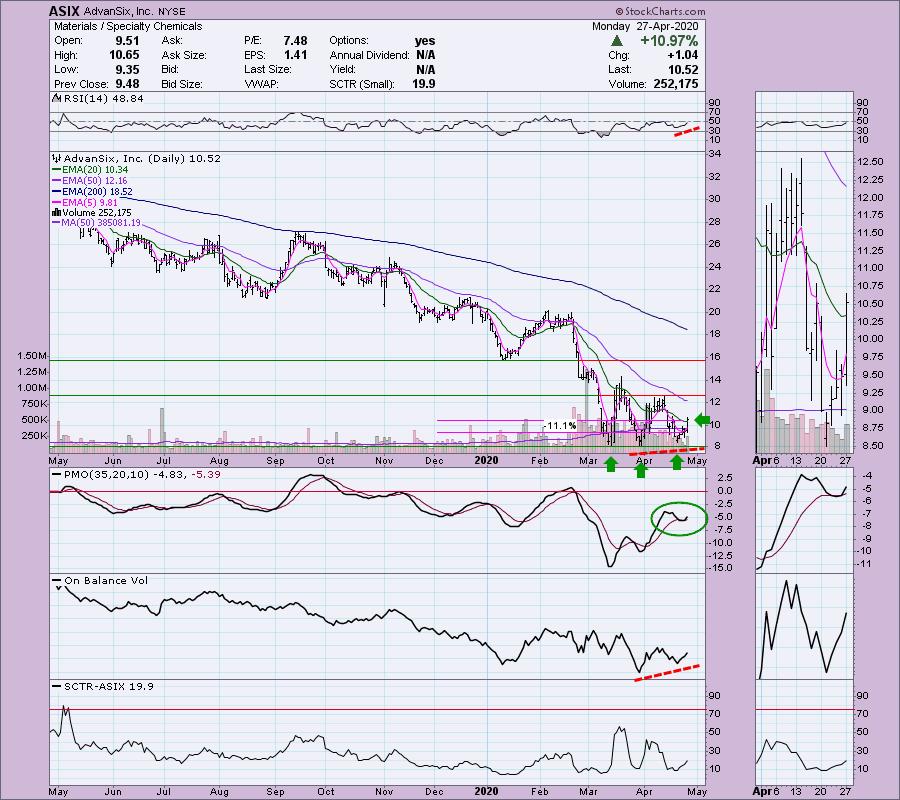
AdvanSix Inc (ASIX) - Earnings: 5/1/2020 (BMO)
The double-bottom pattern never executed, but this actually has set-up a possible triple-bottom. This one reports earnings on Friday and with a near 11% move to the upside, it may require some patience. Setting a stop is a bit tricky in terms of find support, so I just listed an 11% stop area based on today's move. The RSI isn't quite in positive territory above 50, but it is trending higher. The OBV bottoms are very positive given comparative price bottoms are mostly flat.
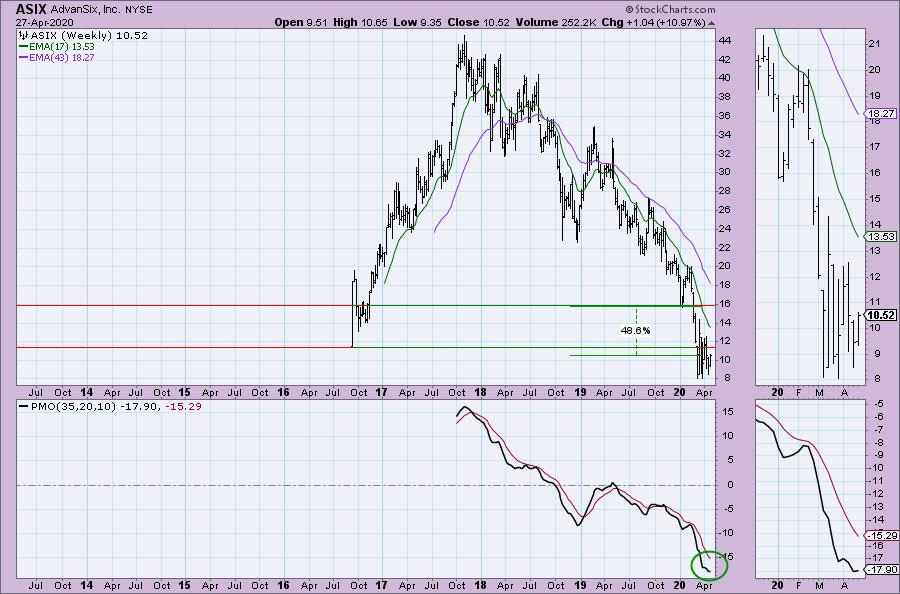
While upside potential is amazing here, the stock is trading below its IPO. That could be stiff overhead resistance. The weekly PMO is turning up (although I note it did the same thing in late March on the failed rally). Just be careful here, I recommend position sizing to protect yourself.
Don't forget, on Thursdays I look at reader-requested symbols, so shoot me an email at erin@decisionpoint.com. I read every email I receive and try to answer them all!
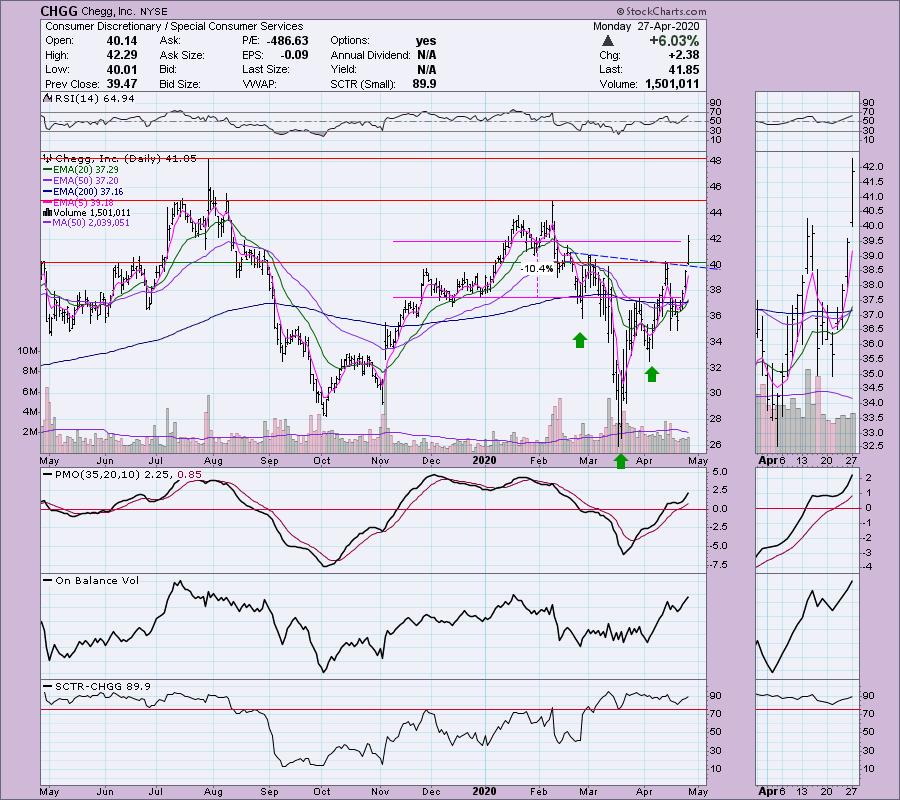
Chegg Inc (CHGG) - Earnings: 5/4/2020 (AMC)
I believe that Chegg has just executed a reverse head and shoulders. Notice that all three EMAs just had positive crossovers. That means we have an IT Trend Model BUY signal, as well as a LT Trend Model BUY signal. The RSI is above 50 and the OBV is confirming the breakout by making higher highs with price.
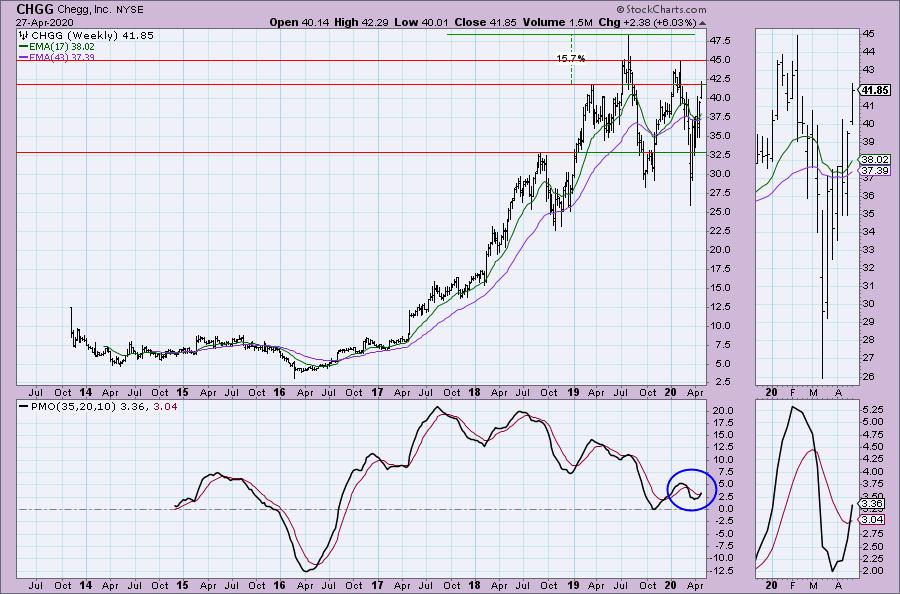
We have a new weekly PMO BUY signal lining up for the end of the week. The breakout above the first quarter 2019 top is definitely a plus. We did get a powerful move to the upside today, so watch for a pullback. It reports earnings next week.
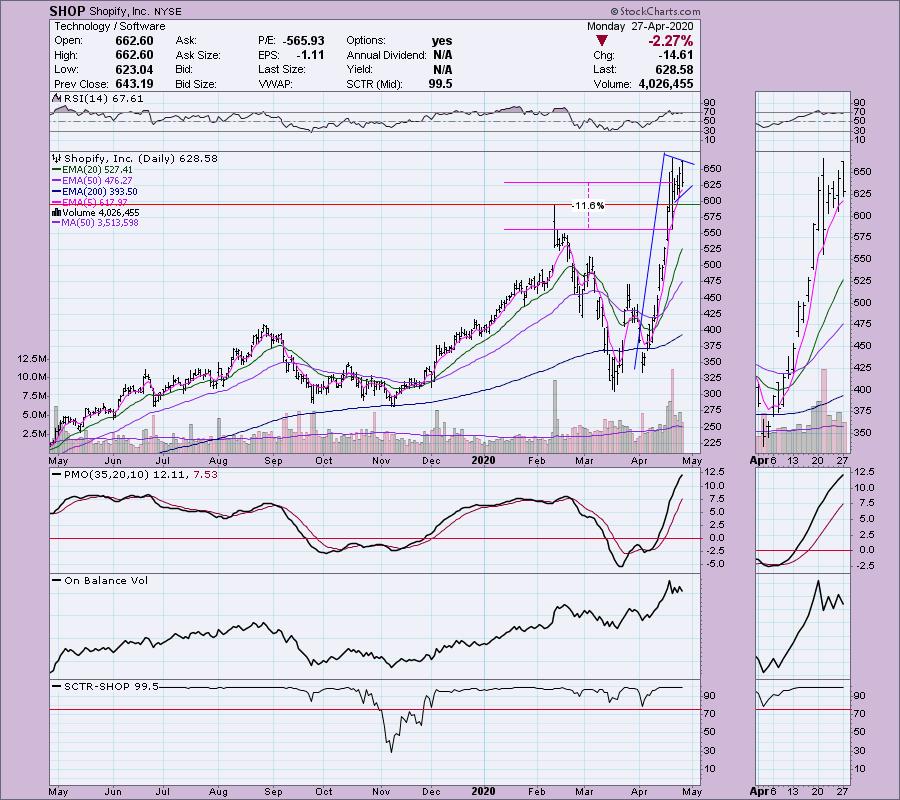
Shopify Inc (SHOP) - Earnings: 5/6/2020 (BMO)
This is the stock that you can take advantage of a pullback. SHOP has been a top performer and there is not reason to believe it won't continue given the strong PMO and healthy RSI and SCTR. I also note that there is a flag forming on this digestion of the powerful rally experienced this month.
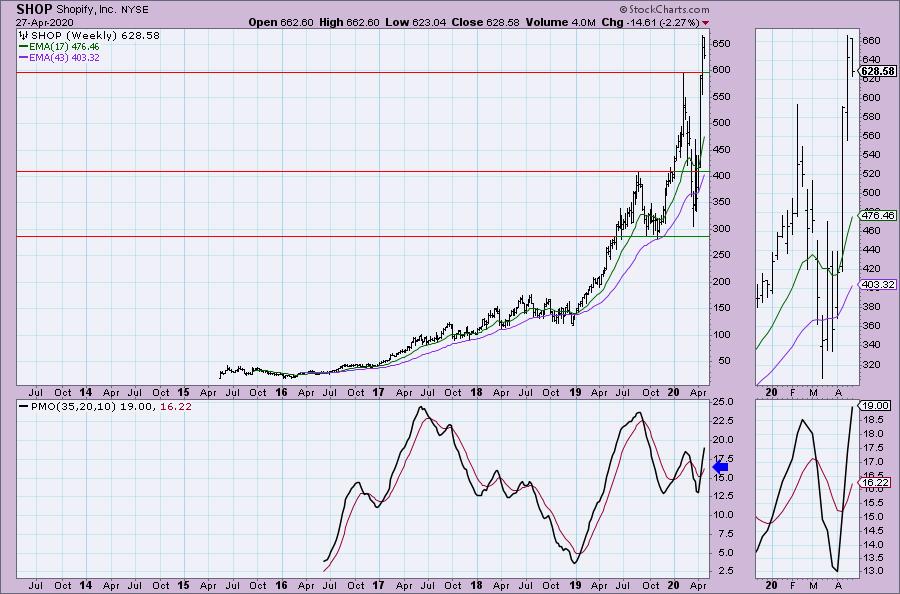
The weekly PMO is positive and logged a BUY signal last week.
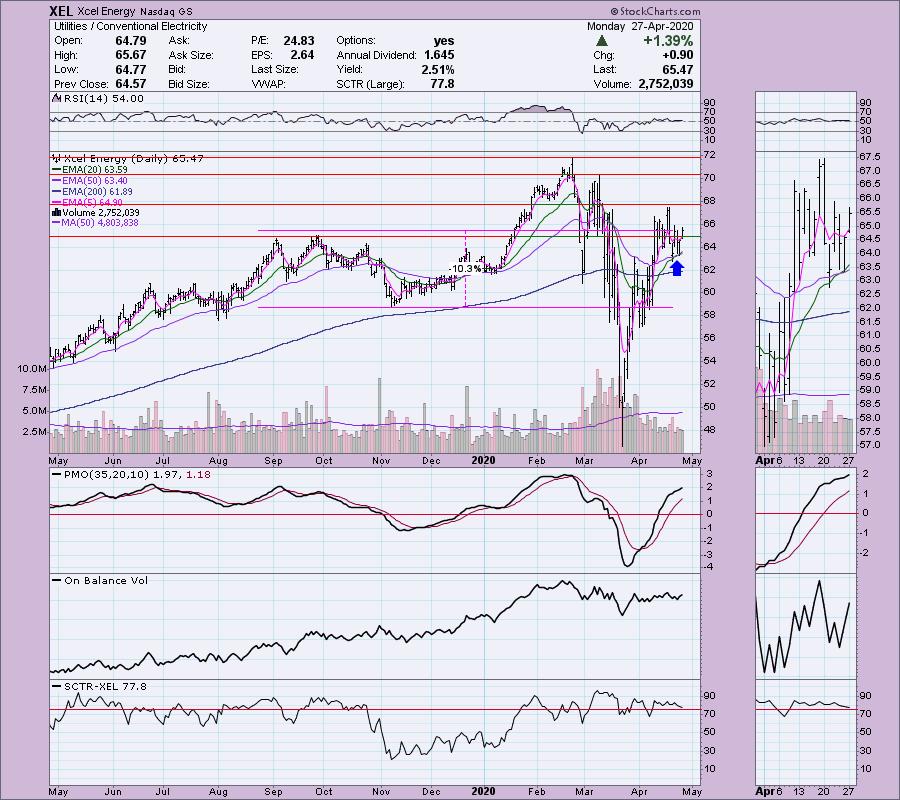
Xcel Energy (XEL) - Earnings: 5/7/2020 (BMO)
Today price broke out above the trading range formed in the fourth quarter of 2019. The 20-EMA just crossed above the 50-EMA (Silver Cross) and triggered an IT Trend Model BUY signal. The SCTR is above 75 and the RSI is above net neutral (50). The PMO is rising and isn't really overbought.
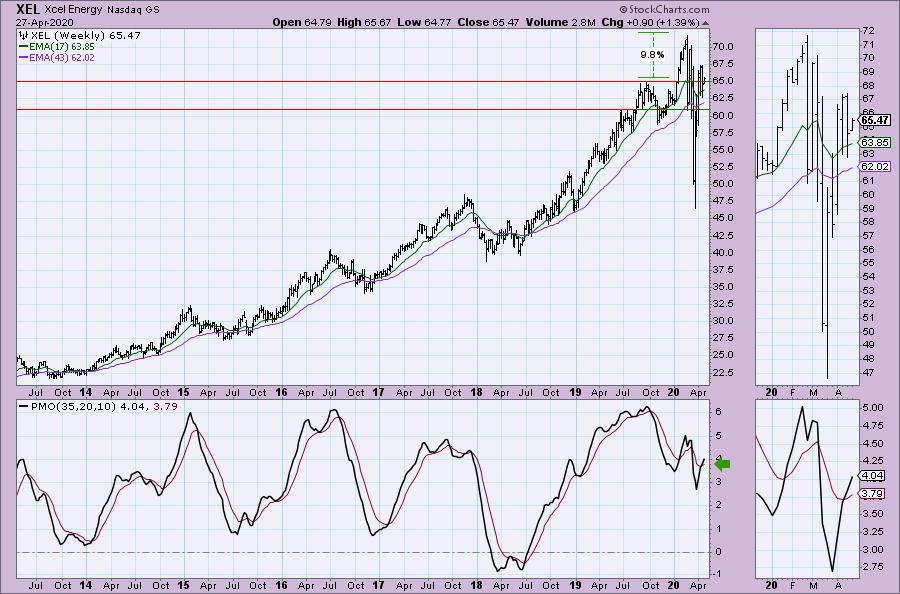
The weekly PMO just triggered a BUY signal. I think this one can challenge all-time highs.
Current Market Outlook:
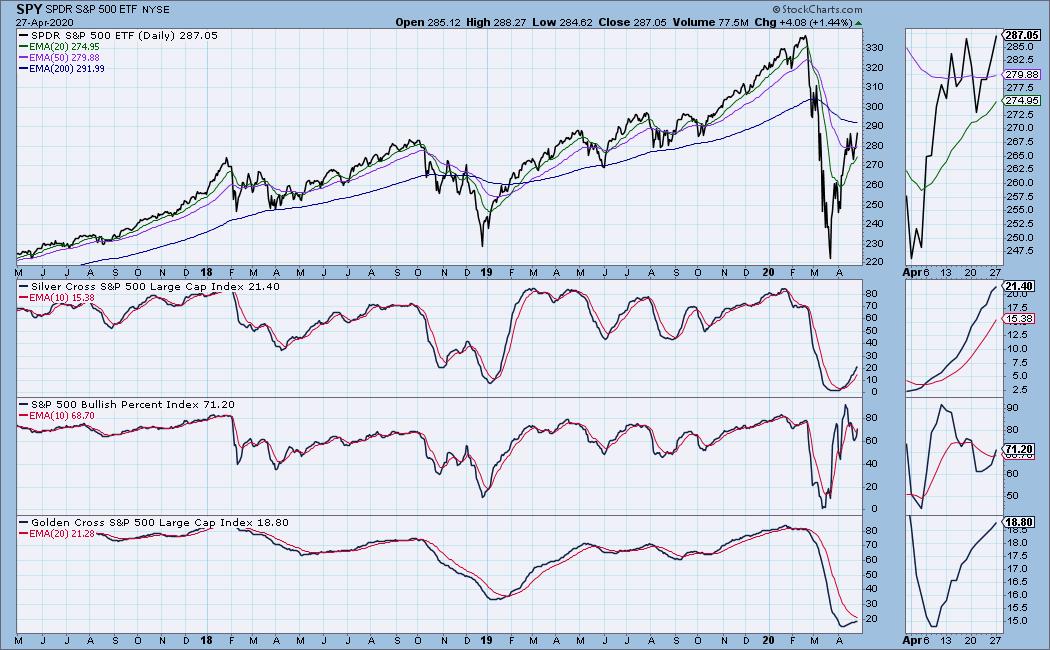
Market Environment: It is important to consider the odds for success. The Silver Cross Index measures the percentage of stocks on IT Trend Model BUY signals (20-EMA > 50-EMA), while the Golden Cross Index measures the percentage of stocks on LT Trend Model BUY signals (50-EMA > 200-EMA). Don't forget that as a "Diamonds" member, you have access to our GCI/SCI curated ChartList on DecisionPoint.com. You'll find it under "Members Only" links on the left side on the Blogs and Links Page. Here are the current percentages on the Silver and Golden Cross Indexes:
Diamond Index:
- Diamond Scan Results: 0
- Diamond Dog Scan Results: 45
- Diamond Bull/Bear Ratio: 0.00
For a more comprehensive review of current market conditions as well as analysis of Dollar, Gold, Oil and Bonds, subscribe to the DecisionPoint Alert! For a LIMITED TIME you can get a coupon code that will give you a discount for bundling your Diamonds subscription with the DecisionPoint Alert! Contact support@decisionpoint.com for more details.
Full Disclosure: I do own RiteAid (RAD) and I'm currently 20% in cash. My trading timeframe has moved from intermediate-term to short-term and therefore I'm investing more. It is strange to be this invested in a bear market, but the indicators and scans have so far protected me from peril.

Erin Swenlin will be presenting at the The MoneyShow Las Vegas August 16 - 20 at Bally's/Paris Resort! You'll have an opportunity to meet Erin and discuss the latest DecisionPoint news and Diamond Scans. Claim your FREE pass here! You can watch online with this pass too!! There will be online events held in May and when I have more information I'll let you know.
Watch the latest episode of DecisionPoint with Carl & Erin Swenlin LIVE on Wednesdays 5:00p EST or on the StockCharts TV YouTube channel here!
Technical Analysis is a windsock, not a crystal ball.
Happy Charting!
- Erin
erinh@stockcharts.com
NOTE: The stocks reported herein are from mechanical trading model scans that are based upon moving average relationships, momentum and volume. DecisionPoint analysis is then applied to get five selections from the scans. The selections given should prompt readers to do a chart review using their own analysis process. This letter is not a call for a specific action to buy, sell or short any of the stocks provided. There are NO sure things or guaranteed returns on the daily selection of "diamonds in the rough."
Helpful DecisionPoint Links:
DecisionPoint Shared ChartList and DecisionPoint Chart Gallery
Price Momentum Oscillator (PMO)
Swenlin Trading Oscillators (STO-B and STO-V)
For more links, go to DecisionPoint.com!