
One of the Diamonds I'm presenting to you was first published in the March 3rd Diamonds Report. It showed up on the scan today and I've been seeing it talked up as one of the few lights in the darkness of this market. Full disclosure, I did enter NFLX and WSO (both presented yesterday) and put in stops that work with my risk appetite. Given this could go on for some time and the market overall hasn't likely hit its bottom, I believe it is time to short-term "trade". I find that I am spending more time looking at individual stocks for Diamonds and I like the stop levels that are available--it suits my risk appetite, but only because I have the time and energy to watch them. If you plan on putting money into the market, stops are critical and you MUST be nimble and available.
To that end, I'm teaming up with Mary Ellen McGonagle (MEMInvestmentResearch.com) to do a "LIVE Trading Room" event set for tomorrow (4/2) at 11:00a EST. Register using this link. The event will be offered for free this time and then depending on the interest level, we will offer it as an "add-on" at a discount for our subscribers and a much higher full-price charge for those not subscribing to DecisionPoint.com or the MEM Edge. My plan for tomorrow is to concentrate on today's and yesterday's Diamonds and watch for possible entries/exits real-time.
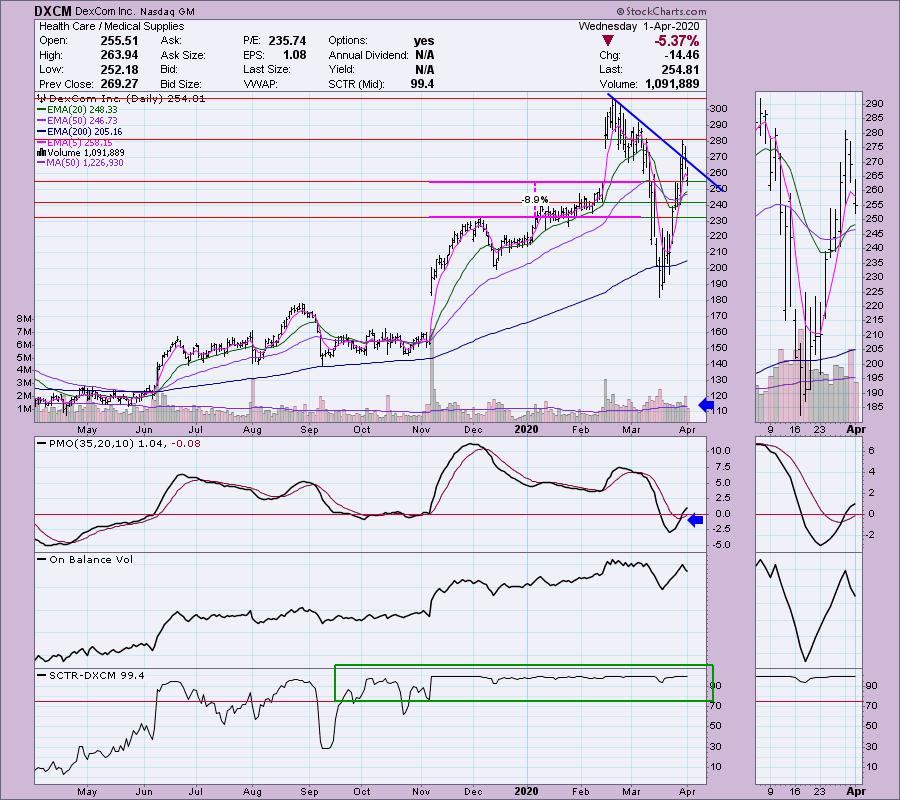
DexCom Inc (DXCM) - Earnings: 4/29/2020 (AMC)
I actually did own this one and dropped it early last week. With today's decline, it could be a decent pick up. There are few things to watch. It technically is still in a declining trend and it wasn't able to hold the breakout. However, there are positives. I like that on today's very large decline, volume pulled back to below the annual average. The PMO is on a BUY signal and we just recently got an IT Trend Model BUY signal when the 20-EMA crossed above the 50-EMA. Right now it appears that price is holding on to gap support from mid-February. A reasonable stop near the December top is palatable.
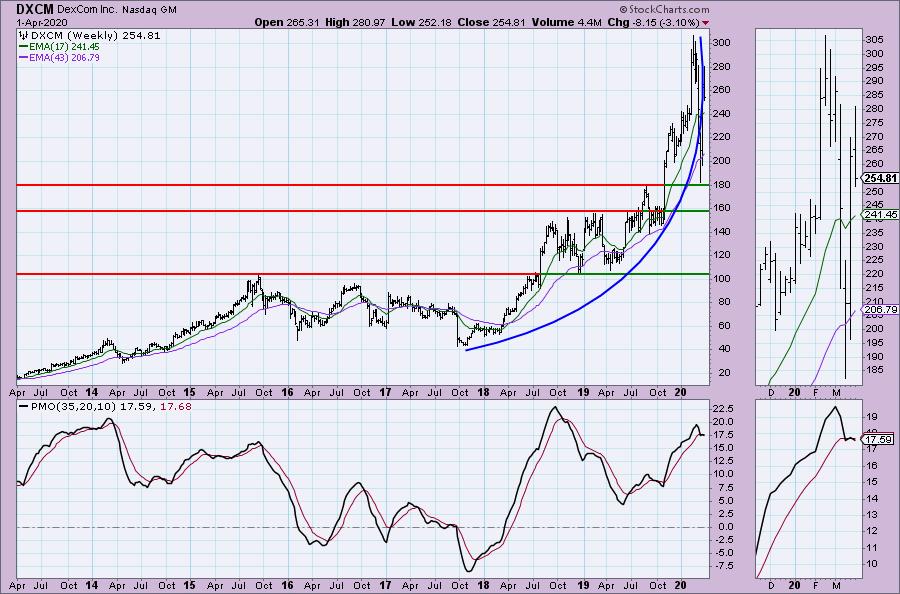
We do see the breakdown of a parabola that took price down to support. That held. We will likely see more volatile chop after coming out of that parabolic, but on a short-term basis, it could go back and challenge the 300 level.
Welcome to DecisionPoint Daily Diamonds, wherein I highlight five "diamonds in the rough." These are selected from the results of my DecisionPoint scans, which search for stocks that could benefit from the trend and condition of the market. Remember, these are not recommendations to buy or sell, but are the most interesting of the stocks that surfaced in my scans. My objective is to save you the work of the initial, tedious culling process, but you need to apply your own analysis to see if these stocks pique your interest as well. There are no guaranteed winners here!
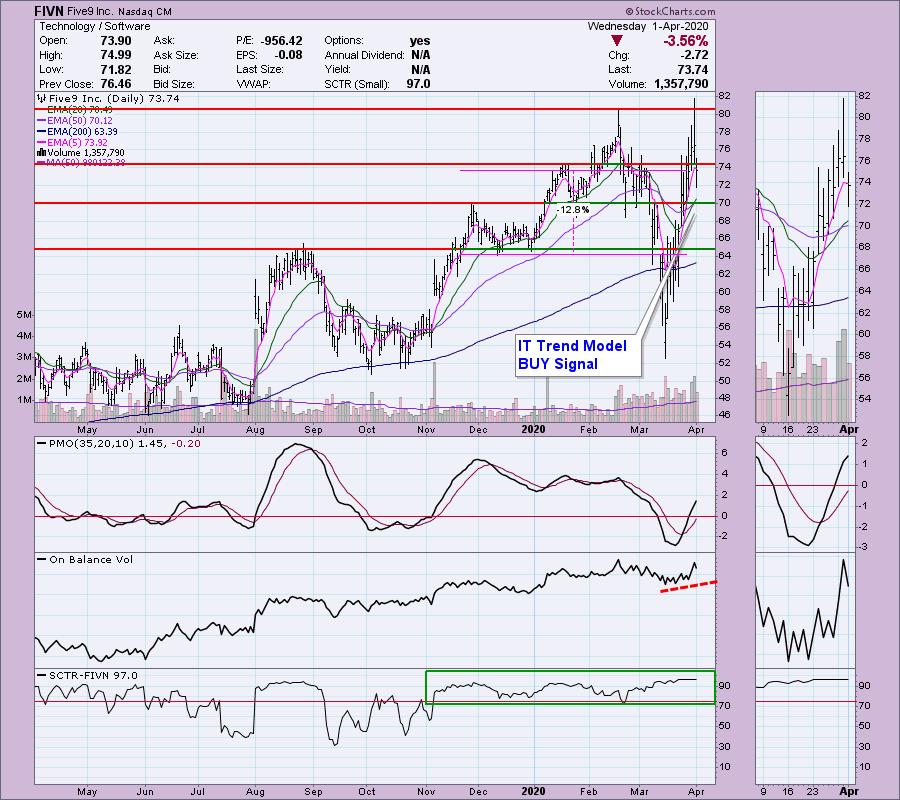
Five9 Inc (FIVN) - Earnings: 4/29/2020 (AMC)
I have to say that it is helpful doing these scans on a big down day because underneath the surface we know there is strength despite a 3.5% decline on the day. The PMO is on a BUY signal and we have a new IT Trend Model BUY signal. The OBV has been confirming this rally. The SCTR has been very strong. A stop near the August top and December lows is doable, although I might prefer something a bit tighter.
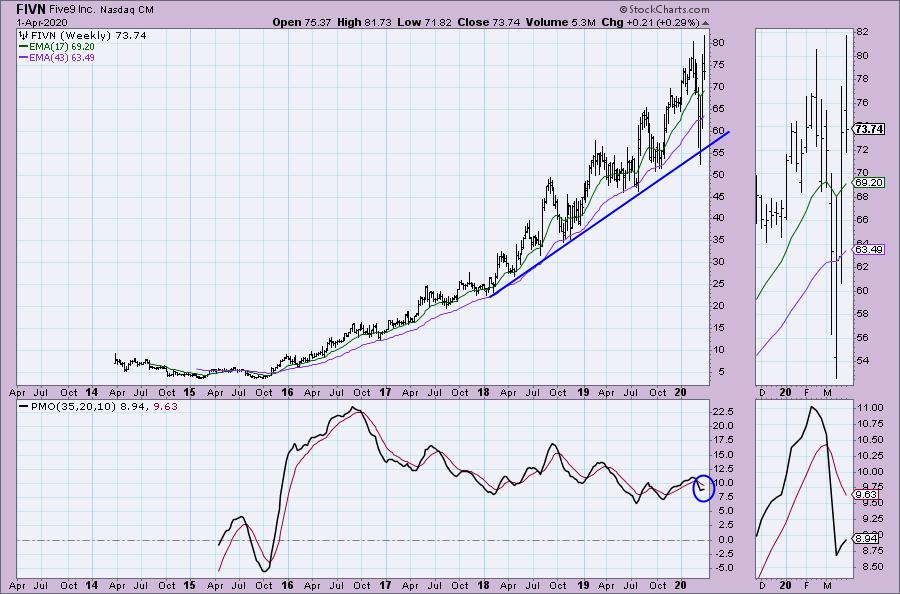
The weekly chart honestly looks very strong. The PMO has been meandering sideways, but that because the rising trend has been consistent. The bear market low for FIVN did pierce that rising bottoms trendline, but it closed above it for the week. Currently the PMO is rising.
Don't forget, on Thursdays I look at reader-requested symbols, so shoot me an email at erin@decisionpoint.com. I read every email I receive and try to answer them all!
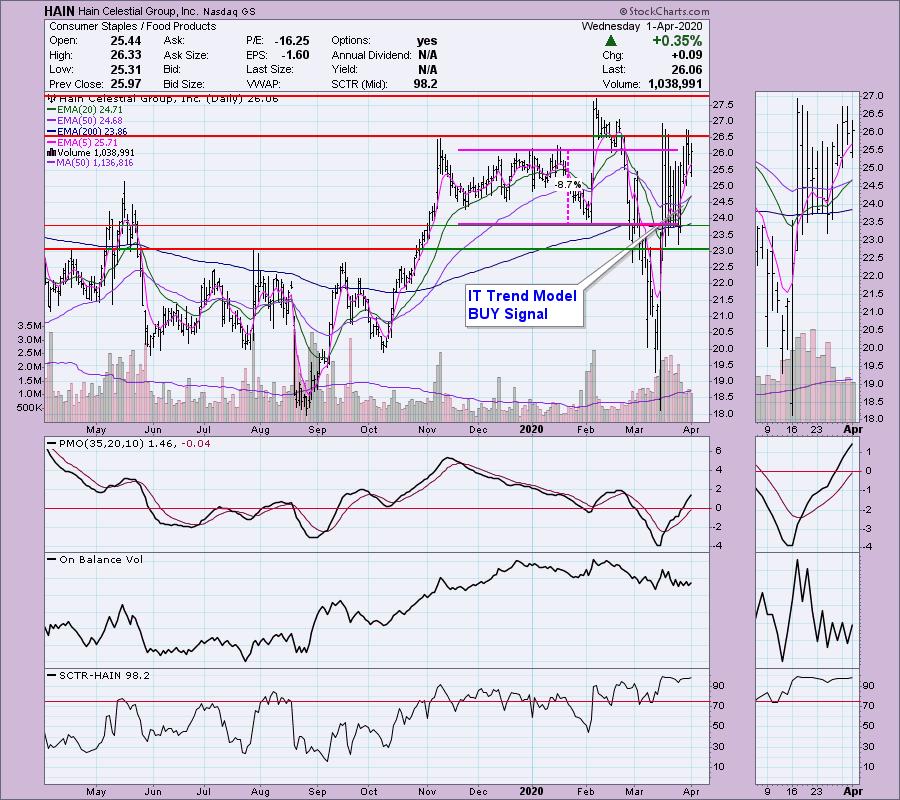
Hain Celestial Group Inc (HAIN) - Earnings: 4/29/2020 (AMC)
I'm a fan of the Consumer Staples sector. Typically this sector holds up in bear markets and generally will lead rallies in bear markets. HAIN has a PMO that just moved above zero after a nice oversold BUY signal. Today it generated an IT Trend Model BUY signal. OBV didn't lose much ground on the way down and although it isn't what I generally would like to see, compared to so many others, a sideways move could be considered healthy.
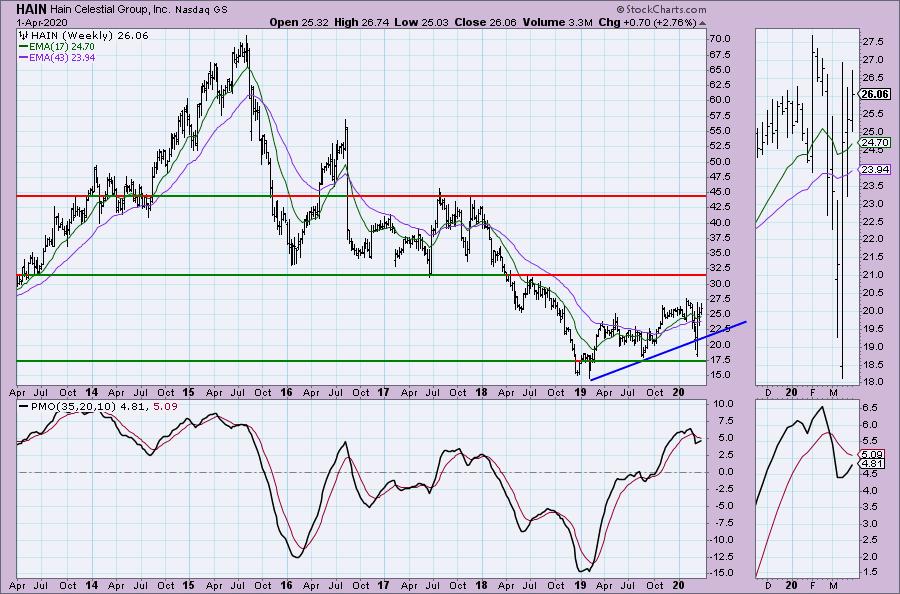
We did see the rising bottoms trendline broken, but it closed above it both times. This last time it held support and didn't need to test the 2018/2019 lows. The PMO has turned up and isn't that overbought.
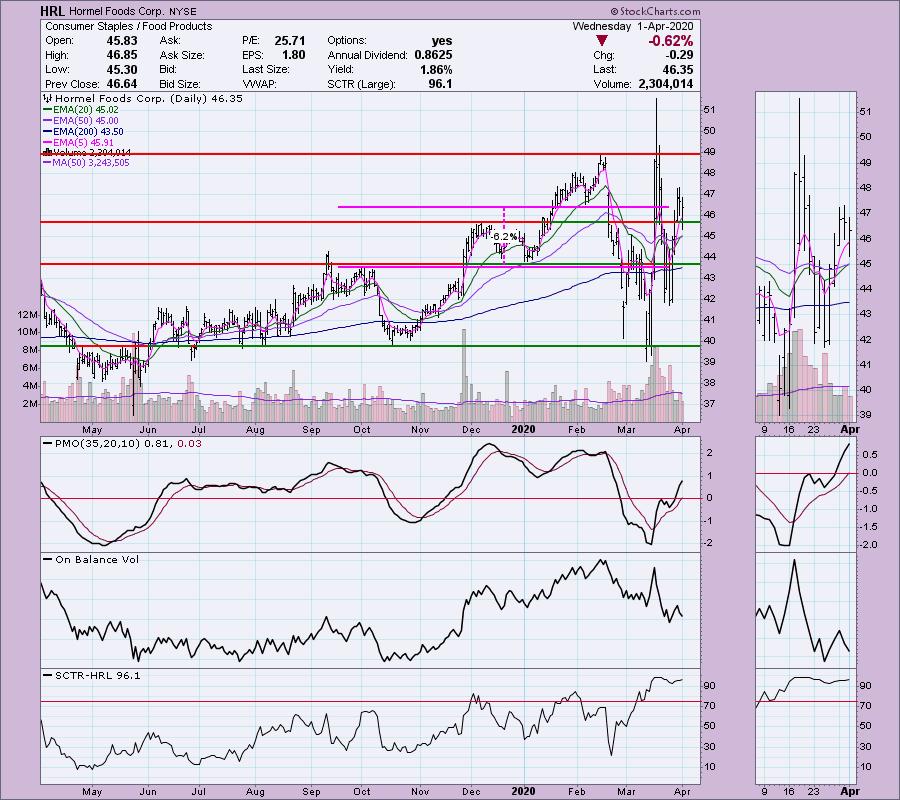
Hormel Foods Corp (HRL) - Earnings: 5/21/2020 (BMO)
Another Consumer Staple member, Hormel (HRL) has a strong PMO and like the others above, it just triggered an IT Trend Model BUY signal as the 20-EMA just barely crossed above the 50-EMA. The OBV isn't to my liking and the volatility has been especially wild. The SCTR does suggest internal and relative strength, so I think it has an opportunity to at least test the $49 level again. I'd happily take that profit and bow out.
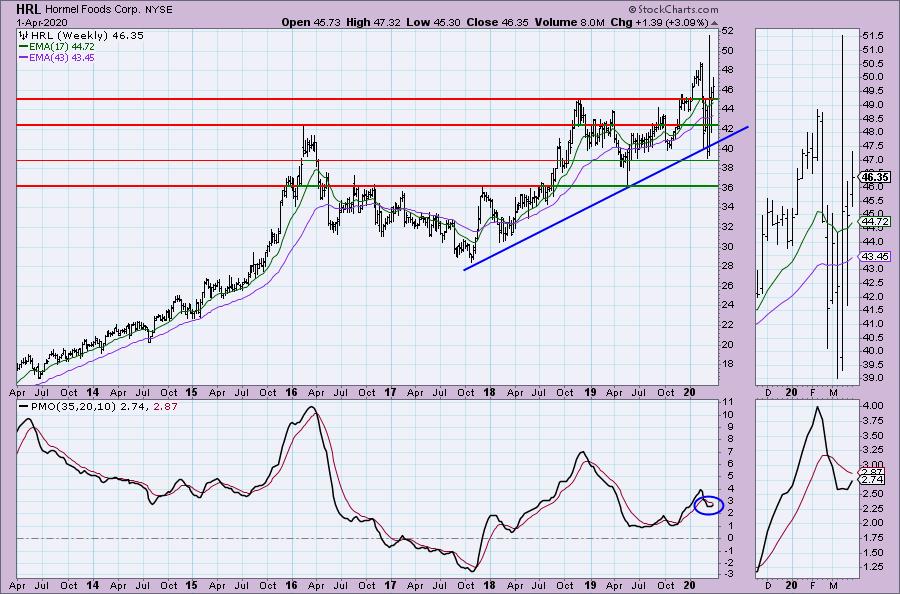
Notice on the weekly chart that the rising trend was just barely broken, but it rebounded shortly thereafter. The PMO has turned up and is not overbought.
Regeneron Pharmaceuticals Inc (REGN) - Earnings: 4/21/2020 (BMO)
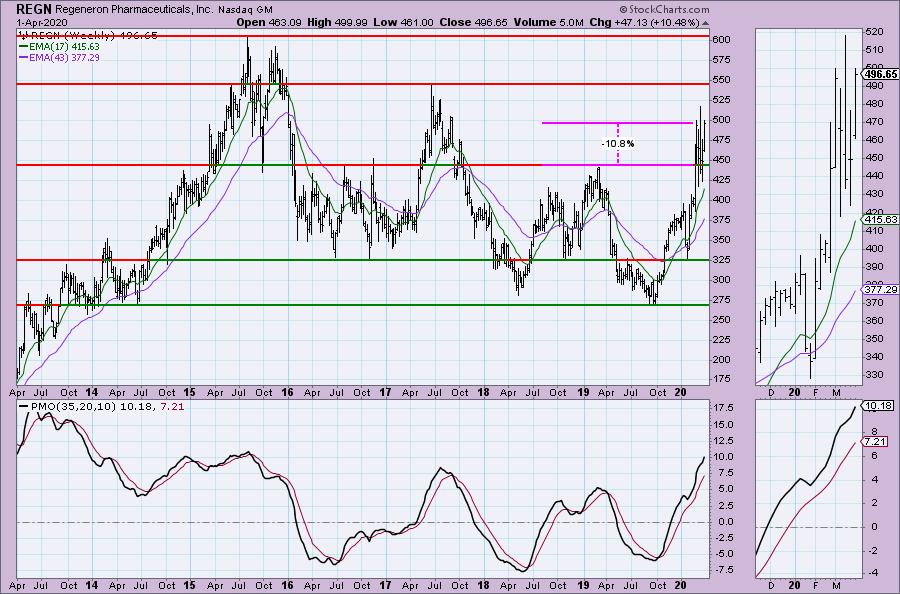
This is the repeat from March 3rd when it was $461.55. Volatility ravaged it in the meantime, but it ultimately is still up from when it hit that Diamonds report. Business channels have talked it up (which doesn't always make me comfortable given sentiment can be contrarian), but knowing the industry group is affiliated with the virus, it could remain strong. Overall, despite the volatility, it has kept up its rising trend. The PMO has turned up and is heading for a BUY signal. The OBV has been confirming all the way. Setting a tight stop will be difficult if you use support at the March lows. However, the weekly chart is helpful here.
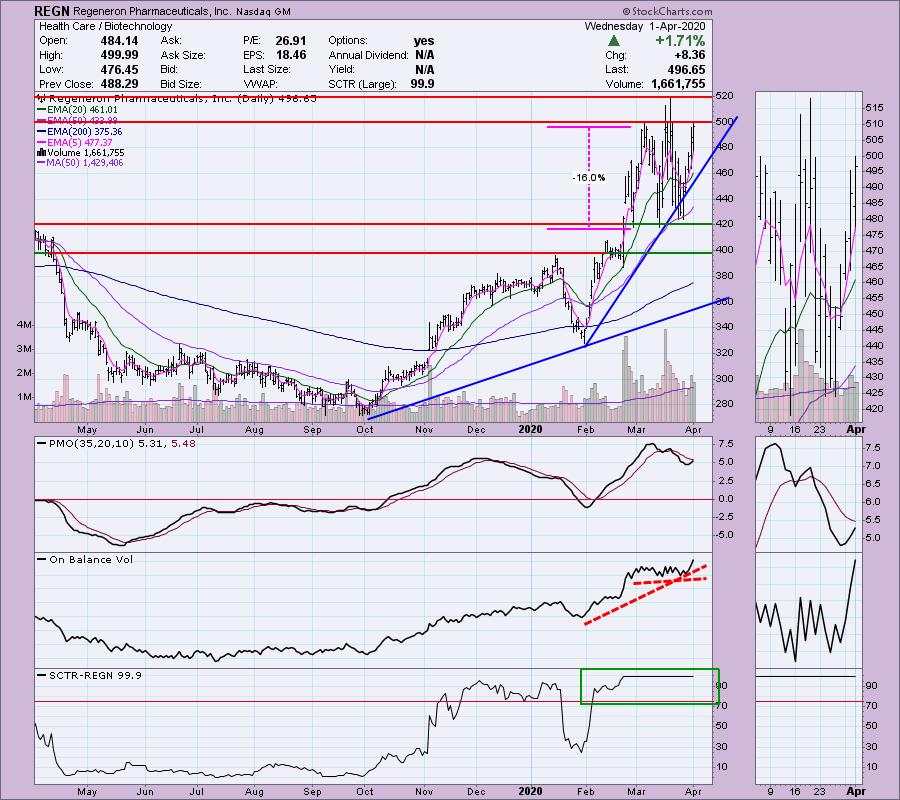
REGN has been in a very wide trading range for the past 6 years. We can see that $445 or so is a strong level of support and that is only a 11% stop level v. the 16% on the daily chart.
Current Market Outlook:
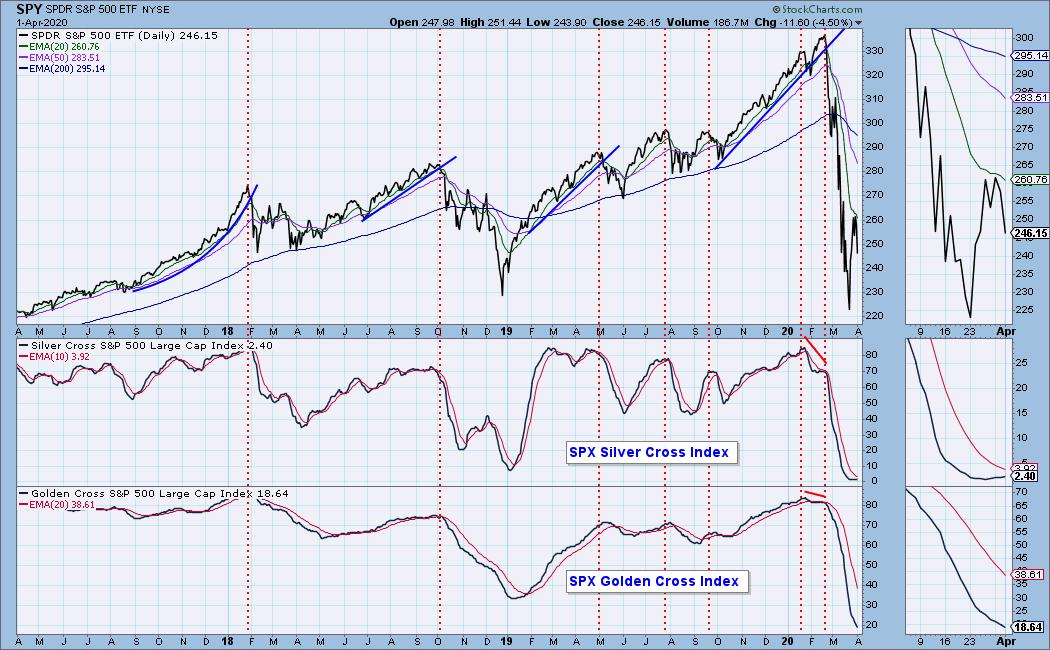
Market Environment: It is important to consider the odds for success. The Silver Cross Index measures the percentage of stocks on IT Trend Model BUY signals (20-EMA > 50-EMA), while the Golden Cross Index measures the percentage of stocks on LT Trend Model BUY signals (50-EMA > 200-EMA). Don't forget that as a "Diamonds" member, you have access to our GCI/SCI curated ChartList on DecisionPoint.com. You'll find it under "Members Only" links on the left side on the Blogs and Links Page. Here are the current percentages on the Silver and Golden Cross Indexes:
Diamond Index:
- Diamond Scan Results: 6
- Diamond Dog Scan Results: 7
- Diamond Bull/Bear Ratio: 0.86
For a more comprehensive review of current market conditions as well as analysis of Dollar, Gold, Oil and Bonds, subscribe to the DecisionPoint Alert! For a LIMITED TIME you can get a coupon code that will give you a discount for bundling your Diamonds subscription with the DecisionPoint Alert! Contact support@decisionpoint.com for more details.
Full Disclosure: I do not own any of the stocks above. I'm currently 75% in cash.

Erin Swenlin will be presenting at the The MoneyShow Las Vegas to a date to be announced in August 2020! You'll have an opportunity to meet Erin and discuss the latest DecisionPoint news and Diamond Scans. Claim your FREE pass here! You can watch online with this pass too!! There will be online events held in May and when I have more information I'll let you know.
Watch the latest episode of DecisionPoint with Carl & Erin Swenlin LIVE on Mondays 5:00p EST or on the StockCharts TV YouTube channel here!
Technical Analysis is a windsock, not a crystal ball.
Happy Charting!
- Erin
erinh@stockcharts.com
NOTE: The stocks reported herein are from mechanical trading model scans that are based upon moving average relationships, momentum and volume. DecisionPoint analysis is then applied to get five selections from the scans. The selections given should prompt readers to do a chart review using their own analysis process. This letter is not a call for a specific action to buy, sell or short any of the stocks provided. There are NO sure things or guaranteed returns on the daily selection of "diamonds in the rough."
Helpful DecisionPoint Links:
DecisionPoint Shared ChartList and DecisionPoint Chart Gallery
Price Momentum Oscillator (PMO)
Swenlin Trading Oscillators (STO-B and STO-V)
For more links, go to DecisionPoint.com!