
After I reviewed the results from my scans, I ended up with four stocks that begin with the letter "B" and a "D". I just want to assure you that I looked at all of my results from A to Z and it coincidentally happened that today's Diamonds are at the beginning of the alphabet.
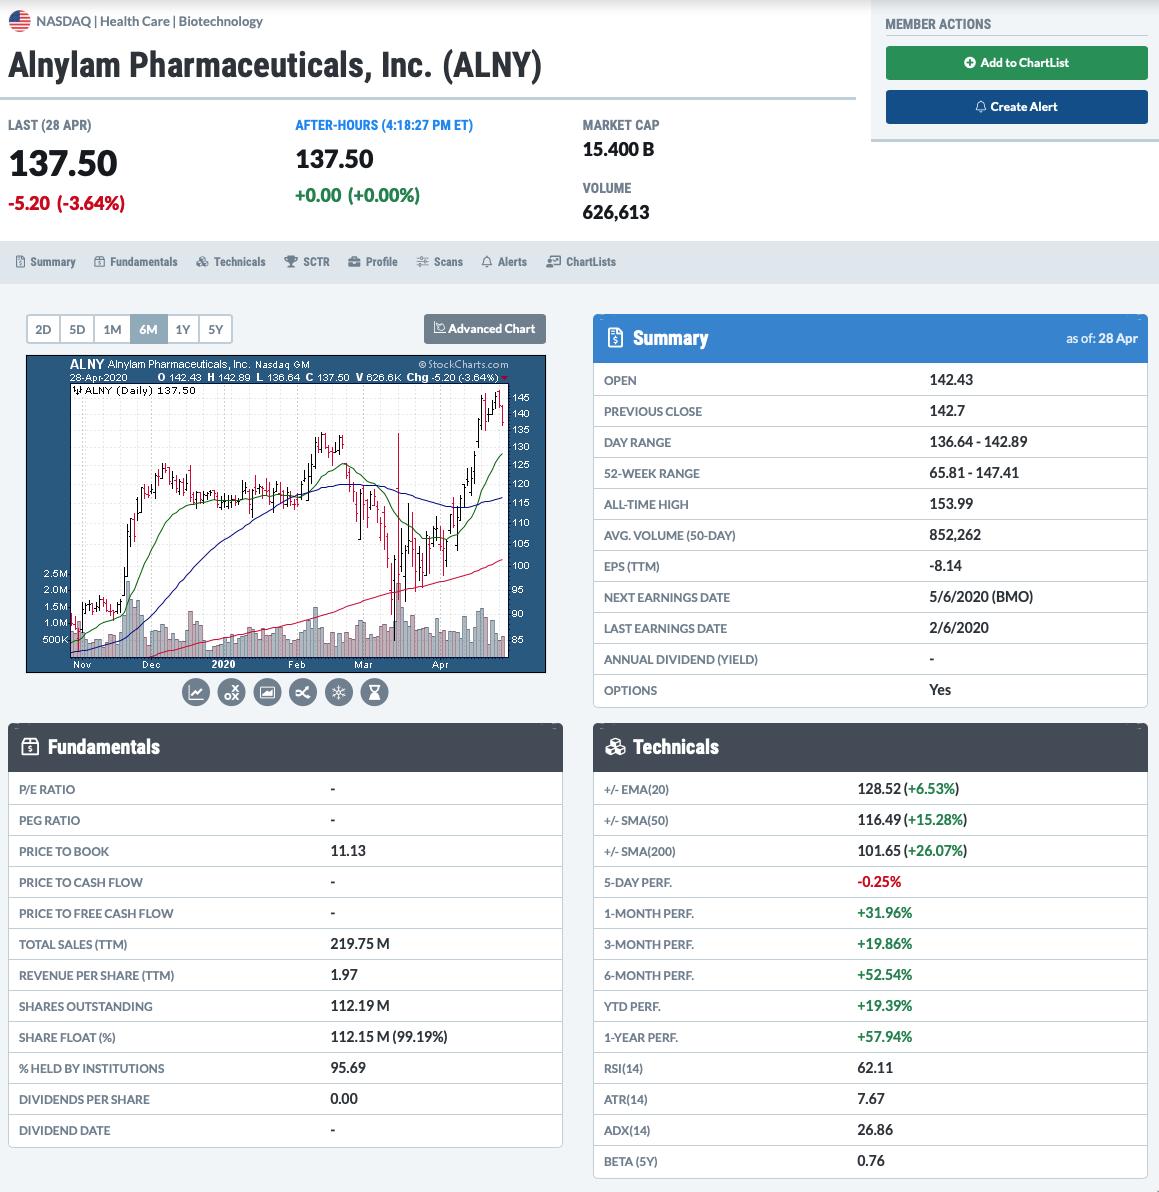
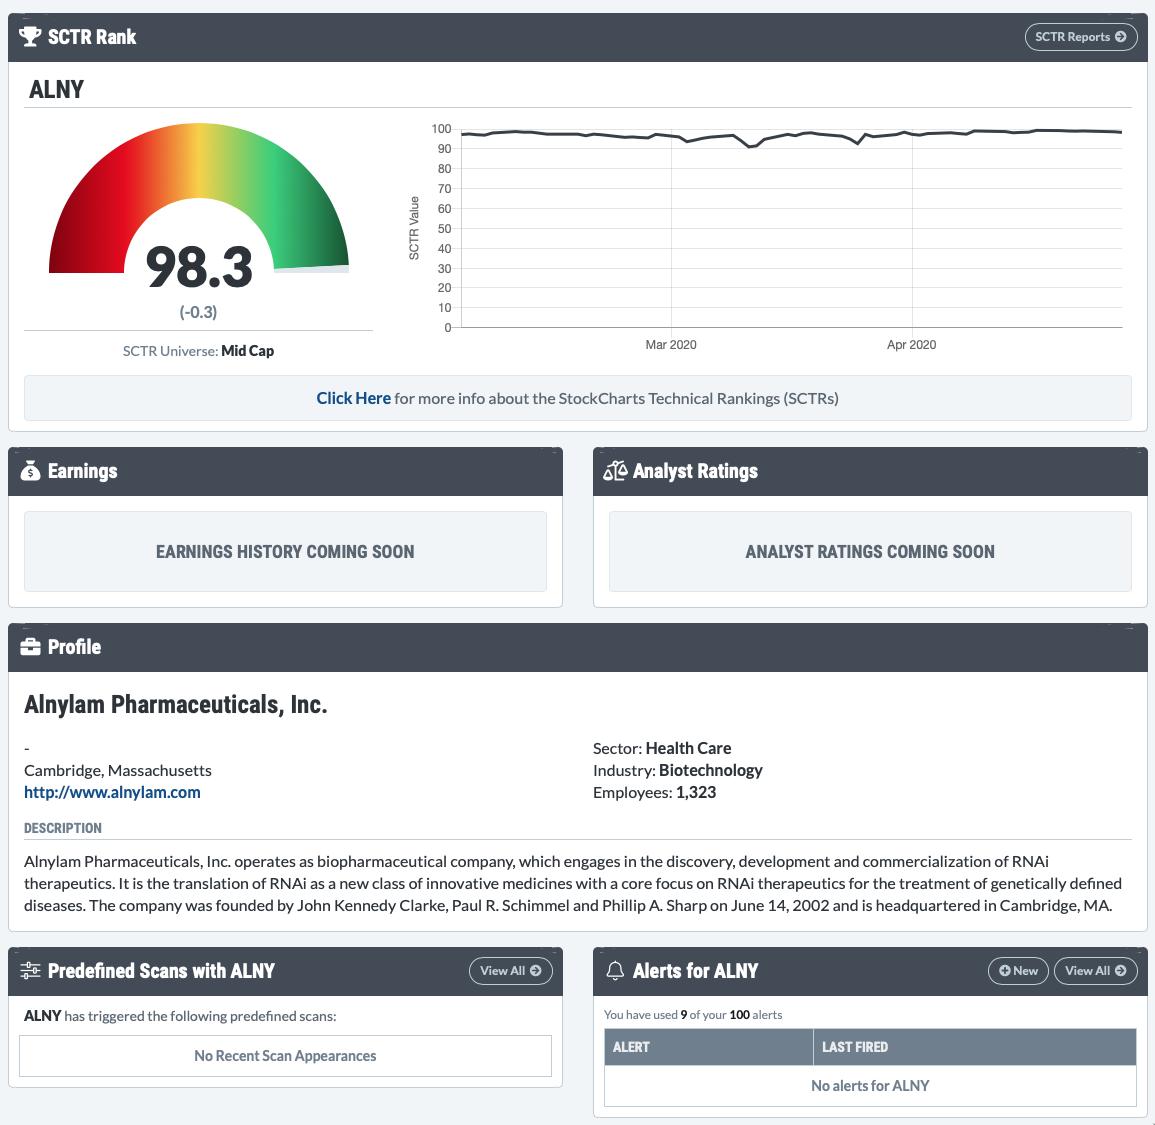
I recently had an email from a subscriber who asked if I could start adding a few lines about what the company does. I will do that if it makes sense. For example, I don't think anyone needs to know what Costco or Amazon does. But, I wanted to let you know that on StockCharts.com, if you put a symbol in at the top of the page and then click on the dropdown to the left, select "symbol summary" you will be presented with that information and much more. It's where I get earnings now. Below are a few images of what I'm talking about:


Live Trading Room - Tuesdays/Thursdays
I'm teaming up with Mary Ellen McGonagle (MEMInvestmentResearch.com) to do regular "LIVE Trading Room" sessions for FREE at 11:00a EST. We've had excellent reviews on our new LIVE Trading Rooms so far and plan on continuing them Tuesdays/Thursdays 11:00a EST. The link will be sent out the day before the event, so watch your email and tell your colleagues to sign up for our free email list on DecisionPoint.com to be notified!
** Here is the link to the recording of today's (4/28) live trading room.**
Black Knight Inc (BKI) - Earnings: 5/5/2020 (BMO)
Black Knight, Inc. engages in the provision of integrated software, data and analytics solutions. It operates through the Software Solutions, and Data and Analytics segments. The Software Solutions segment offers software and hosting solutions that support loan servicing, loan origination, and settlement services. The Data and Analytics segment refers to the data and analytics solutions to the mortgage, real estate and capital markets verticals.
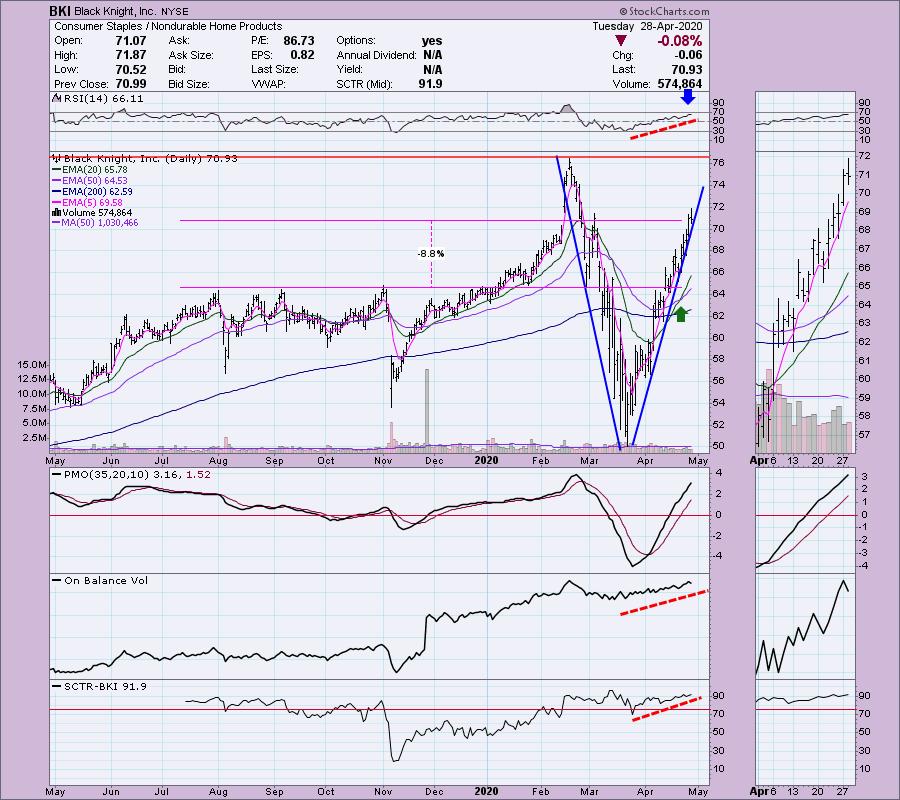
A company that supports loan servicing is probably a good place to invest fundamentally simply based on the Payroll Protection Plan loans that are being disbursed at an increasingly high rate...that's my back of the napkin thoughts. Technically the chart is strong. I wish we got in back in March, but we have a "V" bottom and the expectation is a minimum upside target at the left top. We just had a Silver Cross IT Trend Model BUY signal. The PMO is strong and the RSI is above net neutral or 50 which is bullish. I like that the stop matches up so beautifully with the 2019 tops.
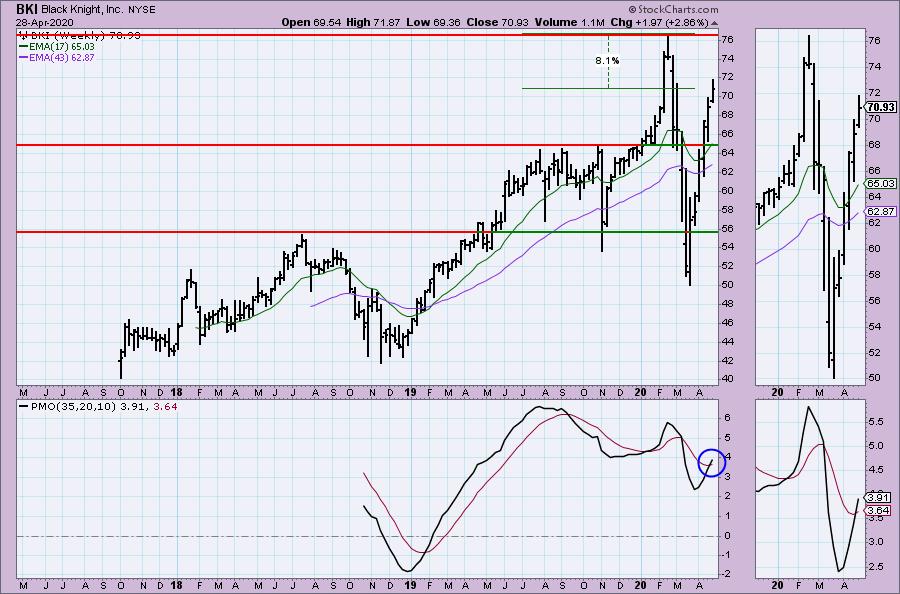
While upside potential is mediocre, I do believe it will begin making new all-time highs soon. The weekly PMO is getting ready to log a crossover BUY signal after the chart goes final at the end of trading on Friday.
Welcome to DecisionPoint Daily Diamonds, wherein I highlight five "diamonds in the rough." These are selected from the results of my DecisionPoint scans, which search for stocks that could benefit from the trend and condition of the market. Remember, these are not recommendations to buy or sell, but are the most interesting of the stocks that surfaced in my scans. My objective is to save you the work of the initial, tedious culling process, but you need to apply your own analysis to see if these stocks pique your interest as well. There are no guaranteed winners here!
Bristol Myers Squibb Co (BMY) - Earnings: 7/16/2020 (BMO)
Today BMY pulled back to support. I would watch this one before entry, I would want it to hold that support. Otherwise I might wait until it tests the 20-EMA. The RSI is trending higher and is not at all overbought. The PMO still has room to move higher and we know that this is a strong company in a frenetic industry right now.
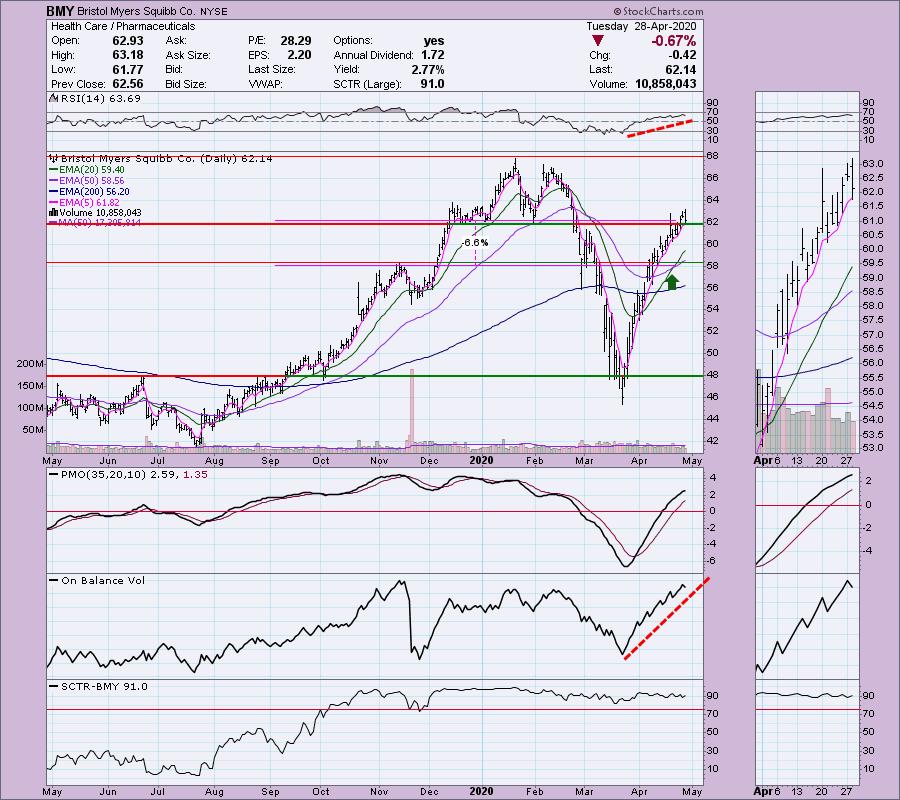
BMY has a VERY wide trading range and we are technically near the top of it. You can see that support on the daily chart has significant long-term strength given the many "touches". We want it to hold here or not much further below it. It could turn into staunch resistance if price falls much below it. The weekly PMO is rising nicely.
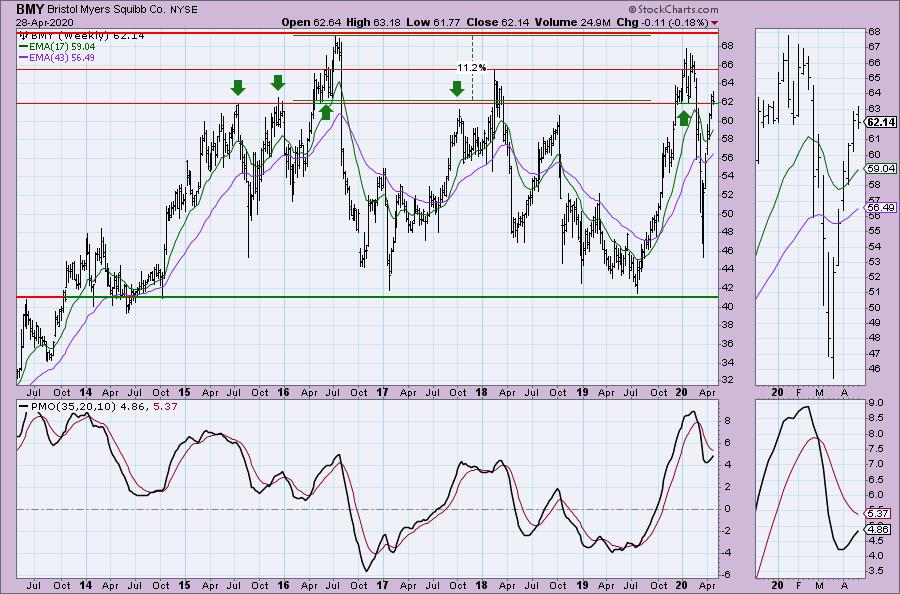
Don't forget, on Thursdays I look at reader-requested symbols, so shoot me an email at erin@decisionpoint.com. I read every email I receive and try to answer them all!
BioXcel Therapeutics Inc (BTAI) - Earnings: 5/7/2020 (BMO)
BioXcel Therapeutics, Inc. is a clinical stage biopharmaceutical company, which focuses on drug development. The firm's two clinical development programs are BXCL501, a sublingual thin film formulation designed for acute treatment of agitation resulting from neurological and psychiatric disorders, and BXCL701, an immuno-oncology agent designed for treatment of a rare form of prostate cancer and for treatment of pancreatic cancer.
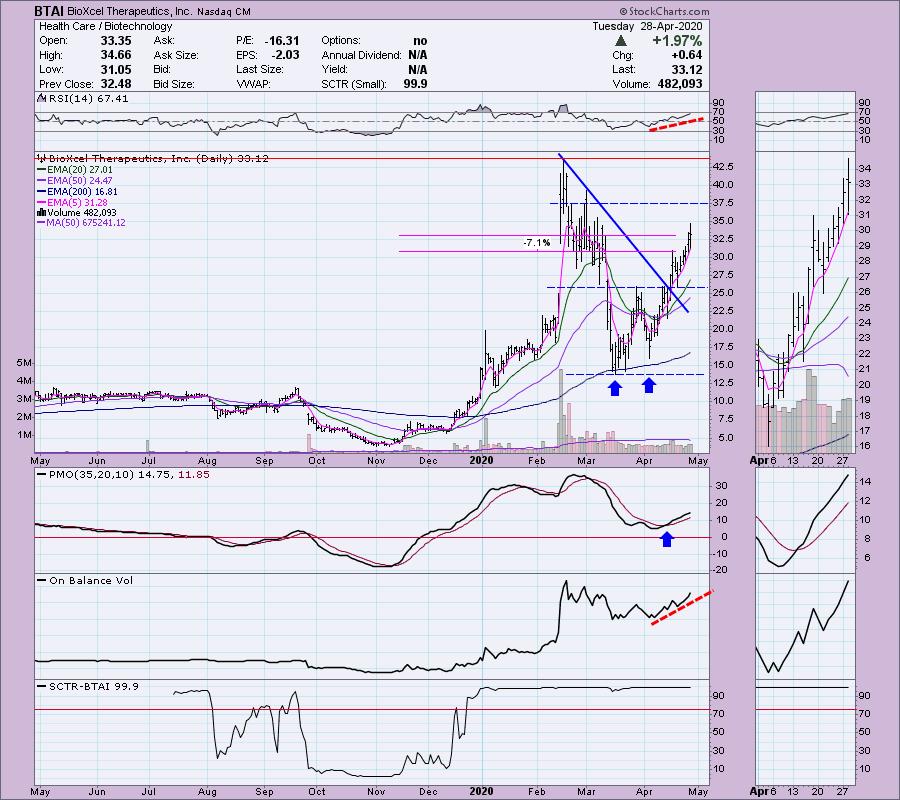
BTAI is in a rising trend, not a parabolic move. The double-bottom pattern executed and has nearly reached its minimum upside target around $37.50. I am expecting it to challenge all-time highs. The RSI is rising and isn't too overbought. We've got a PMO BUY signal and plenty of room for the PMO to move higher before becoming overbought. I've marked a stop level that matches to the recent top in mid-April.
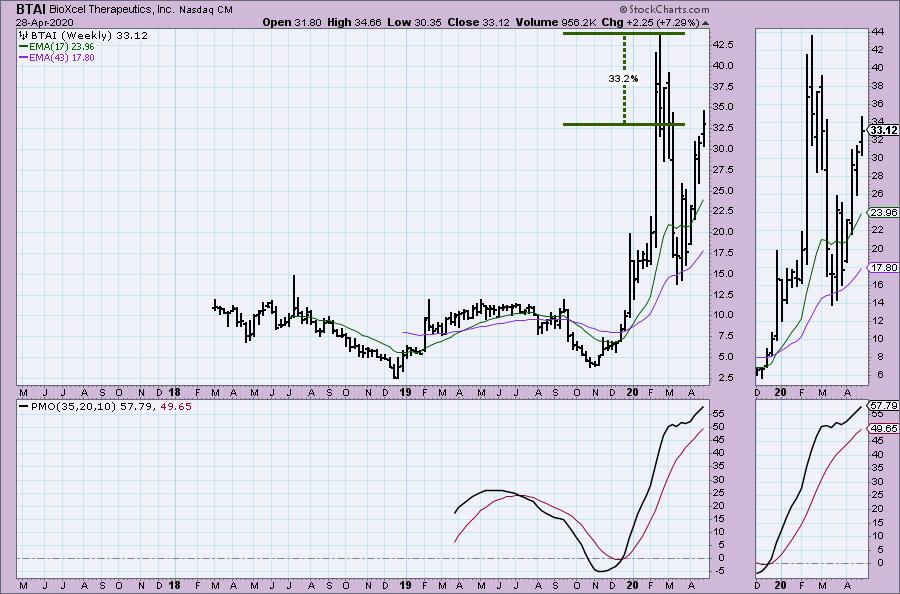
Upside potential is fabulous. We don't have enough data to know whether the PMO is totally overbought. The main thing is that it is rising.
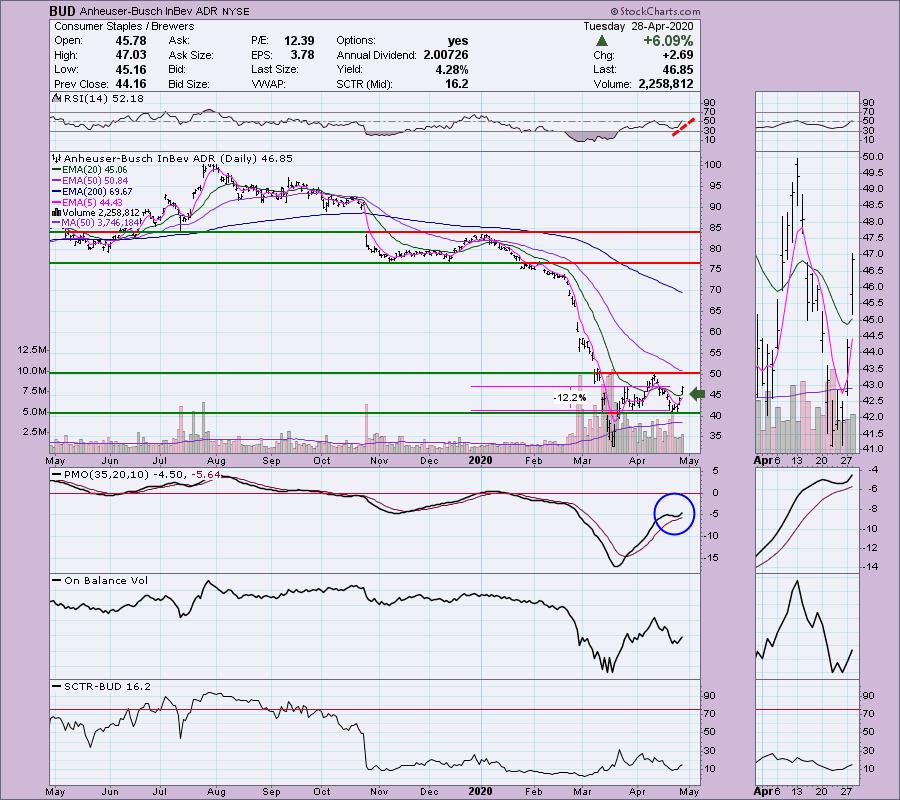
Anheuser-Busch InBev ADR (BUD) - Earnings: 5/6/2020 (BMO)
BUD has been beat down horribly, but it does appear to be coming back to life after holding support at around $40. Today it gapped up and traded above its 20-EMA. It does report earnings late next week so be ready. The stop isn't the greatest, but if we get a pullback on today's move, it will be more comfortable for me. The RSI has perked up on this week's rally. Most importantly we have a PMO bottom above the signal line and I find that especially bullish.
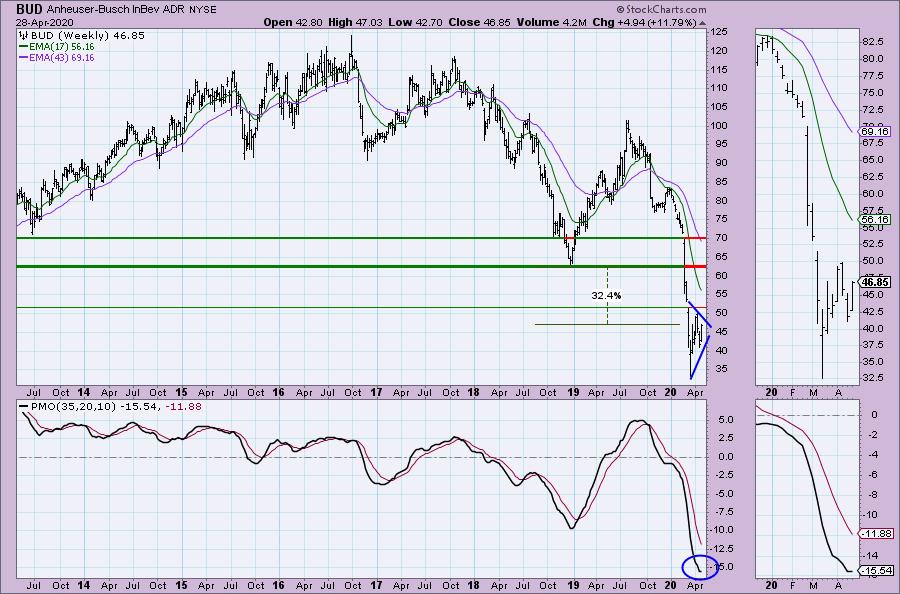
Upside potential is dreamy. 32% + just to reach overhead resistance at the 2018 low. Beware of the symmetrical triangle. They are generally continuation patterns which would suggest a breakdown not a breakout. The weekly PMO is turning up and that helps.
Denali Therapeutics Inc (DNLI) - Earnings: 5/7/2020 (AMC)
Denali Therapeutics, Inc. is a biopharmaceutical company, which engages in the development and commercialization of a portfolio of product candidates for neurodegenerative diseases. Its product pipeline includes LRRK2, RIPK1, TREM2, and Tau.
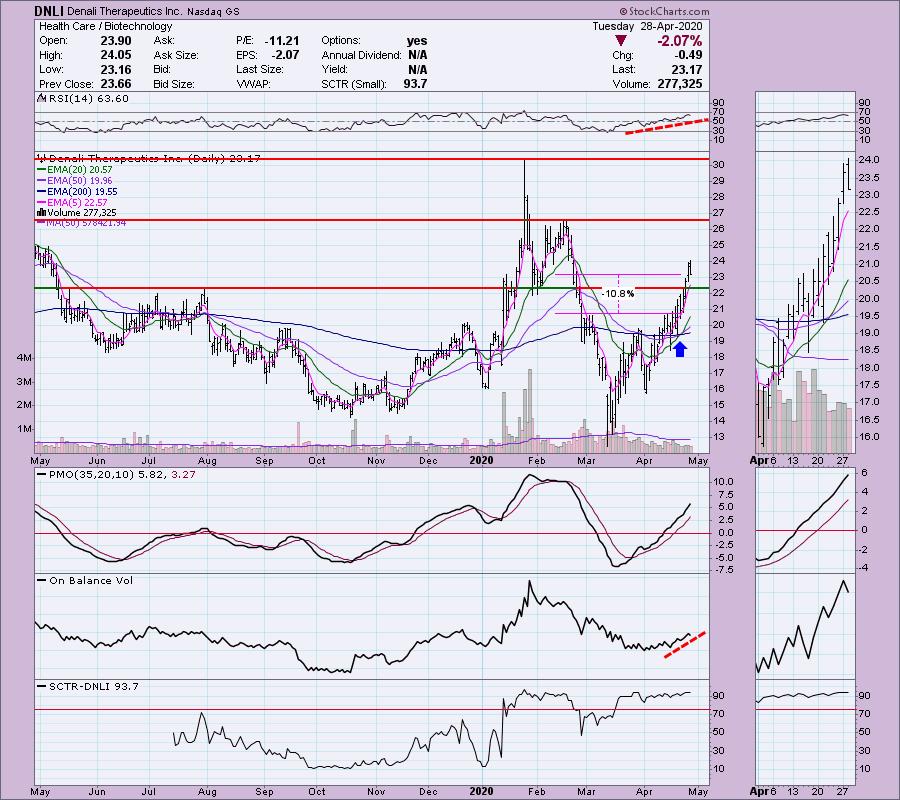
The RSI is rising and is above 50. The PMO is rising and isn't overbought. I set the stop area around the intermediary tops from early March and just above the late 2019 tops. The PMO is not overbought and continues to rise. We saw quite a pullback today. I actually would look for a bit more downside given that price closed on its low for the day.
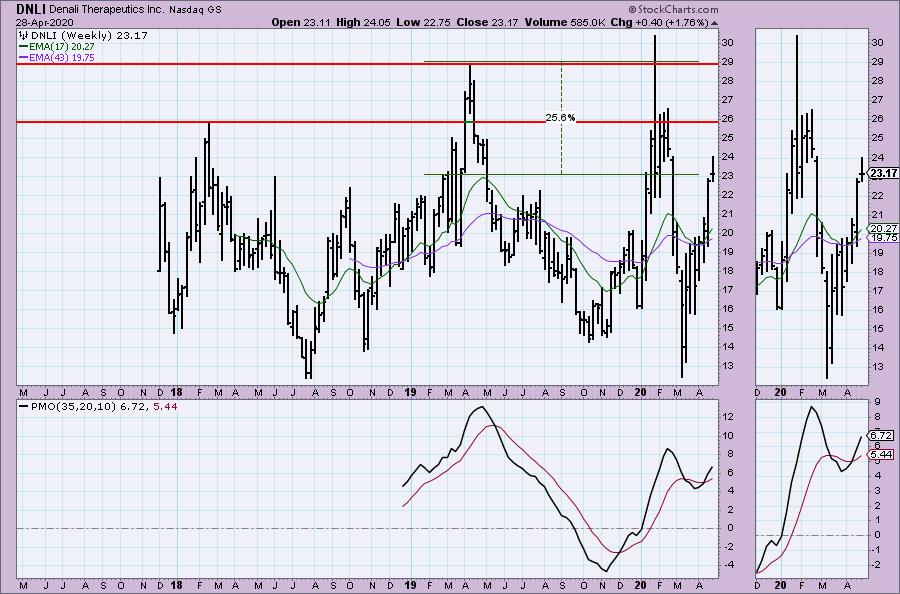
Upside potential looks great on this one as well. Note that we want that $22.50 to $23.00 area to hold up for support. The PMO suggests we should see price at least challenge the 2018 top.
Current Market Outlook:
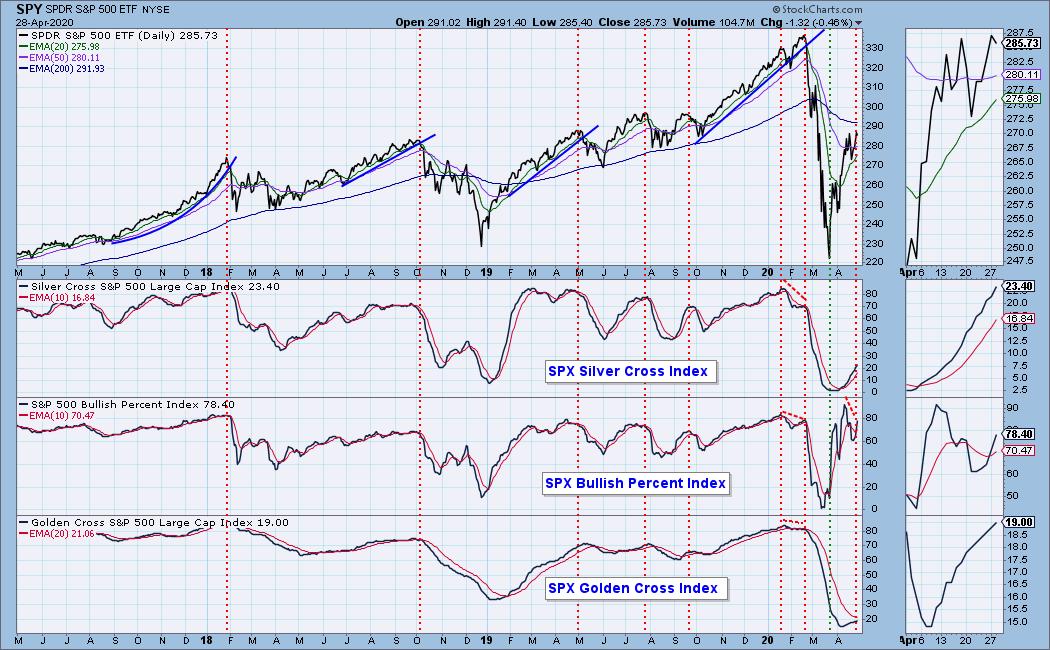
Market Environment: It is important to consider the odds for success. The Silver Cross Index measures the percentage of stocks on IT Trend Model BUY signals (20-EMA > 50-EMA), while the Golden Cross Index measures the percentage of stocks on LT Trend Model BUY signals (50-EMA > 200-EMA). Don't forget that as a "Diamonds" member, you have access to our GCI/SCI curated ChartList on DecisionPoint.com. You'll find it under "Members Only" links on the left side on the Blogs and Links Page. Here are the current percentages on the Silver and Golden Cross Indexes:
Diamond Index:
- Diamond Scan Results: 0
- Diamond Dog Scan Results: 23
- Diamond Bull/Bear Ratio: 0.00
For a more comprehensive review of current market conditions as well as analysis of Dollar, Gold, Oil and Bonds, subscribe to the DecisionPoint Alert! For a LIMITED TIME you can get a coupon code that will give you a discount for bundling your Diamonds subscription with the DecisionPoint Alert! Contact support@decisionpoint.com for more details.
Full Disclosure: I like BUD and will probably be stalking it on a 30 min and 5 min chart tomorrow for a possible entry. I'm currently 20% in cash. My trading timeframe has moved from intermediate-term to short-term and therefore I'm investing more.

Erin Swenlin will be presenting at the The MoneyShow Las Vegas August 16 - 20 at Bally's/Paris Resort! You'll have an opportunity to meet Erin and discuss the latest DecisionPoint news and Diamond Scans. Claim your FREE pass here! You can watch online with this pass too!! There will be online events held in May and when I have more information I'll let you know.
Watch the latest episode of DecisionPoint with Carl & Erin Swenlin LIVE on Wednesdays 5:00p EST or on the StockCharts TV YouTube channel here!
Technical Analysis is a windsock, not a crystal ball.
Happy Charting!
- Erin
erinh@stockcharts.com
NOTE: The stocks reported herein are from mechanical trading model scans that are based upon moving average relationships, momentum and volume. DecisionPoint analysis is then applied to get five selections from the scans. The selections given should prompt readers to do a chart review using their own analysis process. This letter is not a call for a specific action to buy, sell or short any of the stocks provided. There are NO sure things or guaranteed returns on the daily selection of "diamonds in the rough."
Helpful DecisionPoint Links:
DecisionPoint Shared ChartList and DecisionPoint Chart Gallery
Price Momentum Oscillator (PMO)
Swenlin Trading Oscillators (STO-B and STO-V)
For more links, go to DecisionPoint.com!