
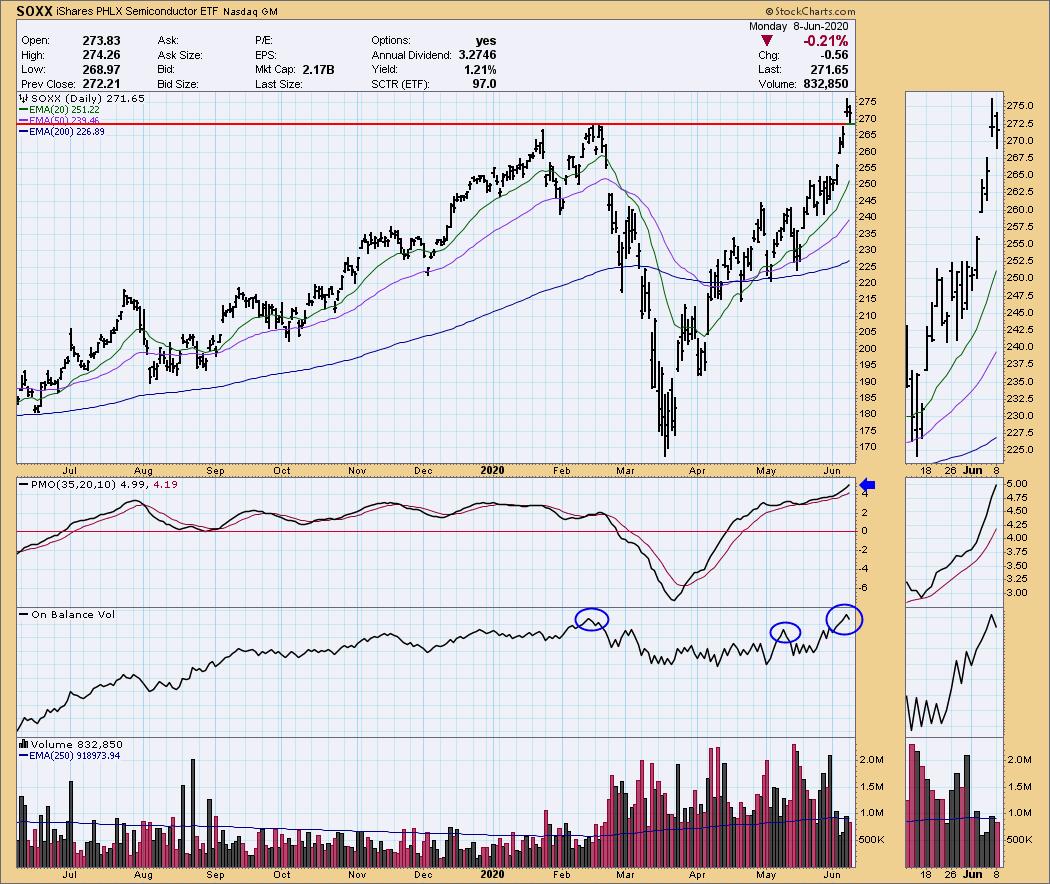
As I reviewed my scans, I noticed a theme in Technology, particularly in the Semiconductor and Software industry groups. I zeroed in on my favorites, the ones that still have some room to run and have very positive momentum. I also added another Medical Equipment company that may be showing some early potential on a new rally. Let's take a look quickly at SOXX, the ETF that tracks to the Semiconductor industry group. We can see a nice breakout to new highs and a pullback today that brought price right to the breakout point. As many of you know, I love finding the stocks that have broken out and then pulled back to support. They showed strength on the breakout and likely took a hit to profit taking. If there is internal strength and positive indicators, these stocks can be excellent short-term investments. This ETF has rising momentum and the OBV is confirming, not only with rising bottoms, but also showing an OBV top that is above the prior two. This tells us that volume did come in on this breakout.
** Announcements **
I will be traveling July 1 - July 15. I will be writing on the road, but broadcasting will be suspended during that time. It's going to be an adventurous road trip for me and my husband. We will be taking a train from Los Angeles to New Orleans, visiting family, checking out retirement areas and then renting a car and making our way back to California with various stops along the way. I'll be sure to post a picture or two and I'm sure I'll have funny stories to share along the way. It'll be interesting to see the various stages of the reopening of America.
A heads up to Bundle subscribers, the LIVE Trading Room will be going on hiatus as Mary Ellen will also be out of pocket in the upcoming month. We hope to reopen in late-July. Please direct questions to erin@decisionpoint.com.
Welcome to DecisionPoint Daily Diamonds, wherein I highlight five "diamonds in the rough." These are selected from the results of my DecisionPoint scans, which search for stocks that could benefit from the trend and condition of the market. Remember, these are not recommendations to buy or sell, but are the most interesting of the stocks that surfaced in my scans. My objective is to save you the work of the initial, tedious culling process, but you need to apply your own analysis to see if these stocks pique your interest as well. There are no guaranteed winners here!
Amkor Technology Inc (AMKR) - Earnings: 7/27/2020 (AMC)
Amkor Technology, Inc. provides outsourced semiconductor packaging and test services. Its services include design, package characterization, test and wafer bumping services. The firm's operations include production facilities, product development centers, and sales and support offices.
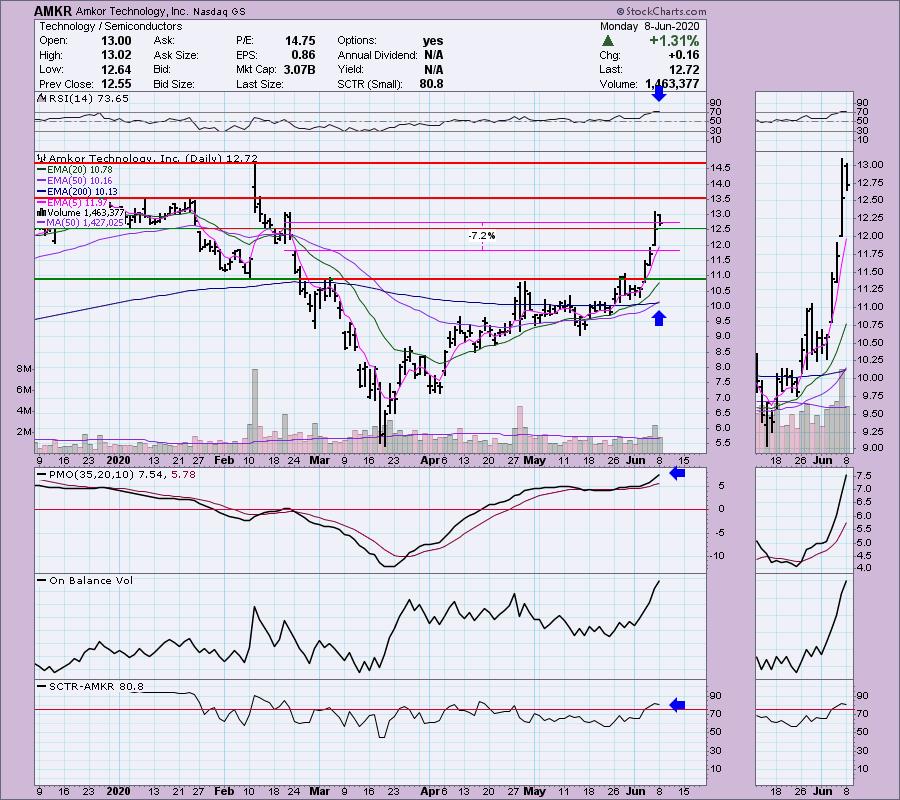
While the RSI is somewhat overbought here, there are a lot of positives here. Price broke out on Friday, but today it pulled back off its high to settle just above the breakout point. Volume is certainly coming in. The PMO is now rising and while it might appear overbought, we can see on the downside of the range it went past -10. This suggests that the range on the topside could be +10. The SCTR is above 75. One of the best parts of this chart is the new LT Trend Model "Golden Cross" BUY signal that triggered today. This gives the chart a long-term bullish bias. I put a stop level in at gap support from February. You could certainly go deeper to $11, but that's nearly 15% below current price levels.
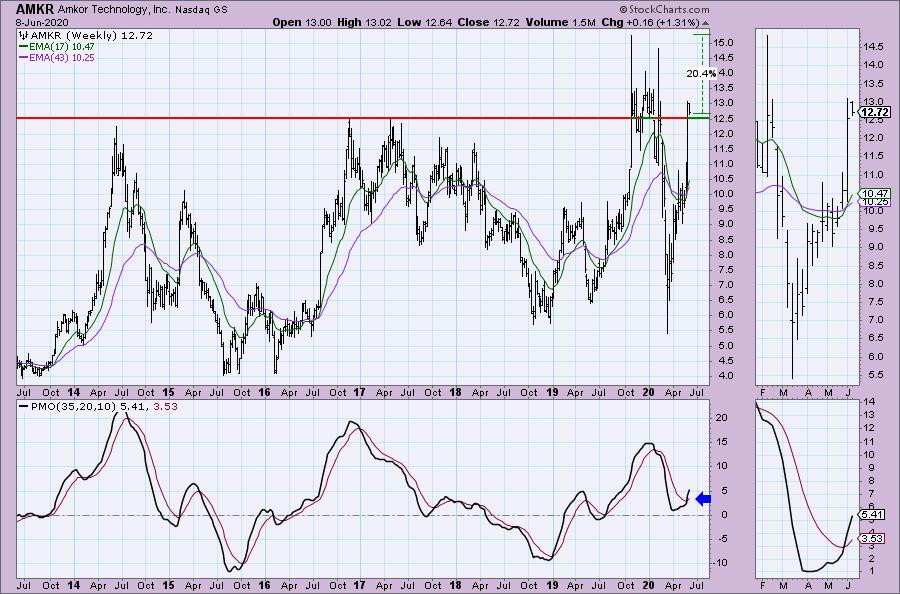
Last Friday's breakout was very important. It managed to break above previous multi-year highs. I always like seeing a NEW weekly PMO BUY signal.
Lam Research Corp (LRCX) - Earnings: 7/29/2020 (AMC)
Lam Research Corp. engages in manufacturing and servicing of wafer processing semiconductor manufacturing equipment. It operates through the following geographical segments: the United States, China, Europe, Japan, Korea, Southeast Asia, and Taiwan. It offers thin film deposition, plasma etch, photoresist strip, and wafer cleaning.
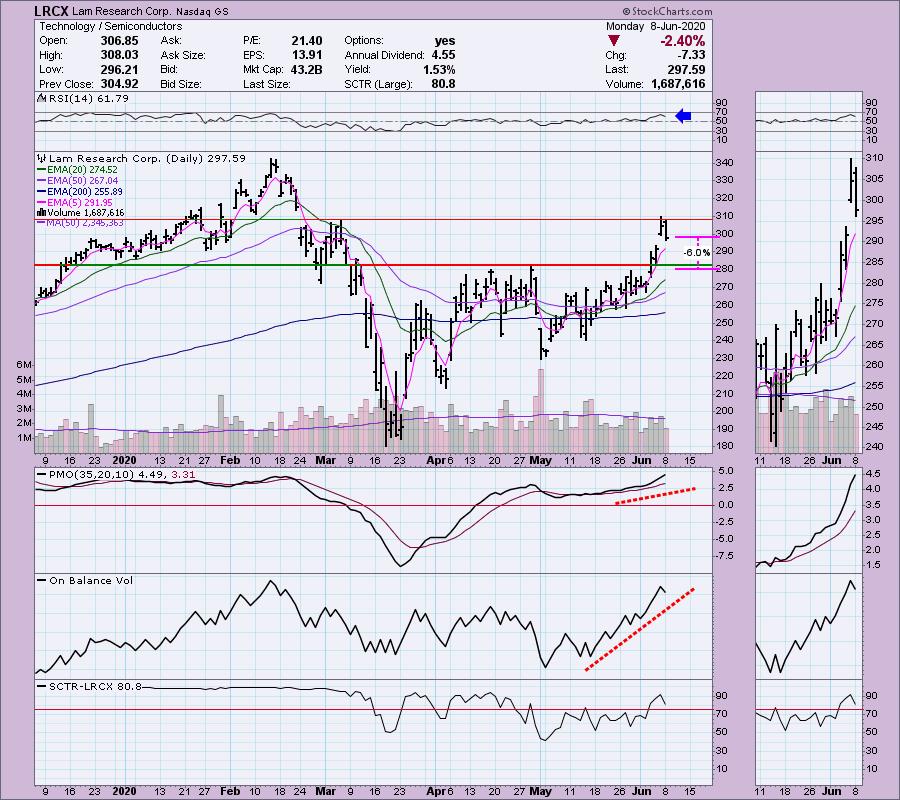
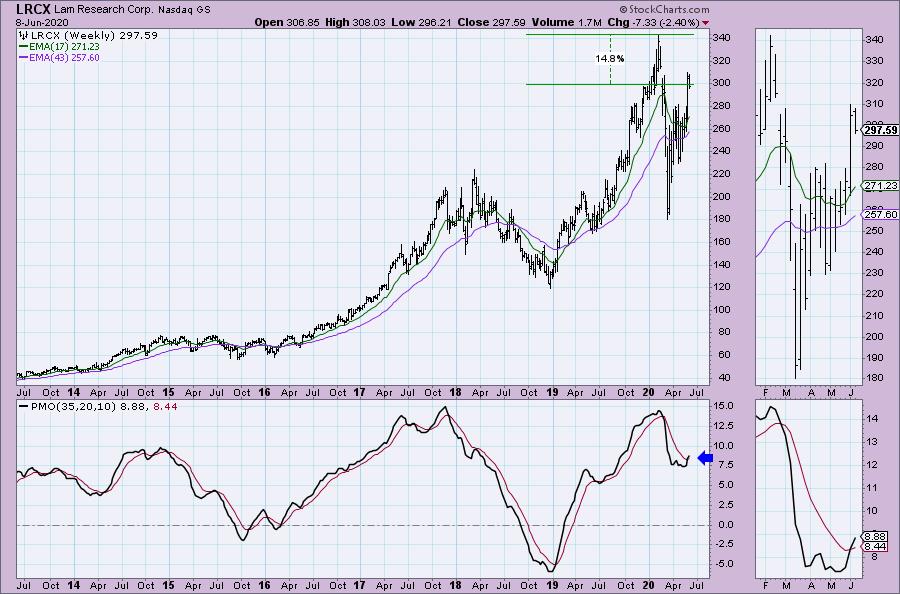
While we didn't get a short-term breakout above the March top, it came very close. The PMO is suggesting we will see higher prices so today's 2.4% pullback could give us some built in profit. The RSI is above net neutral (50) and the OBV is certainly confirming this move. The SCTR declined, but it is still healthy above 75. You could set up a stop level just below the April tops.
Here is another chart with a new weekly PMO crossover BUY signal. Upside potential/target would be all-time highs with a nearly 15%+ gain.
Don't forget, on Thursdays I look at reader-requested symbols, so shoot me an email at erin@decisionpoint.com. I read every email I receive and try to answer them all!
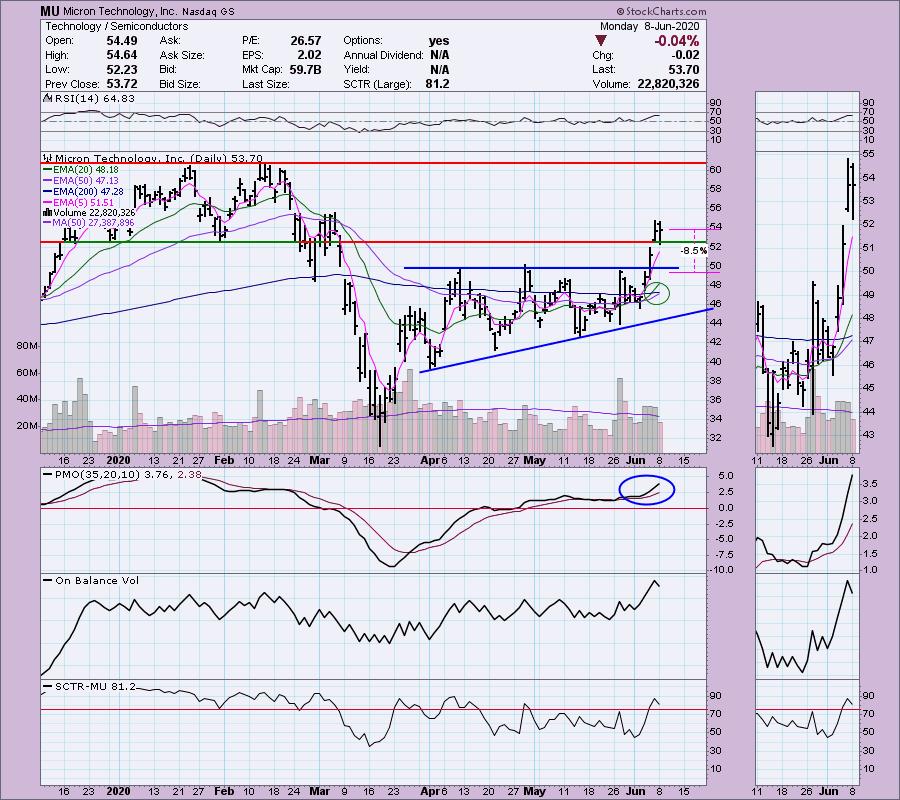
Micron Technology Inc (MU) - Earnings: 6/29/2020 (AMC)
Micron Technology, Inc. engages in the provision of innovative memory and storage solutions. It operates through the following segments: Compute and Networking Business Unit (CNBU); Mobile Business Unit (MBU); Storage Business Unit (SBU); and Embedded Business Unit (EBU). The Compute and Networking Business Unit segment includes memory products sold into cloud server, enterprise, client, graphics, and networking markets. The Mobile Business Unit segment offers memory products sold into smartphone, and other mobile-device markets. The Storage Business Unit segment comprises of SSDs and component-level solutions sold into enterprise and cloud, client, and consumer solid-state drive (SSD) markets, other discrete storage products sold in component and wafer forms to the removable storage markets, and sales of 3D XPoint memory. The Embedded Business Unit segment consists of memory and storage products sold into automotive, industrial, and consumer markets.
This one didn't come up on my scans, but when I dove into the Semiconductor industry group, I looked at this chart and likely it. The PMO is rising strongly, the OBV is confirming the move with its own breakout. The SCTR is above 75 and the RSI is right where I like it, between 50 and 70. We can a "golden cross" lining up which would give us a bullish bias. The breakout from the ascending triangle tells us to expect a move about the size of the back of the pattern height. That would put price above the February top. This is a strong stock in a hot area of the market.
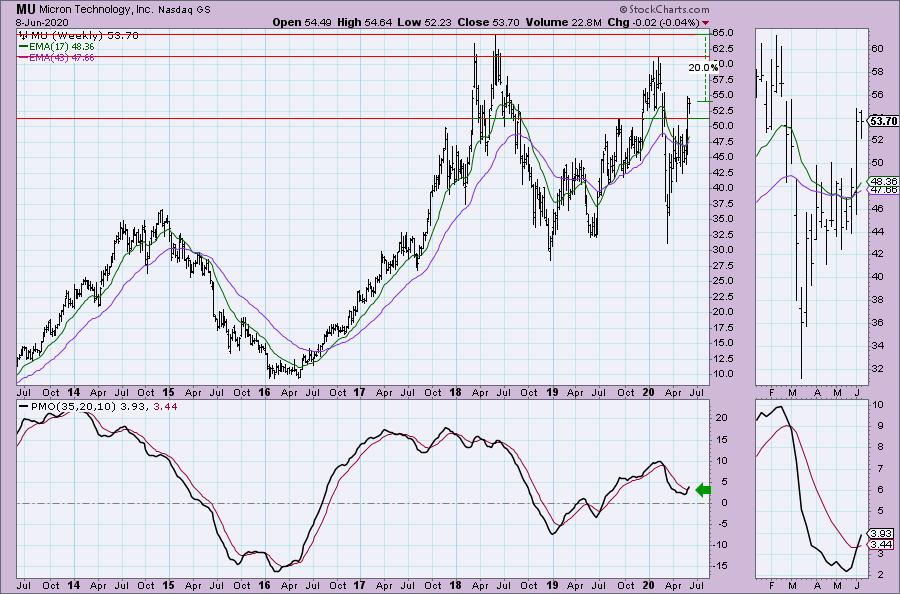
MU just triggered a weekly PMO BUY signal. Upside potential is +20% at around $65.
Teradyne Inc (TER) - Earnings: 7/21/2020 (AMC)
Teradyne, Inc. engages in the development and sale of self automatic test systems. It operates through the following segments: Semiconductor Test, Industrial Automation, System Test, and Wireless Test. The Semiconductor Test segment designs, manufactures, and markets semiconductor test products and services. The Industrial Automation segment includes the operations related to design and manufacture of collaborative robotic arms, mobile robots, and advanced robotic control software. The System Test segment comprises the marketing of products and services for defense instrumentation test, storage test, and circuit-board test. The Wireless Test segment consists wireless test products and services.
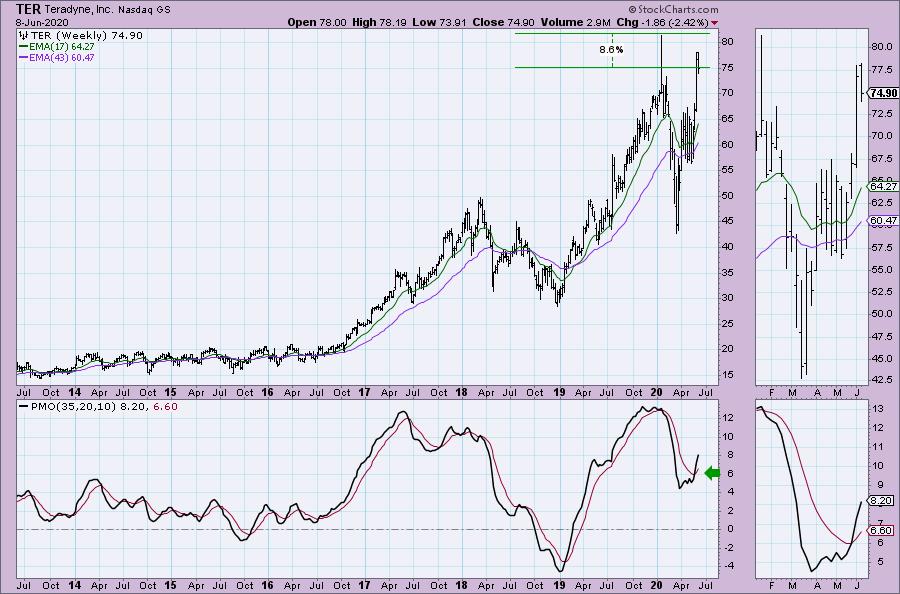
Here is another Semiconductor that broke out and then has pulled back. The RSI tells us that despite this strong rally, price isn't that overbought. The OBV is confirming the move and it actually portended this rally as it set up a nice positive divergence in April/May. The stop level I've marked is just below the April top. The PMO is rising strongly and the SCTR is above 75.
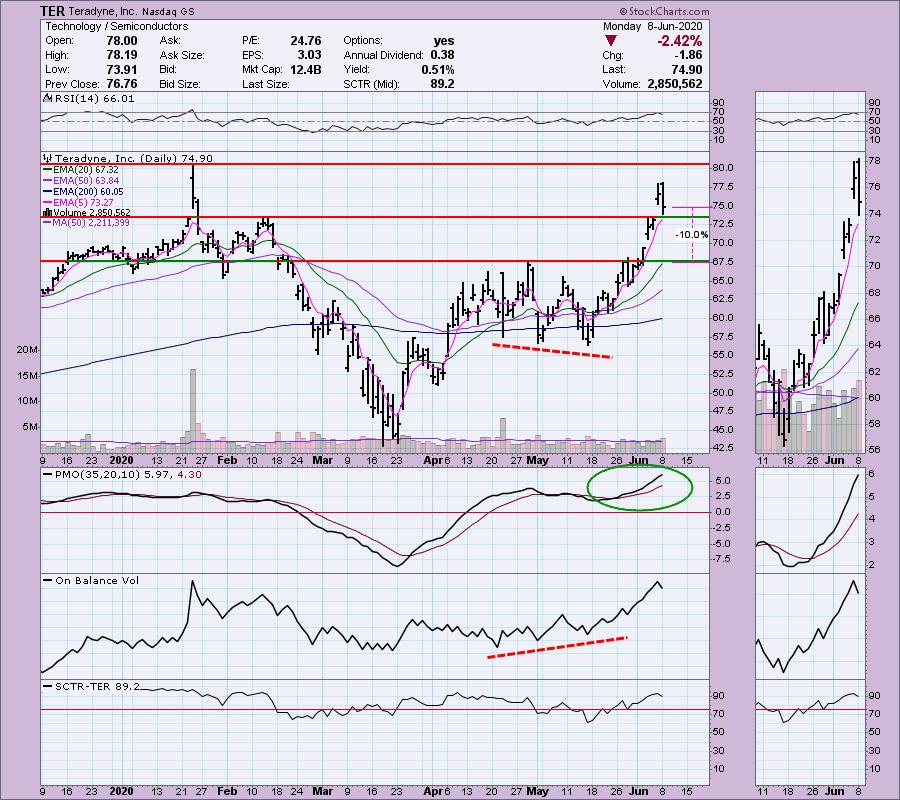
Another Semiconductor with a new weekly PMO BUY signal. While the upside target is only 8.5% away, I would expect higher prices. That might be a good analysis point to see if the charts still look positive and ready to support a breakout to new all-time highs.
Vapotherm Inc (VAPO) - Earnings: 7/27/2020 (AMC)
Vapotherm, Inc. is a medical technology company, which engages in the development and commercialization of medical devices for patients suffering from respiratory distress. Its products include Precision Flow, Precision Flow Heliox, Oxygen Assist Module, Nitric Oxidie Disposable Patient Circuit, Tracheostomy Adapter, and Aerogen Adapter.
Here is my non-semiconductor. This chart was very enticing because it appears the PMO is turning up on this breakout. Volume is coming in and price has followed it higher. The RSI is only somewhat overbought. I've annotated a flag formation. The calculated minimum upside target would be around $41. Notice that we had an OBV positive divergence that led into the current rally. I've set the stop level rather low mainly because I don't see any other support level that makes sense. For now I'm lining it up with the top back in May.
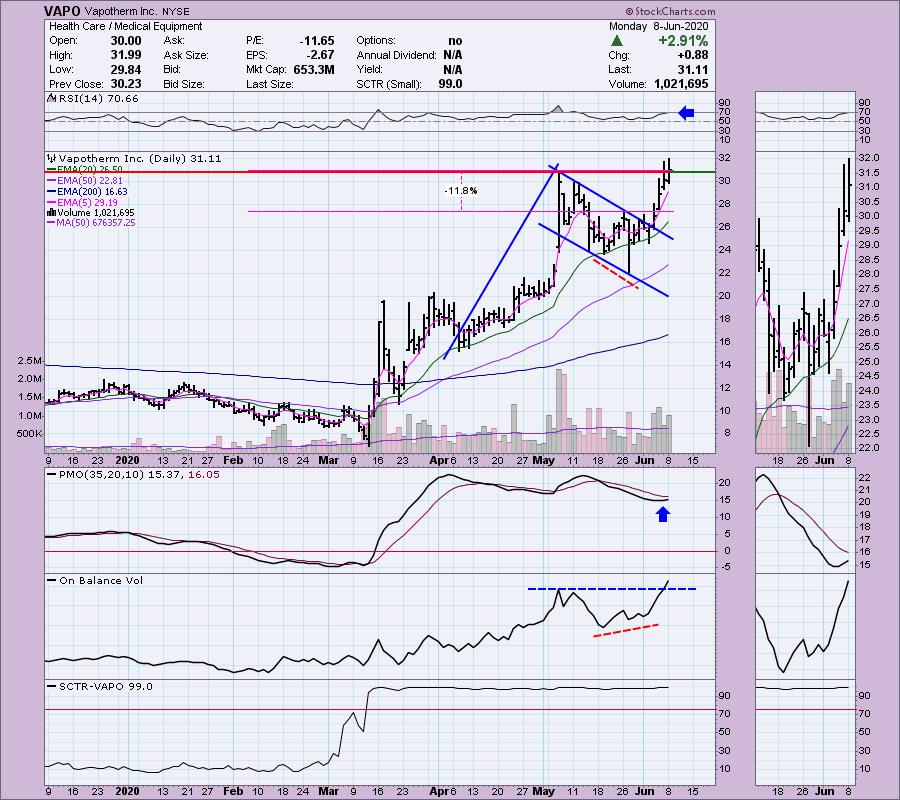
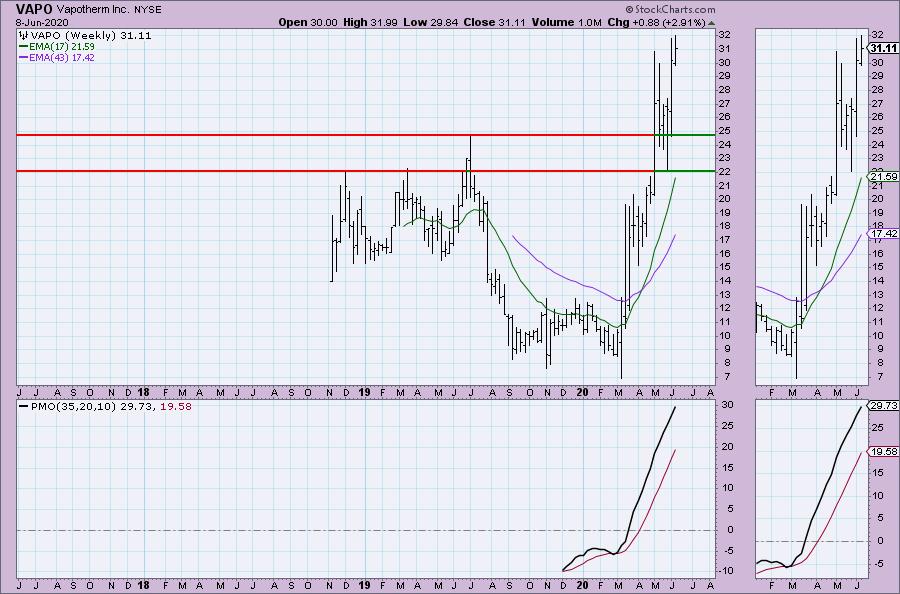
Not much to see on the weekly chart. I do note that today it set a new intraday all-time high.
Current Market Outlook:
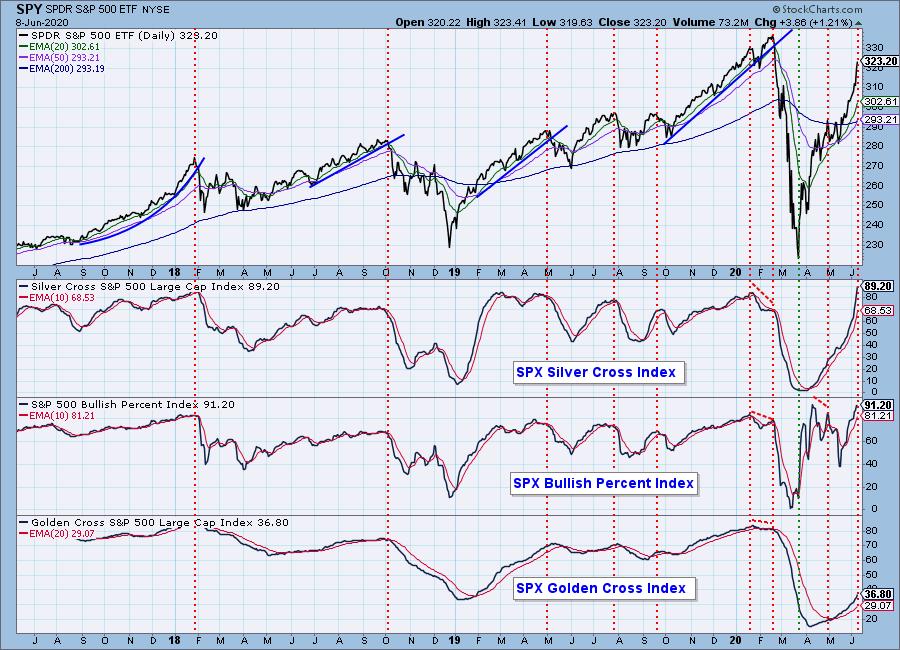
Market Environment: It is important to consider the odds for success. The Silver Cross Index measures the percentage of stocks on IT Trend Model BUY signals (20-EMA > 50-EMA), while the Golden Cross Index measures the percentage of stocks on LT Trend Model BUY signals (50-EMA > 200-EMA). Don't forget that as a "Diamonds" member, you have access to our GCI/SCI curated ChartList on DecisionPoint.com. You'll find it under "Members Only" links on the left side on the Blogs and Links Page. Here are the current percentages on the Silver and Golden Cross Indexes:
Diamond Index:
- Diamond Scan Results: 2
- Diamond Dog Scan Results: 0
- Diamond Bull/Bear Ratio: 2.00
For a more comprehensive review of current market conditions as well as analysis of Dollar, Gold, Oil and Bonds, subscribe to the DecisionPoint Alert! For a LIMITED TIME you can get a coupon code that will give you a discount for bundling your Diamonds subscription with the DecisionPoint Alert! Contact support@decisionpoint.com for more details.
Full Disclosure: I'm likely going to add AMKR and MU to my personal portfolio tomorrow. I am currently 40% in cash.

Erin Swenlin will be presenting at the The MoneyShow Las Vegas August 16 - 20 at Bally's/Paris Resort! You'll have an opportunity to meet Erin and discuss the latest DecisionPoint news and Diamond Scans. Claim your FREE pass here! You can watch online with this pass too!! There will be online events held in May and when I have more information I'll let you know.
Watch the latest episode of DecisionPoint with Carl & Erin Swenlin on Thursdays 8:00a EST or on the DecisionPoint playlist on the StockCharts TV YouTube channel here!
Technical Analysis is a windsock, not a crystal ball.
Happy Charting!
- Erin
erin@decisionpoint.com
NOTE: The stocks reported herein are from mechanical trading model scans that are based upon moving average relationships, momentum and volume. DecisionPoint analysis is then applied to get five selections from the scans. The selections given should prompt readers to do a chart review using their own analysis process. This letter is not a call for a specific action to buy, sell or short any of the stocks provided. There are NO sure things or guaranteed returns on the daily selection of "diamonds in the rough."
Helpful DecisionPoint Links:
DecisionPoint Shared ChartList and DecisionPoint Chart Gallery
Price Momentum Oscillator (PMO)
Swenlin Trading Oscillators (STO-B and STO-V)
For more links, go to DecisionPoint.com!
f